Example of DFD for Online Store (Data Flow Diagram) DFD Example
Data Flow Diagram (DFD) is a methodology of graphical structural analysis and information systems design, which describes the sources external in respect to the system, recipients of data, logical functions, data flows and data stores that are accessed. DFDs allow to identify relationships between various system's components and are effectively used in business analysis and information systems analysis. They are useful for system’s high-level details modeling, to show how the input data are transformed to output results via the sequence of functional transformations. For description of DFD diagrams are uses two notations — Yourdon and Gane-Sarson, which differ in syntax. Online Store DFD example illustrates the Data Flow Diagram for online store, the interactions between Customers, Visitors, Sellers, depicts User databases and the flows of Website Information. ConceptDraw PRO enhanced with Data Flow Diagrams solution lets you to draw clear and simple example of DFD for Online Store using special libraries of predesigned DFD symbols.
Entity Relationship Diagram Software Engineering
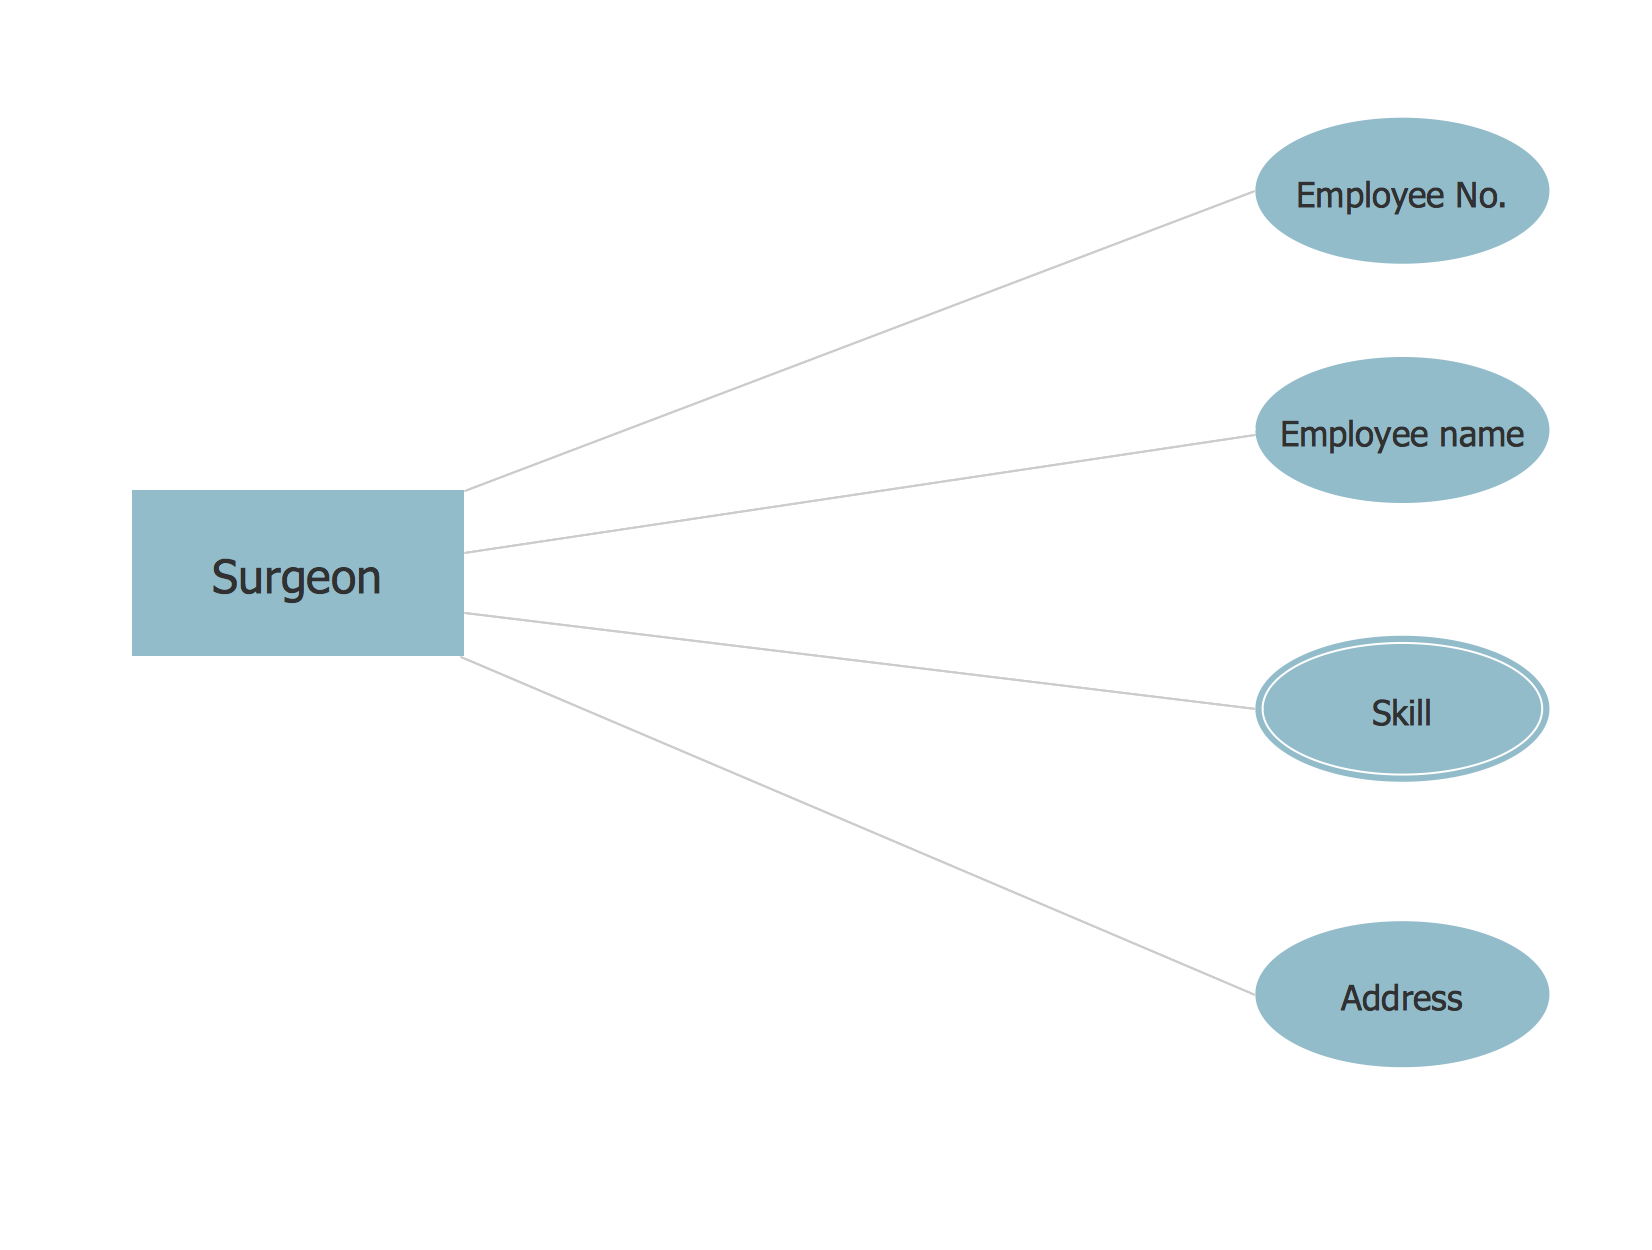
Entity Relationship Diagram (aka ER Diagram, E-R Diagram, ERD) is a time-tested and widespread software development and software engineering method for data modeling, illustrating the logical structure of databases and system design. For ERDs construction are used three basic elements: entities, attributes, and relationships. Chen's notation for ERD supposes the use of rectangles (boxes) to represent entities and diamonds to depict relationships between first-class objects. This notation is popular when creating conceptual data models of information systems. Another standardized notation for ER diagrams is Crow's foot notation. ConceptDraw PRO as a powerful Entity Relationship Diagram software engineering provides the tools of Entity-Relationship Diagram (ERD) solution from Software Development area of ConceptDraw Solution Park for instantly describing databases using ERDs of Crow’s Foot and Chen’s notations. Use the predesigned vector elements for both these notations from 2 libraries included to Entity-Relationship Diagram (ERD) solution.Chen ERD Diagram
The vector stencils library Chen ERD from the solution Entity-Relationship Diagrams (ERD) contains specific symbols of the Chen ERD notation including entity symbols and relationship symbols for ConceptDraw PRO diagramming and vector drawing software. The Entity-Relationship Diagrams (ERD) solution is contained in the Software Development area of ConceptDraw Solution Park.UML Component Diagram Example - Online Shopping
UML Component Diagram Online Shopping. This sample was created in ConceptDraw PRO diagramming and vector drawing software using the UML Component Diagram library of the Rapid UML Solution from the Software Development area of ConceptDraw Solution Park. This sample shows the concept of the online shopping and is used for the understanding of the online shopping processes, of the online shops working processes, for projection and creating of the online stores.UML Use Case Diagram Example Social Networking Sites Project
UML Diagrams Social Networking Sites Project. This sample was created in ConceptDraw PRO diagramming and vector drawing software using the UML Use Case Diagram library of the Rapid UML Solution from the Software Development area of ConceptDraw Solution Park. This sample shows the Facebook Socio-health system and is used at the projection and creating of the social networking sites.HelpDesk
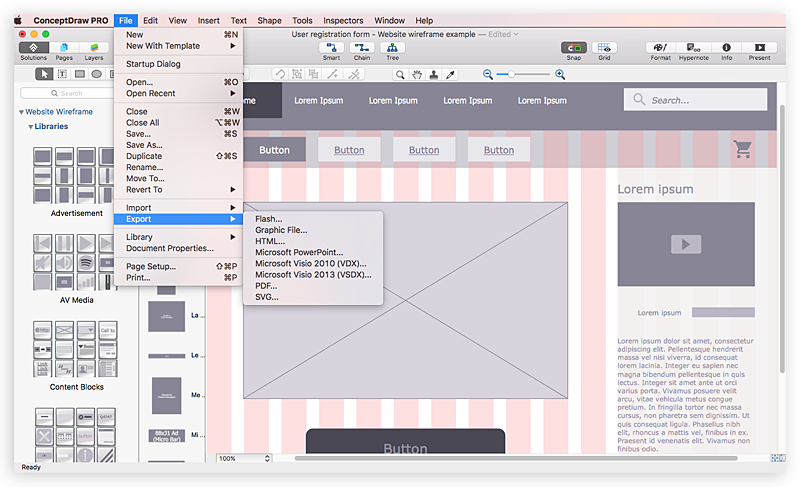
How to Develop Website Wireframes Using ConceptDraw PRO
Website design is a rather complicated process. The development of a website wireframe is an important step in any screen design process. The first step of this process before coding can start, web designer creates a website wireframe — a mock-up for what will be displayed on the screen when navigating through the web site pages. A wireframe design always includes three components:Information design, navigation design and interface design. The configuration of these components depends on the business model of the website. The Website Wireframing tools provided with ConceptDraw Website Wireframe solution helps to define the information hierarchy of website design, making it easier for web-developers to plan the layout according to how a site visitor have to process the information.UML Deployment Diagram Example - ATM System UML diagrams
The UML Deployment Diagram is used for visualization of elements and components of a program, that exist at the stage of its execution. It contains graphical representations of processors, devices, processes, and relationships between them. The UML Deployment Diagram allows to determine the distribution of system components on its physical nodes, to show the physical connections between all system nodes at the stage of realization, to identify the system bottlenecks and reconfigure its topology to achieve the required performance. The UML Deployment diagram is typically developed jointly by systems analysts, network engineers and system engineers. ConceptDraw PRO diagramming and vector drawing software with Rapid UML solution from Software Development area of ConceptDraw Solution Park perfectly suits for designing different types of UML diagrams, including the UML Deployment Diagrams. There are included a lot of design elements, templates, examples and samples, among them an example of work of ATM (Automated Teller Machine) banking system.
 eLearning for Skype
This solution extends ConceptDraw MINDMAP software with the ability to prepare and run remote learning sessions by using Skype
 ATM UML Diagrams
The ATM UML Diagrams solution lets you create ATM solutions and UML examples. Use ConceptDraw PRO as a UML diagram creator to visualize a banking system.
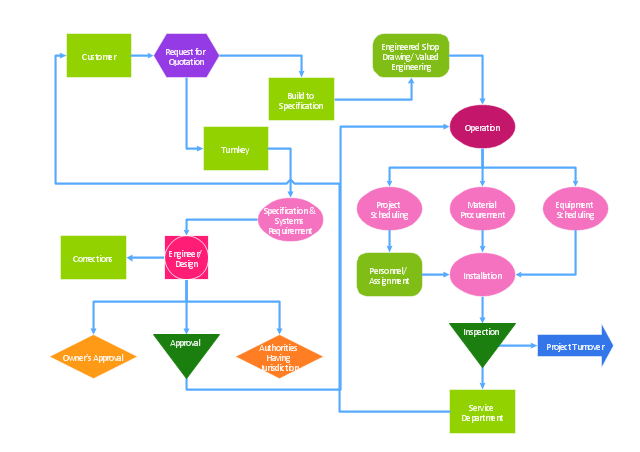
"The Process Flow Chart provides a visual representation of the steps in a process. ...
When to Use:
One of the first activities of a process improvement effort is constructing a flowchart. It provides the following benefits:
1- It give you and everyone a clear understanding of the process.
2- Facilitates teamwork and communication.
3- Helps to identify non-value-added operations."
[bexcellence.org/ Flow-Chart.html]
This TQM diagram example shows a business process that can be then analyzed to improve the effectiveness and diagnose quality issues that require resolution.
This example was created using the ConceptDraw PRO diagramming and vector drawing software extended with the Total Quality Management (TQM) Diagrams solution from the Quality area of ConceptDraw Solution Park.
- Er Diagram For Online Shopping System
- Entity-Relationship Diagram (ERD) | Er Diagram For Online Shopping
- Entity-Relationship Diagram (ERD) | Online Shopping Er Diagram
- Wireframe Tools | Er Diagram For Online Cosmetic Shopping ...
- Entity Relationship Diagram - ERD - Software for Design Crows Foot ...
- Entity-Relationship Diagram (ERD) | Er Diagram Of Online Shopping ...
- Online Shopping Project Entity Relationship Diagram
- Er Diagram Of Online Furniture Shopping
- Entity-Relationship Diagram (ERD) | ConceptDraw Solution Park ...


