HelpDesk
How to Create an Entity-Relationship Diagram
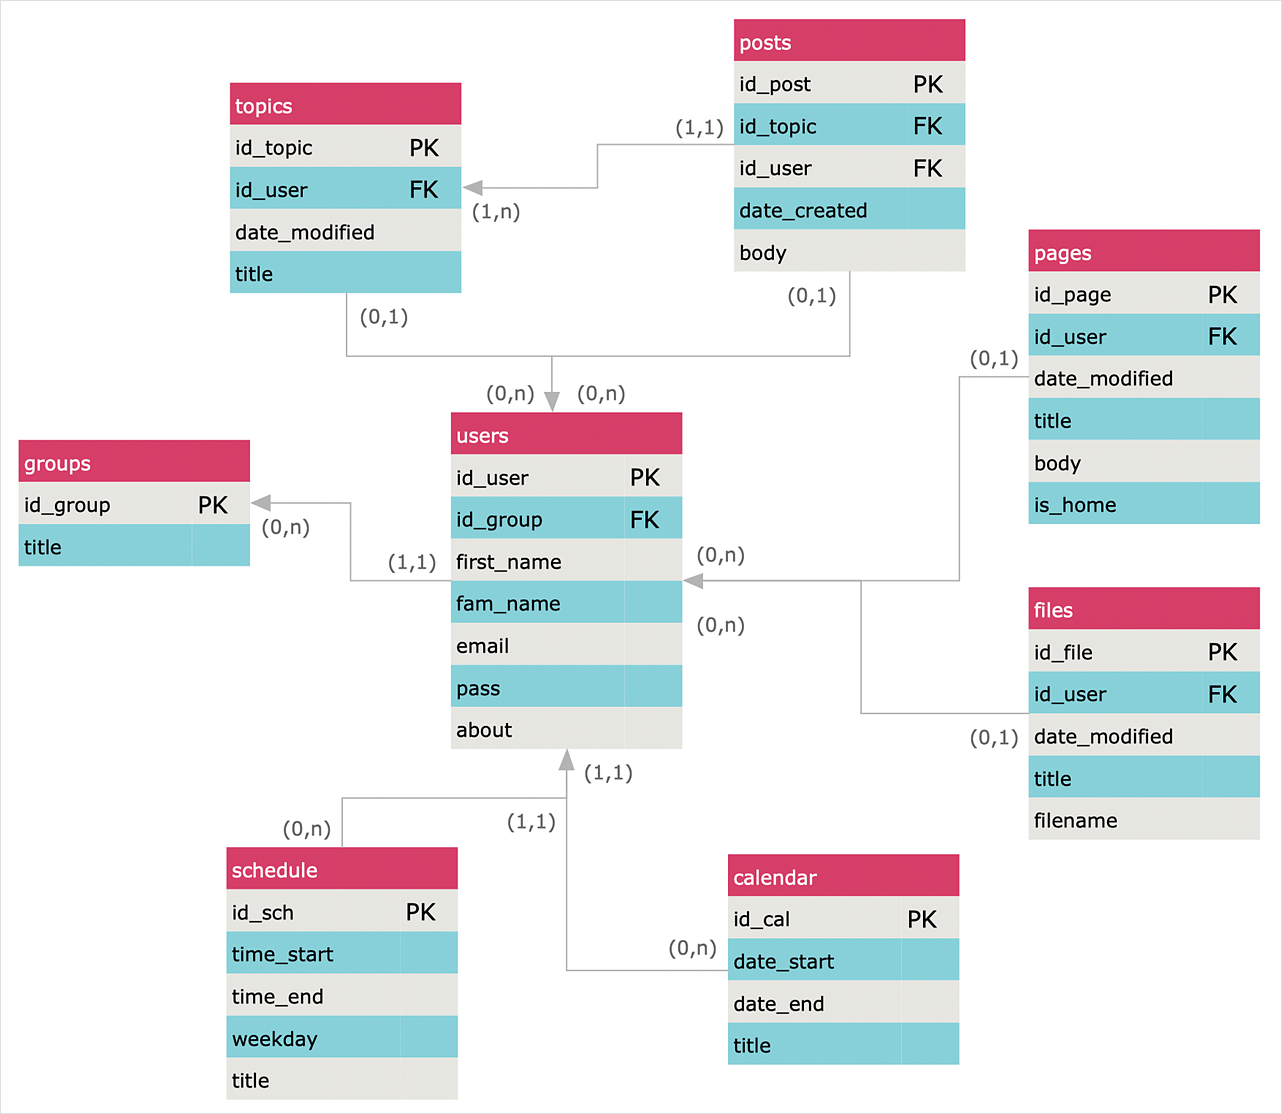
ERD (entity relationship diagram) is used to show the logical structure of databases. It represents the interrelationships between components of a database (entities). Entity relationship diagrams are widely used in software engineering. Using ERD software engineers can control every aspect of database development. ER diagram can be used as the guide for testing and communicating before the release of a software product. ERD displays data as entities that are connected with connections that show the relationships between entities. There are some ERD notations used by databases developers for representing the relationships between the data objects. ConceptDraw DIAGRAM and its ERD solution allow you to build ERD diagram of any notation.HelpDesk
How to Create an Entity-Relationship Diagram Using ERD Solution
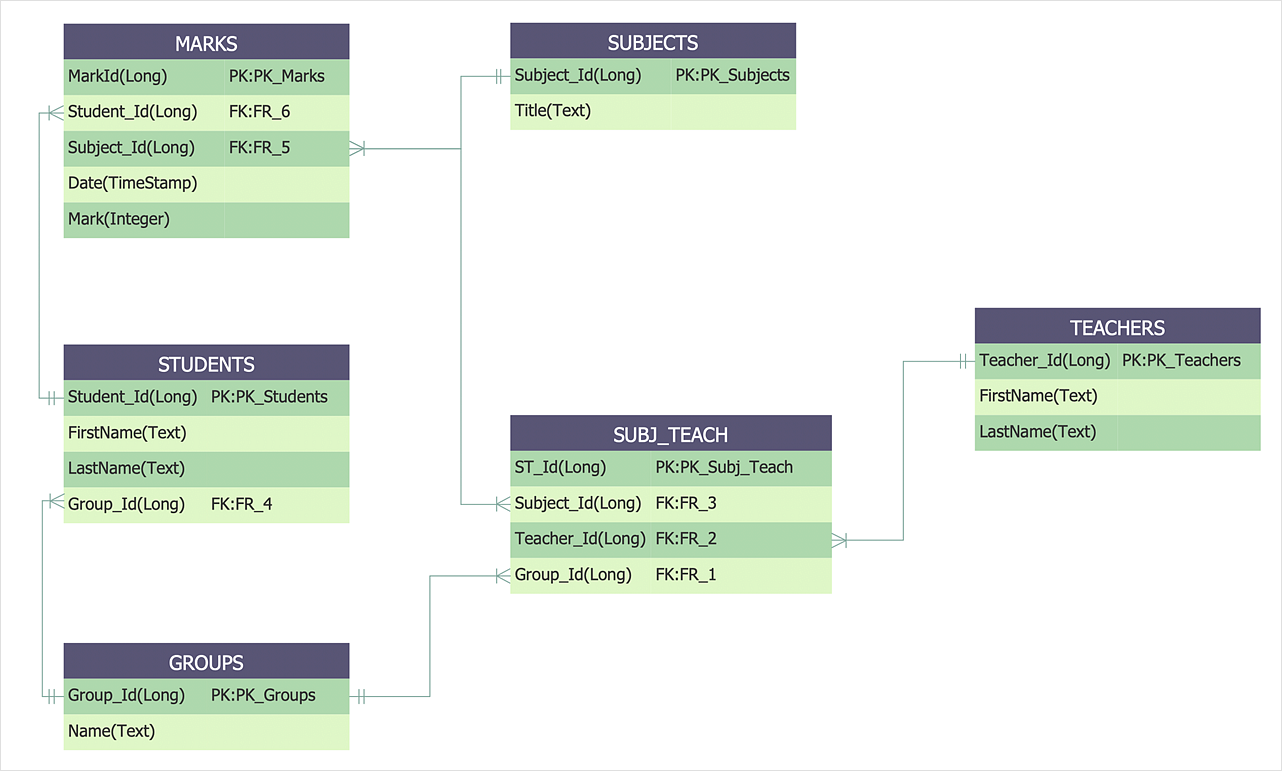
An entity-relationship diagram (ERD)is used in a database modeling process. ERD diagram shows a graphical representation of objects or concepts within an information system and their relationships. The ability to describe a database using the Entity-Relationship model is delivered by the ConceptDraw ERD solution.
 Entity-Relationship Diagram (ERD)
An Entity-Relationship Diagram (ERD) is a visual presentation of entities and relationships. That type of diagrams is often used in the semi-structured or unstructured data in databases and information systems. At first glance ERD is similar to a flowch
Data structure diagram with ConceptDraw DIAGRAM
Data structure diagram (DSD) is intended for description of conceptual models of data (concepts and connections between them) in the graphic format for more obviousness. Data structure diagram includes entities description, connections between them and obligatory conditions and requirements which connect them. Create Data structure diagram with ConceptDraw DIAGRAM.
 ConceptDraw Solution Park
ConceptDraw Solution Park collects graphic extensions, examples and learning materials
 Business Processes
Business Process solution extends ConceptDraw DIAGRAM software with business process diagrams as cross-functional flowcharts, workflows, process charts, IDEF0, timelines, calendars, Gantt charts, business process modeling, audit and opportunity flowcharts.
 Accounting Flowcharts
Accounting Flowcharts solution extends ConceptDraw DIAGRAM software with templates, samples and library of vector stencils for drawing the accounting flow charts.
Software development with ConceptDraw DIAGRAM
Modern software development requires creation of large amount of graphic documentation, these are the diagrams describing the work of applications in various notations and cuts, also GUI design and documentation on project management. ConceptDraw DIAGRAM technical and business graphics application possesses powerful tools for software development and designing technical documentation for object-oriented projects. Solutions included to the Software Development area of ConceptDraw Solution Park provide the specialists with possibility easily and quickly create graphic documentation. They deliver effective help in drawing thanks to the included package of templates, samples, examples, and libraries with numerous ready-to-use vector objects that allow easily design class hierarchies, object hierarchies, visual object-oriented designs, flowcharts, GUI designs, database designs, visualize the data with use of the most popular notations, including the UML and Booch notations, easy manage the development projects, automate projection and development.
 Cross-Functional Flowcharts
Cross-functional flowcharts are powerful and useful tool for visualizing and analyzing complex business processes which requires involvement of multiple people, teams or even departments. They let clearly represent a sequence of the process steps, the order of operations, relationships between processes and responsible functional units (such as departments or positions).
 Audit Flowcharts
Audit flowcharts solution extends ConceptDraw DIAGRAM software with templates, samples and library of vector stencils for drawing the audit and fiscal flow charts.
HelpDesk
How To Create a Concept Map in Visio
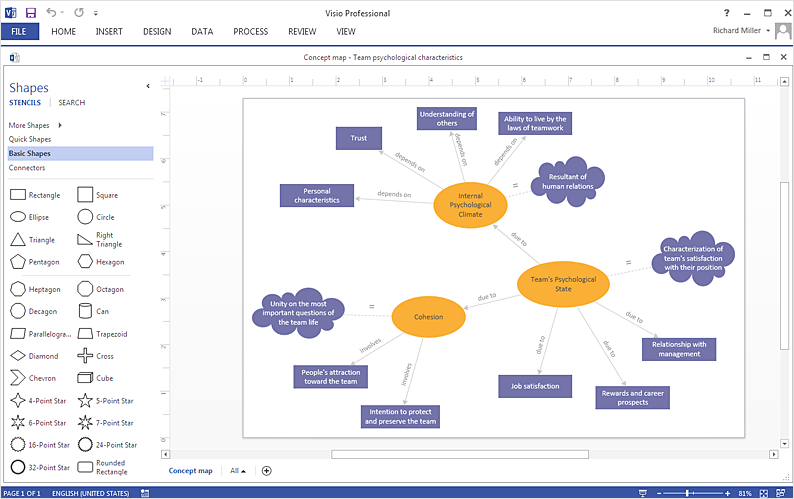
ConceptDraw DIAGRAM allows you to easily create concept maps and then make an MS Visio file from your diagrams in a few simple steps.
 Basic Diagramming
This solution extends ConceptDraw DIAGRAM software with the specific tools you need to easily draw flowcharts, block diagrams, histograms, pie charts, divided bar diagrams, line graphs, circular arrows diagrams, Venn diagrams, bubble diagrams and concept maps
- Entity Relationship Diagram Symbols and Meaning ERD Symbols ...
- Database Flowchart Symbols | Basic Flowchart Symbols and ...
- Data Flow Diagram Symbols. DFD Library | Entity Relationship ...
- Entity Relationship Diagram Symbols and Meaning ERD Symbols ...
- Entity-Relationship Diagram ( ERD ) | Pyramid Diagrams | Types of ...
- Entity-Relationship Diagram ( ERD ) | Process Flowchart | Venn ...
- Components of ER Diagram | Process Flowchart | Data Flow ...
- Exercise Er Model Solution
- Basic Flowchart Symbols and Meaning | Design elements - IDEF0 ...
- Components of ER Diagram | Data Flow Diagrams with ...
- Components of ER Diagram | Entity-Relationship Diagram ( ERD ...
- Entity-Relationship Diagram ( ERD ) | Process Flowchart | Interactive ...
- ERD Symbols and Meanings | Process Flowchart | Er Diagram ...
- Er Diagram And Flow Charts Of Accounting Software System
- ConceptDraw PRO ER Diagram Tool | Good Flow Chart app for Mac ...
- Erd Flowchart Mac
- Entity-Relationship Diagram ( ERD ) | Cross Functional Flowchart for ...
- Entity-Relationship Diagram ( ERD ) | Flowchart Examples and ...
- Components of ER Diagram | Process Flowchart | Entity ...
- Entity Relationship Modeling For An Event Management


