 CRM Center Dashboard
The CRM Center Dashboard solution extends ConceptDraw DIAGRAM functionality with CRM software tools, large collection of CRM Charts live objects, CRM icons, CRM indicators, CRM maps and navigation elements, the set of professionally designed CRM samples and templates to help you construct your own CRM Dashboards and CRM Center Dashboards in a few minutes, to depict the current and actual data by connecting or refreshing the data source file. The customer management software ConceptDraw DIAGRAM makes you free to choose the style for your dashboard and to regulate the quantity of clipart on the diagram according to your taste.
 Entity-Relationship Diagram (ERD)
Entity-Relationship Diagram (ERD) solution extends ConceptDraw DIAGRAM software with templates, samples and libraries of vector stencils from drawing the ER-diagrams by Chen's and crow’s foot notations.
How to Help Customers be More Productive
Presenting you with a drawing program which could really surprise you with their great functionality. Don't know how to start to draw Connector's improvement? Curious how should diagramming software work? Drawing programs involve a lot of things like designs in an illustrative way, creating an cherts, Tools to create high end graphics, create dashboards, using your data and many other technical aspects do it in a much professional and in a quick way.ConceptDraw DIAGRAM ER Diagram Tool
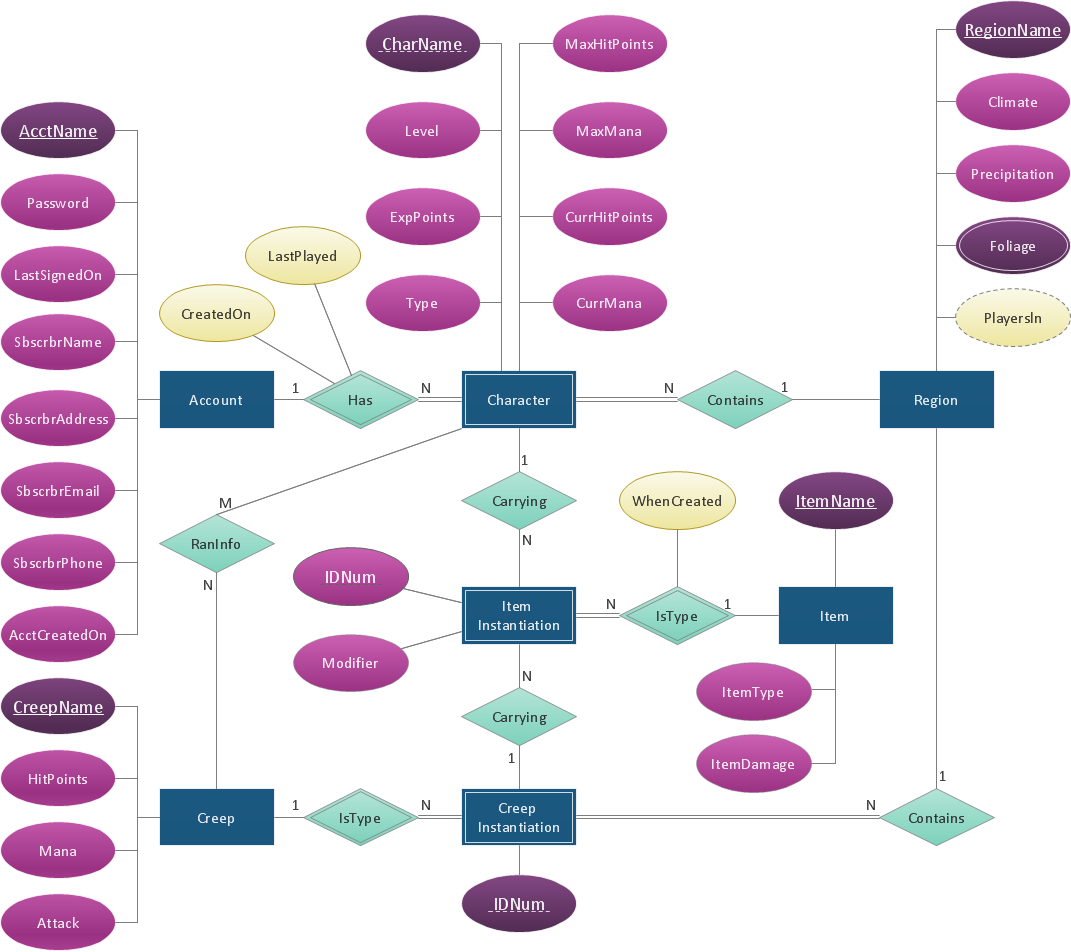
Entity-relationship model, also called ER-model, is the main tool of domain modeling on the stage of conceptual design. The modeling of domain data structures is based on the use of graphical tools - Entity-Relationship diagrams (ER-diagrams). The core concepts of ER-Diagram are entity, attribute and relationship. ER-diagram lets visually represent the entities, helps effectively document all properties of designed system and to detail the data storages. To represent the elements at ER-model are commonly used Chen’s notation and Crow’s foot notation, each has its pros and cons. The entity on ER-diagram is represented in the form of rectangle, which specifies its name. An attribute is a property of the entity and relationship is an interaction between the entities. The relationship between two entities is called binary, between more than two entities - ternary. Specific software, such as ConceptDraw DIAGRAM with Entity-Relationship Diagram (ERD) solution from ConceptDraw Solution Park is helpful for easy creation Entity-Relationship Diagrams.Entity Relationship Software
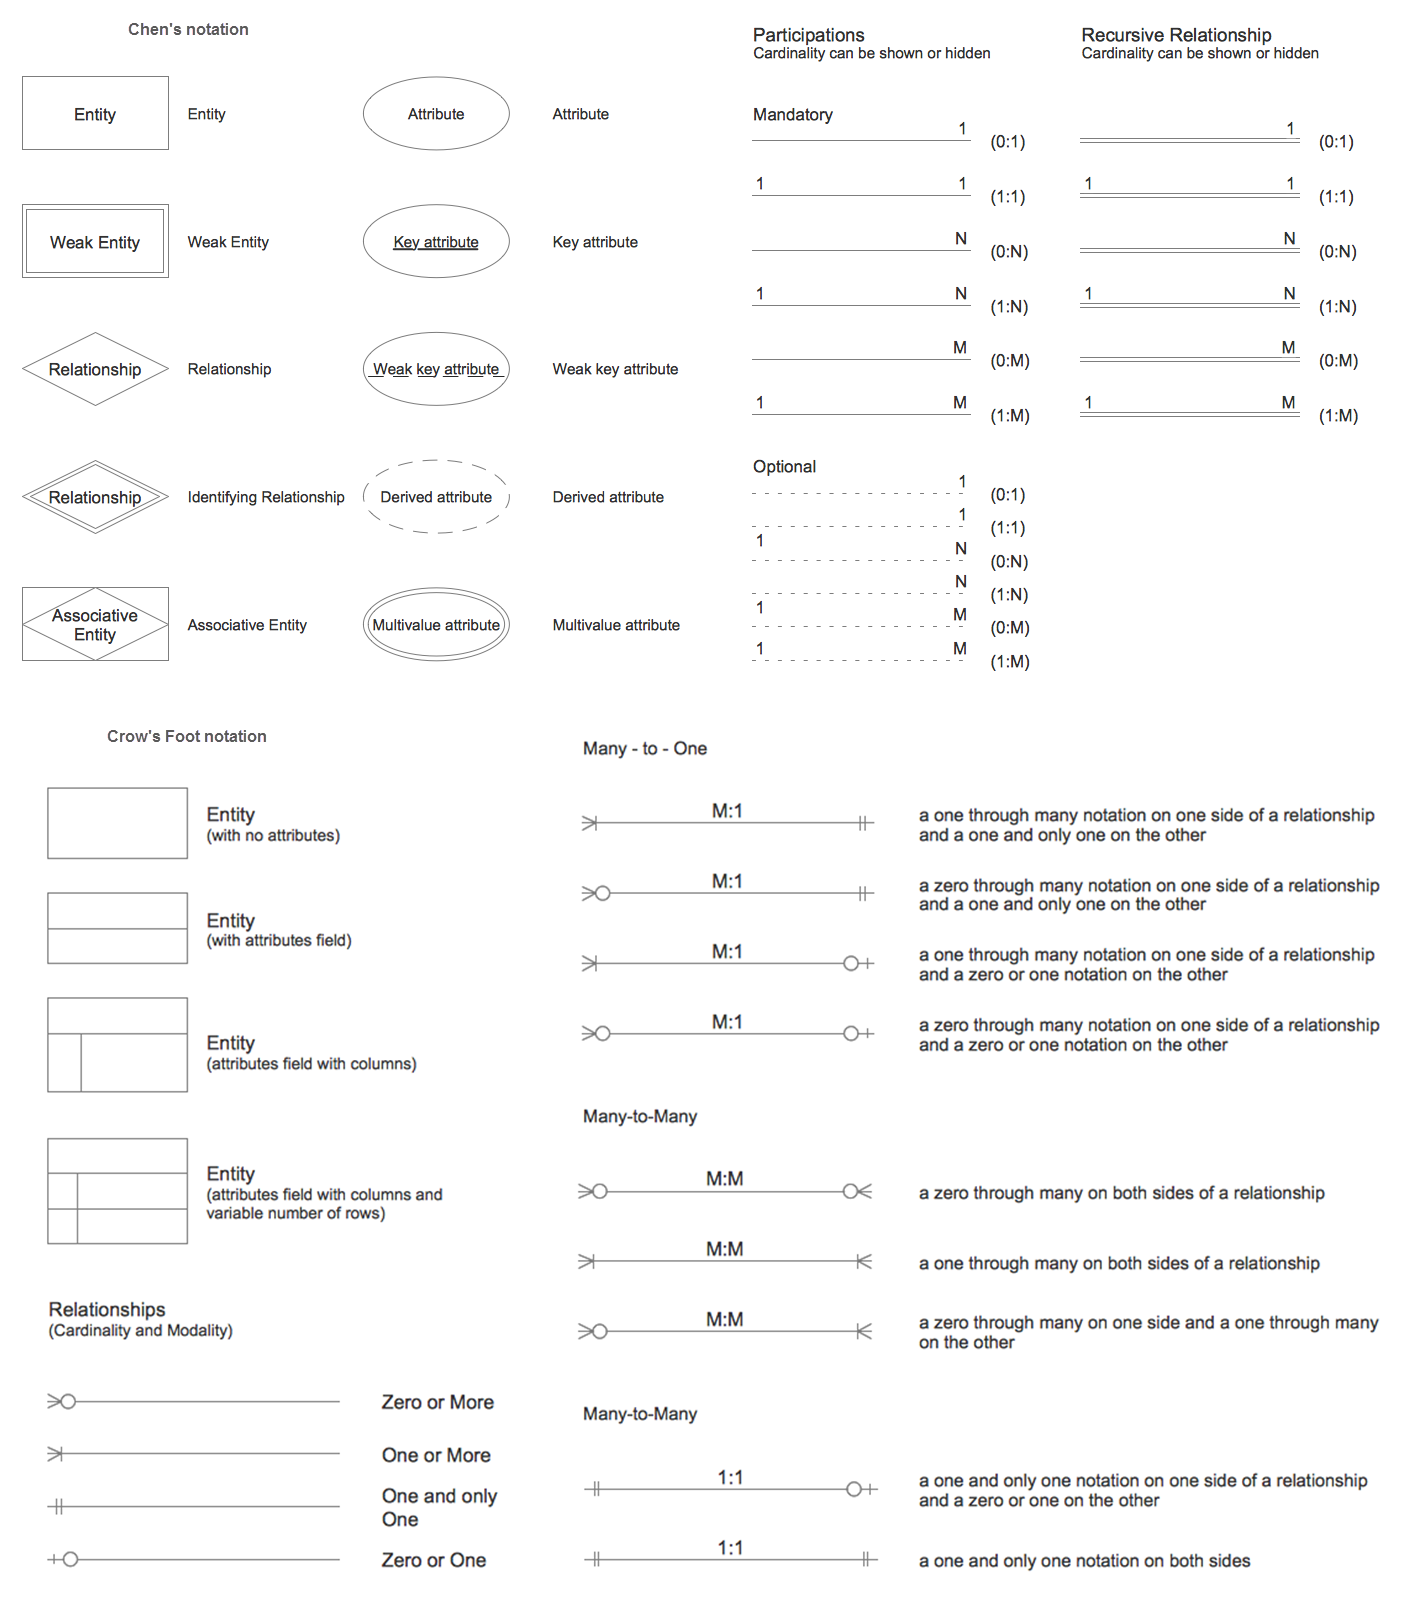
Entity Relationship Diagram (ERD) is a leading data modeling tool that is used to illustrate the logical structure of database, helps to organize and represent your project's data in terms of entities, attributes and relationships. To describe the database structure usually is used the ERD Chen's or Crow's Foot notation. Chen's notation supposes the representation of entities by rectangles with the entities names inside, relationships by diamonds and attributes by ovals connected with a line to exactly one entity. In Crow's Foot notation the boxes are used to depict the entities and their attributes, the lines between them - to depict relationships. ConceptDraw DIAGRAM software extended with Entity-Relationship Diagram (ERD) Solution is convenient and useful for designing the ER Diagrams, and supports the use of Chen's or Crow’s Foot notation according to your needs and desires. The ERD diagrams produced with ConceptDraw DIAGRAM Entity Relationship Diagram software can be successfully used in whitepapers, presentations, posters, datasheets, technical materials, etc.Pyramid Diagram
The purchase or purchasing funnel is a consumer focused marketing model which illustrates the theoretical customer journey towards the purchase of a product or service.Entity-Relationship Diagram (ERD) with ConceptDraw DIAGRAM
Entity-Relationship Diagram (ERD) is applied for detailed description of structures and high-level (conceptual) design databases using the Chen's and Crow's Foot notations. An ERD represents a diagram constructed mainly of rectangular blocks (for entities, data) linked with relationships. The links between the blocks are used to describe relations between the entities. There are three types of relationships: one-to-one, one-to-many, and many-to-many. Use the specialized ERD software - ConceptDraw DIAGRAM to create the Entity-Relationship Diagrams (ERDs) of any degree of complexity with Chen's and Crow's Foot notations. Draw them easily applying the powerful built-in tools and libraries of predesigned ERD vector objects from Entity-Relationship Diagram (ERD) solution from the Software Development area of ConceptDraw Solution Park. You can also start with one of ready template or sample included to this solution. Designing the ERDs in ConceptDraw DIAGRAM you can easy move the objects within a diagram with saving the relationships between them.
Entity-Relationship Diagram
Entity Relationship Diagram (ERD) is the world-known way to show the logical structure of databases in visual manner. The best software tool for drawing Entity-Relationship Diagram is ConceptDraw DIAGRAM ector graphics software with Entity-Relationship Diagram (ERD) solution from Software Development area which gives the ability to describe a database using the Entity-Relationship model. The vector graphic diagrams produced using this solution can be successfully used in whitepapers, presentations, datasheets, posters, or any technical materials.Entity Relationship Diagram Symbols
The semantic modeling method nowadays is successfully applied in database structure design. It is effective method of modeling the data structures, which is based on the meaning of these data. As a tool of semantic modeling, there are used different types of Entity-Relationship Diagrams. Entity Relationship Diagram (ERD) is applied to visually and clearly represent a structure of a business database. The main components of ERDs are: entity, relation and attributes. An entity is a class of similar objects in the model, each entity is depicted in the form of rectangle and has the name expressed by a noun. Relation is shown in the form of non-directional line that connects two entities. There are several notation styles used for ERDs: information engineering style, Chen style, Bachman style, Martin Style. The Entity Relationship Diagram symbols used for professional ERD drawing are predesigned by professionals and collected in the libraries of the Entity-Relationship Diagram (ERD) solution for ConceptDraw DIAGRAM software.Project —Task Trees and Dependencies
Users new to ConceptDraw PROJECT will find the Basic lessons an essential platform for familiarizing themselves with the program′s functions. This video lesson will teach you how to set up task trees and dependencies.The vector stencils library "Meter indicators" contains 29 Live Objects: speedometer gauge, dial, bullet graph, slider and level meter visual indicators.
The Live Objects designed to display actual measures of performance metrics and KPIs from external data source files.
Some of them also display comparative measures, and colored zones of qualitative ranges with legend.
Use it to draw business performance dashboards using the ConceptDraw PRO diagramming and vector drawing software .
"Digital dashboards may be laid out to track the flows inherent in the business processes that they monitor. Graphically, users may see the high-level processes and then drill down into low level data. This level of detail is often buried deep within the corporate enterprise and otherwise unavailable to the senior executives. ...
Specialized dashboards may track all corporate functions. Examples include human resources, recruiting, sales, operations, security, information technology, project management, customer relationship management and many more departmental dashboards. ...
Like a car's dashboard (or control panel), a software dashboard provides decision makers with the input necessary to "drive" the business. Thus, a graphical user interface may be designed to display summaries, graphics (e.g., bar charts, pie charts, bullet graphs, "sparklines," etc.), and gauges (with colors similar to traffic lights) in a portal-like framework to highlight important information. ...
Digital dashboards allow managers to monitor the contribution of the various departments in their organization. To gauge exactly how well an organization is performing overall, digital dashboards allow you to capture and report specific data points from each department within the organization, thus providing a "snapshot" of performance." [Dashboard (management information systems). Wikipedia]
The example "Design elements - Meter indicators" is included in the Meter Dashboard solution from the area "What is a Dashboard" of ConceptDraw Solution Park.
Entity Relationship Diagram - ERD - Software for Design Crows Foot ER Diagrams
ER-model is a data model which lets describe the conceptual schemes in a specific subject area. It can help to highlight the key entities and specify relationships that can be established between these entities. During the database design, it is realized the transformation of ER model into certain database scheme based on the chosen data model (relational, object, network, etc.). There are used two notations for ERDs: Crow's Foot and Chen's. Crow's Foot notation proposed by Gordon Everest represents the entity by rectangle containing its name (name must be unique within this model), and relation - by the line which links two entities involved in relationship. The relationship's plurality is graphically indicated by a "plug" on the end of the link, the optionality - by a circle. Entity-Relationship Diagrams based on Crow's Foot notation can be easily drawn using the ConceptDraw DIAGRAM. Extended with Entity-Relationship Diagram (ERD) solution, it is the best ERD diagrams software with powerful tools and ready design elements for Crow's Foot and Chen notations.
Developing Entity Relationship Diagrams
When you need to visually represent the structure of relational database, Entity relationship diagram (ERD) is a type of diagram for that case. Most entity-relationship diagrams can be built with objects from Flowchart solution or ERD Solution which contains inbuilt templates. Follow these steps to create your own custom ERD diagram. Don't be frightened if it looks complex, ConceptDraw DIAGRAM makes it easy to create an ERD, and hundreds of other diagrams, in minutes.Design Element: Chen for Entity Relationship Diagram - ERD
Entity-Relationship Diagrams (ERDs) were developed and introduced as a convenient and visual tool for the data modeling, they are the perfect way for easy determining data and also relationships between them. The first standard notation for ERD was proposed by Chen. Chen's notation is very rich on the data modeling tools and standard notation symbols and elements for drawing easy understandable Entity-relationship diagrams, Attribute diagrams, Decomposition charts, which are especially popular for designing relational databases. The entity is the main term, it is a set of instances abstract or real objects with common characteristics or attributes. Any system's object is represented by one uniquely identified entity, relationships describe the links between the entities. ConceptDraw DIAGRAM diagramming software, which includes the Entity-Relationship Diagram (ERD) solution, offers all needed tools for professional drawing ER diagrams. Specially developed vector ERD design elements according to Chen and Crow's Foot notations are indispensible for professional ERDs design.Martin ERD Diagram
The vector stencils library Crow's Foot Notation from the solution Entity-Relationship Diagrams (ERD) contains specific symbols of the Crow's foot notation such as relationship symbols and entity symbols for ConceptDraw DIAGRAM diagramming and vector drawing software. The Entity-Relationship Diagrams (ERD) solution is contained in the Software Development area of ConceptDraw Solution Park.Interaction Overview Diagram
UML Interaction Overview Diagram schematically shows a control flow with nodes and a sequence of activities that can contain interaction or sequence diagrams.
 Chen Notation
The Chen Notation solution extends ConceptDraw DIAGRAM software with rich collection of ERD samples and selection of special Chen's notation icons for effective database design, data modeling, and visual representation of relationships between the entities on the ER diagrams designed with Chen notation.
The Best Business Process Modeling Software: Comprehensive Guide
ConceptDraw DIAGRAM is a best business processes modeling software for graphical documenting processes of the company. ConceptDraw has 142 vector stencils in the 8 libraries that helps you to start using Diagramming Software for designing own Business Process Diagrams.
How to Connect Social Media DFD Flowchart with Action Maps
The Social Media Response solution creates interactive social media flow charts and action mind maps. The solution includes a video tutorial and a number of samples helping social media teams refine and organize their response process.
 Sales Flowcharts
The Sales Flowcharts solution lets you create and display sales process maps, sales process workflows, sales steps, the sales process, and anything else involving sales process management.
- Entity-Relationship Diagram ( ERD ) | Er Diagram Of Customer Services
- Entity-Relationship Diagram ( ERD ) | Sales Flowcharts | Customer ...
- Entity-Relationship Diagram ( ERD ) | Designing A Customer ...
- Entity-Relationship Diagram ( ERD ) | Er Diagram For Crm Project
- Entity-Relationship Diagram ( ERD ) | Customer Relationahip ...
- Sales Teams are Inherently Competitive | Business Graphics ...
- Sales Teams are Inherently Competitive | The Sales Process ...
- ATM UML Diagrams | How to Help Customers be More Productive
- Six Markets Model Chart | Customer Relationship Management ...
- Entity-Relationship Diagram ( ERD ) | How to Help Customers be ...


_Win_Mac.png)


