ER diagram tool for OS X
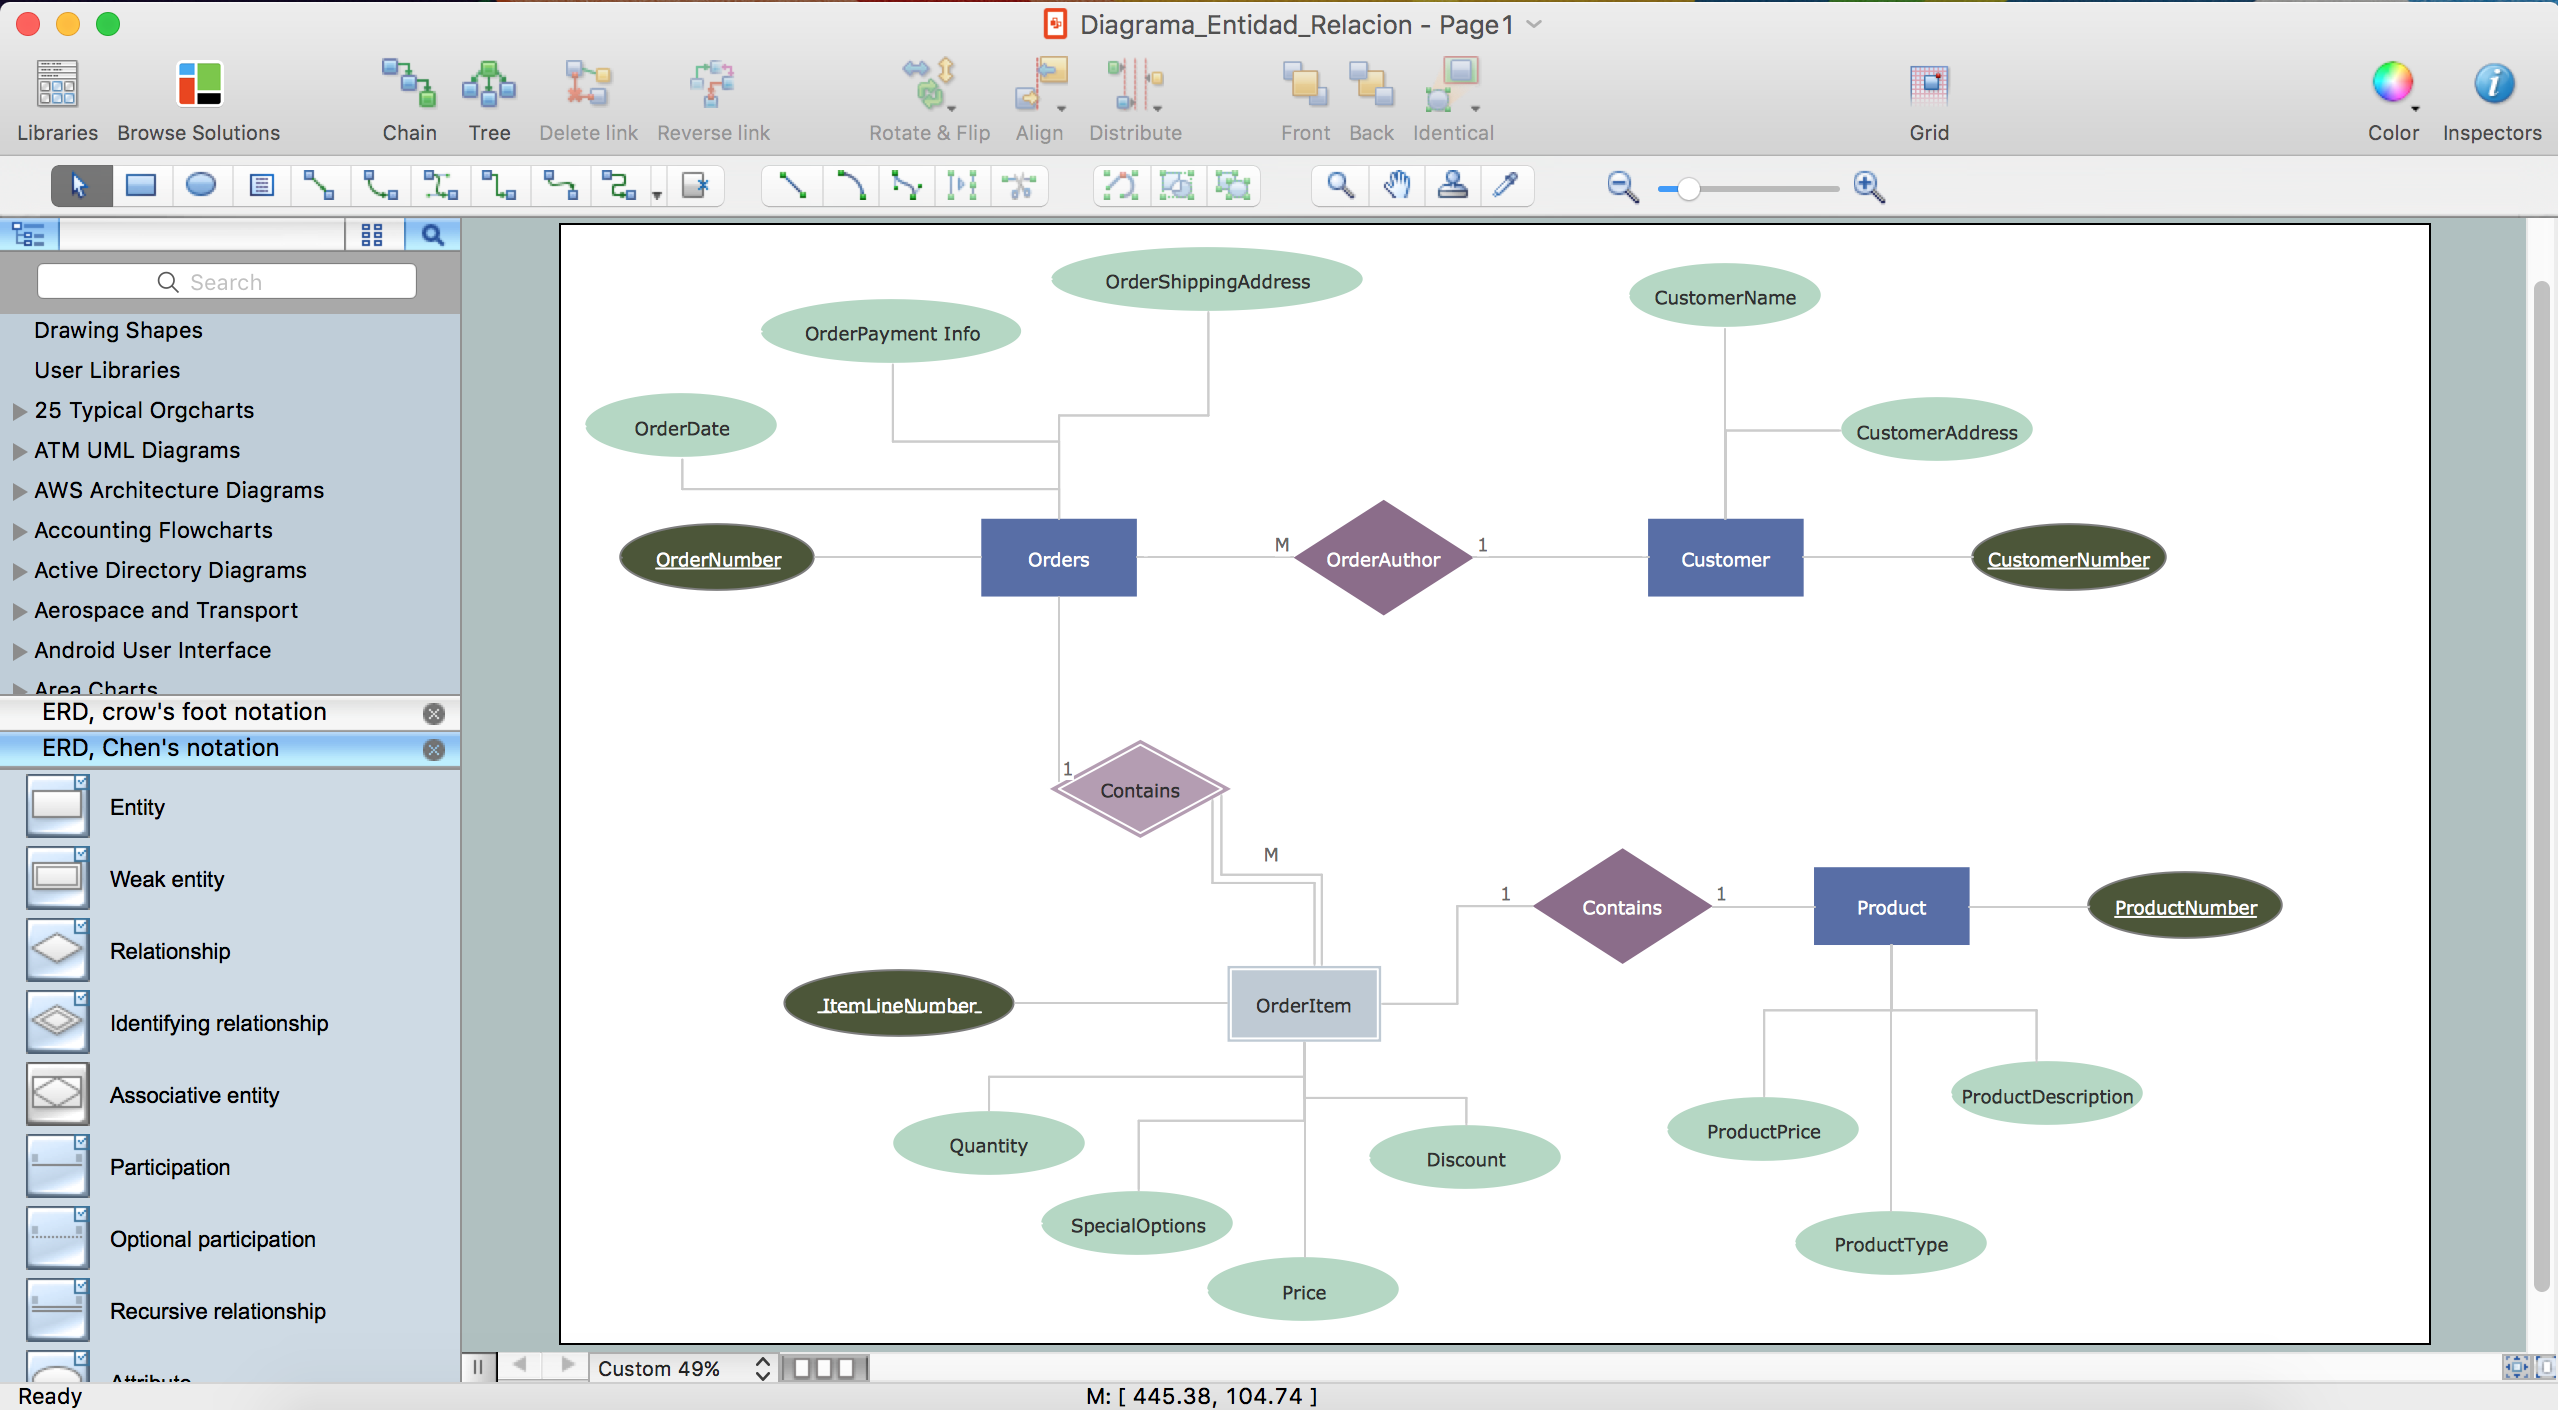
ER diagram is the most popular database design tool which lets create graphical representations of database tables, their columns and also relationships. As for the Mac users, they are very interested in powerful database diagramming tools and ER diagram tool for OS X to design professional looking E-R Diagrams and ERD drawings. ConceptDraw PRO software on Mac OS X gives the ability to easy draw ERDs.
 Entity-Relationship Diagram (ERD)
Entity-Relationship Diagram (ERD) solution extends ConceptDraw PRO software with templates, samples and libraries of vector stencils from drawing the ER-diagrams by Chen's and crow’s foot notations.
"Chen's notation for entity–relationship modeling uses rectangles to represent entity sets, and diamonds to represent relationships appropriate for first-class objects: they can have attributes and relationships of their own. If an entity set participates in a relationship set, they are connected with a line.
Attributes are drawn as ovals and are connected with a line to exactly one entity or relationship set.
Cardinality constraints are expressed as follows:
- a double line indicates a participation constraint, totality or surjectivity: all entities in the entity set must participate in at least one relationship in the relationship set;
- an arrow from entity set to relationship set indicates a key constraint, i.e. injectivity: each entity of the entity set can participate in at most one relationship in the relationship set;
- a thick line indicates both, i.e. bijectivity: each entity in the entity set is involved in exactly one relationship.
- an underlined name of an attribute indicates that it is a key: two different entities or relationships with this attribute always have different values for this attribute.
Attributes are often omitted as they can clutter up a diagram; other diagram techniques often list entity attributes within the rectangles drawn for entity sets." [Entity–relationship model. Wikipedia]
The vector stencils library ERD, Chen's notation contains 13 symbols for drawing entity-relatinship diagrams using the ConceptDraw PRO diagramming and vector drawing software.
The example "Design elements - ER diagram (Chen notation)" is included in the Entity-Relationship Diagram (ERD) solution from the Software Development area of ConceptDraw Solution Park.
HelpDesk
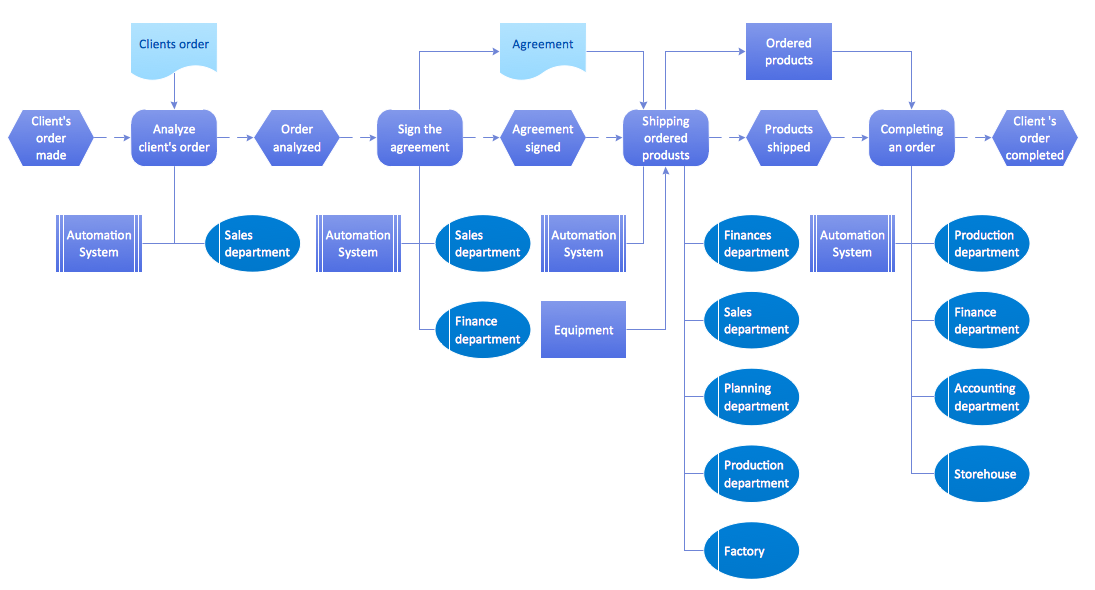
Event-driven Process Chain (EPC) Diagram Software
An EPC diagram is a type of flowchart used in business process analysis. It shows different business processes through various work flows. The workflows are shown as processes and events that are related to different executes and tasks that allow business workflow to be completed.An EPC diagram shows different business processes through various workflows. The workflows are seen as functions and events that are connected by different teams or people, as well as tasks that allow business processes to be executed. The best thing about this type of enterprise modelling is that creating an EPC diagram is quick and simple as long as you have the proper tool. One of the main usages of the EPC diagrams is in the modelling, analyzing and re-engineering of business processes. With the use of the flowchart, businesses are able to see inefficiencies in the processes and modify to make them more productive. Event-driven process chain diagrams are also used to configure an enterprise resource pla
EPC Diagram
ConceptDraw PRO diagramming and vector drawing software offers the Event-driven Process Chain Diagrams EPC Solution from the Business Processes Area of ConceptDraw Solution Park with powerful drawing tools to help you draw the EPC diagram of any complexity quick and easy.- Entity Relationship Diagram Software for Mac | ER diagram tool for ...
- Er Diagram For Event Management
- Entity-Relationship Diagram (ERD) | Er Diagramm Exerc
- Design elements - ERD (crow's foot notation) | Entity Relationship ...
- Best Mind Mapping Program for Making Presentations | Process ...
- Design elements - ER diagram
- Design elements - ER diagram (Chen notation) | Entity-Relationship ...
- Design elements - ER diagram (Chen notation) | Entity Relationship ...
- Epc Diagram
- Er Diagram Example With Solutions
- Data Flow Diagram
- Basic Flowchart Symbols and Meaning | Flowchart design ...
- Campus Area Networks (CAN). Computer and Network Examples ...
- Network Diagram Ppt Examples
- Value stream mapping - Vector stencils library | Value stream ...
- UML component diagram - Start server | Server hardware - Rack ...
- UML Use Case Diagram Example Social Networking Sites Project ...
- Server hardware - Rack diagram | UML component diagram - Start ...
- Fire safety equipment - Vector stencils library | Watercraft - Vector ...

.png--diagram-flowchart-example.png)

