Technical Flow Chart Example
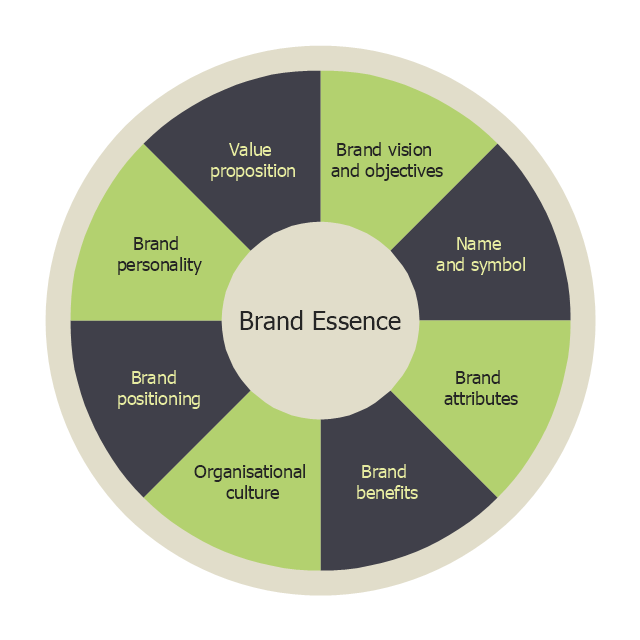
What illustrates a technical flow chart? Technical flow chart is a diagrammatic representation which visually illustrates the sequence of operations that must to be performed to get the problem's solution. ConceptDraw DIAGRAM enhanced with Flowcharts Solution from the "Diagrams" Area of ConceptDraw Solution is a perfect software for drawing Technical Flow Chart Example illustrating the essence and importance of the technical flow chart use."Brand essence is a phrase that communicates the fundamental nature of a trade name associated with one or more products made by the same company. A business marketing team will often spend considerable time developing effective ways of expressing the brand essence of their company's various brands by highlighting the unique benefits provided that pertain to the values of its target subculture." [businessdictionary.com/ definition/ brand-essence.html]
Brand essence model diagram visually display key points of brand essence in easy to understand form.
The example of wheel diagram (ring diagram, bevel style circle diagram) "Brand essence model" was created using the ConceptDraw PRO diagramming and vector drawing software extended with the Target and Circular Diagrams solution from the Marketing area of ConceptDraw Solution Park.
www.conceptdraw.com/ solution-park/ marketing-target-and-circular-diagrams
Venn Diagram Examples for Problem Solving. Computer Science. Chomsky Hierarchy
A Venn diagram, sometimes referred to as a set diagram, is a diagramming style used to show all the possible logical relations between a finite amount of sets. In mathematical terms, a set is a collection of distinct objects gathered together into a group, which can then itself be termed as a single object. Venn diagrams represent these objects on a page as circles or ellipses, and their placement in relation to each other describes the relationships between them. The Venn diagram example below visualizes the the class of language inclusions described by the Chomsky hierarchy.
 Target and Circular Diagrams
This solution extends ConceptDraw DIAGRAM software with samples, templates and library of design elements for drawing the Target and Circular Diagrams.
Pyramid Chart Examples
Pyramid Charts and Triangle Diagrams are used to visually structure the topics and progressively order the quantitative data. They allow to illustrate hierarchical structure of the topics, proportional, interconnected and containment relations among the topics. The multilevel Pyramids and Triangle diagrams are constructed oriented up or down and divided into several horizontal slices. They are effectively used to represent marketing strategies, social strategies, information systems, market value, etc., to illustrate presentations, websites, documents, reports in business, finances, sales, management, marketing, media, training, consulting, and many other fields. To maximize the efficiency in drawing the Pyramid Charts, use the ConceptDraw DIAGRAM diagramming and vector drawing software extended with Pyramid Diagrams solution from Marketing area, which contains the set of Pyramid Chart examples, samples, templates and vector design elements of triangular diagrams and pyramids with different quantity of levels for various needs.Pyramid Diagram and Pyramid Chart
Pyramid Diagram, Triangle Chart or Triangular Diagram is a convenient and useful type of diagrams, which lets represent the data hierarchical structure and to illustrate the foundation-based relationships between the hierarchy levels. Pyramid Diagrams are used to visualize effectively the hierarchical, as well as proportional and foundation-based relationships, the process steps, the interconnections of organizational layers or topics. ConceptDraw DIAGRAM software enhanced with Pyramid Diagrams solution from Marketing area of ConceptDraw Solution Park is a powerful business charting software, that includes all required tools for designing the multilevel Pyramid Diagrams as quickly as possible. The build-in vector stencils and templates are the great aid for designers, a variety of examples and samples is a good base and source of inspiration. Use attractive and vivid 2D and 3D Pyramid Diagrams and Triangle Charts designed in ConceptDraw DIAGRAM to illustrate your documents, presentations, infographics, articles, reports, websites, etc.Pyramid Charts
ConceptDraw DIAGRAM extended with Pyramid Diagrams Solution from the Marketing Area of ConceptDraw Solution Park is a powerful Pyramid Charts making software. A Pyramid Chart has the form of triangle and hierarchically structures, organizes and help to analyze the information, data or ideas. Triangle is divided on the sections that usually have different widths. The width indicates the level of hierarchy among the topics.Software development with ConceptDraw DIAGRAM
Modern software development requires creation of large amount of graphic documentation, these are the diagrams describing the work of applications in various notations and cuts, also GUI design and documentation on project management. ConceptDraw DIAGRAM technical and business graphics application possesses powerful tools for software development and designing technical documentation for object-oriented projects. Solutions included to the Software Development area of ConceptDraw Solution Park provide the specialists with possibility easily and quickly create graphic documentation. They deliver effective help in drawing thanks to the included package of templates, samples, examples, and libraries with numerous ready-to-use vector objects that allow easily design class hierarchies, object hierarchies, visual object-oriented designs, flowcharts, GUI designs, database designs, visualize the data with use of the most popular notations, including the UML and Booch notations, easy manage the development projects, automate projection and development."Fault-tolerant computer systems are systems designed around the concepts of fault tolerance. In essence, they have to be able to keep working to a level of satisfaction in the presence of faults. ...
Most fault-tolerant computer systems are designed to be able to handle several possible failures, including hardware-related faults such as hard disk failures, input or output device failures, or other temporary or permanent failures; software bugs and errors; interface errors between the hardware and software, including driver failures; operator errors, such as erroneous keystrokes, bad command sequences, or installing unexpected software; and physical damage or other flaws introduced to the system from an outside source." [Fault-tolerant computer system. Wikipedia]
The computer network diagram example "Cisco LAN fault-tolerance system" was created using the ConceptDraw PRO diagramming and vector drawing software extended with the Cisco Network Diagrams solution from the Computer and Networks area of ConceptDraw Solution Park.
Used Solutions
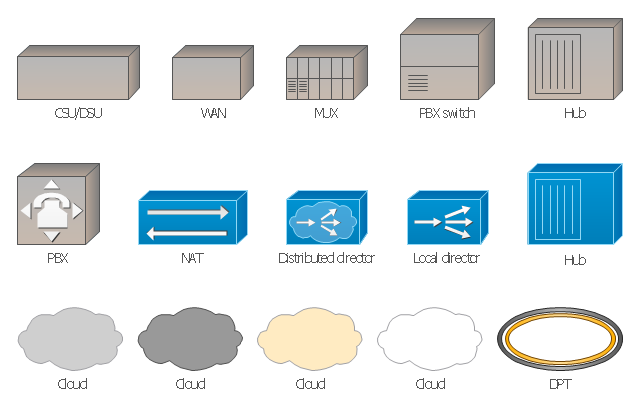
The vector stencils library "Cisco WAN" contains 15 symbols of wide area network (WAN) devices and equipment: CSU/ DSU (Channel Service Unit/ Data Service Unit), WAN, MUX (multiplexer), PBX switch, Hub, NAT (network address translation), distributed and local directors, PBX (private branch exchange), Network clouds, DPT (dynamic packet transport).
Create the computer network topology diagrams using the ConceptDraw PRO diagramming and vector drawing software with the design elements library "Cisco WAN".
"A wide area network (WAN) is a network that covers a broad area (i.e., any telecommunications network that links across metropolitan, regional, or national boundaries) using private or public network transports. Business and government entities utilize WANs to relay data among employees, clients, buyers, and suppliers from various geographical locations. In essence, this mode of telecommunication allows a business to effectively carry out its daily function regardless of location. The Internet can be considered a WAN as well, and is used by businesses, governments, organizations, and individuals for almost any purpose imaginable.
Related terms for other types of networks are personal area networks (PANs), local area networks (LANs), campus area networks (CANs), or metropolitan area networks (MANs) which are usually limited to a room, building, campus or specific metropolitan area (e.g., a city) respectively." [Wide area network. Wikipedia]
The example "Design elements - Cisco WAN" is included in the Cisco Network Diagrams solution from the Computer and Networks area of ConceptDraw Solution Park.
- Brand essence model - Wheel diagram | Target and Circular ...
- Pyramid Chart Examples | Brand essence model - Wheel diagram ...
- Top brand model - Pyramid diagram | Brand essence model - Wheel ...
- How to Create a Pie Chart | How to Create a Column Chart ...
- Brand essence model - Wheel diagram | Marketing mix - Wheel ...
- Diagramming Software for Design UML Activity Diagrams | 3 Circle ...
- Pie Donut Chart. Pie Chart Examples
- Pie Donut Chart. Pie Chart Examples | Pie Chart Software | Donut ...
- Pie Donut Chart. Pie Chart Examples
- Value pyramid - Marketing diagram | Pyramid Diagrams | Social ...
- Doughnut chart template | Pie Chart Software | Arrow pie chart ...
- Target market - Onion diagram | Circle-spoke diagram - Target ...
- Ring chart template | How to Create a Pie Chart | Arrow circle chart ...
- Pie Chart Software | Content marketing cycle - Diamond pie chart ...
- Ring Charts
- Marketing | Marketing Diagrams | Forces shaping the broadband ...
- Target and Circular Diagrams | Target market - Onion diagram ...
- Network Diagram Examples | Physical LAN and WAN diagram ...
- Circular Arrows Diagrams | Target and Circular Diagrams | How to ...
- ER Diagram Styles | How to Create an AWS Architecture Diagram ...


