 Event-driven Process Chain Diagrams
Event-driven Process Chain (EPC) Diagram is a type of flowchart widely used for modeling in business engineering and reengineering, business process improvement, and analysis. EPC method was developed within the Architecture of Integrated Information Systems (ARIS) framework.
HelpDesk
How to Create a BPMN Diagram Using ConceptDraw PRO

Business process Flow Chart — Event-Driven Process chain (EPC) diagrams
 diagram, Process flow diagram tool")
This vector stencils library contains 47 SysML activity diagram symbols.
Use it to design your SysML activity diagrams using ConceptDraw PRO diagramming and vector drawing software.
"Activity diagrams are constructed from a limited number of shapes, connected with arrows. The most important shape types:
- rounded rectangles represent actions;
- diamonds represent decisions;
- bars represent the start (split) or end (join) of concurrent activities;
- a black circle represents the start (initial state) of the workflow;
- an encircled black circle represents the end (final state).
Arrows run from the start towards the end and represent the order in which activities happen." [Activity diagram. Wikipedia]
The vector stencils library "Activity diagram" is included in the SysML solution from the Software Development area of ConceptDraw Solution Park.
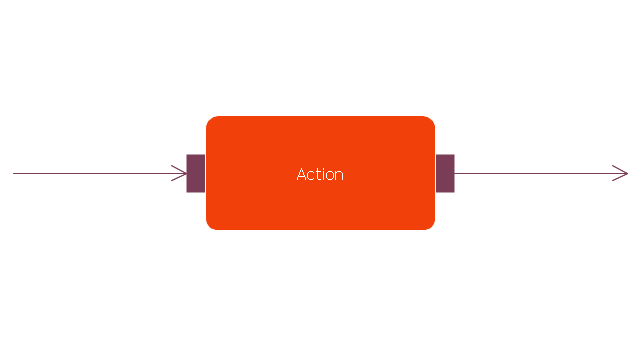
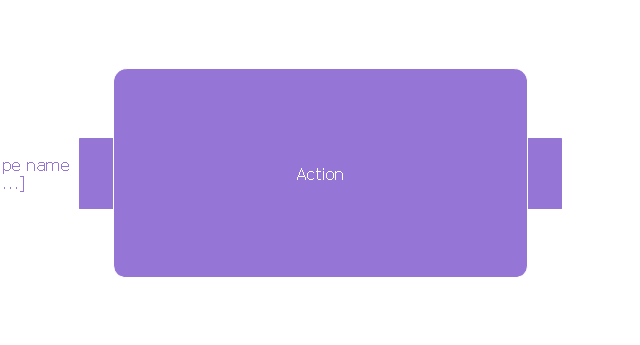
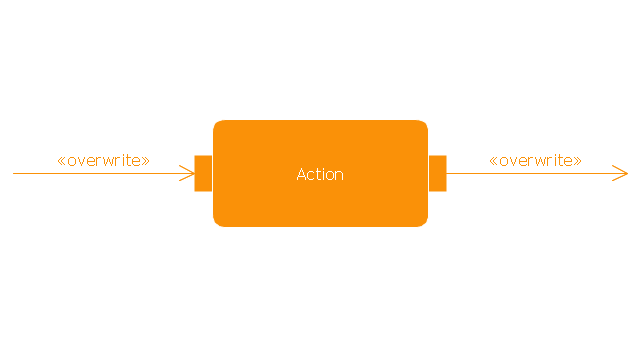
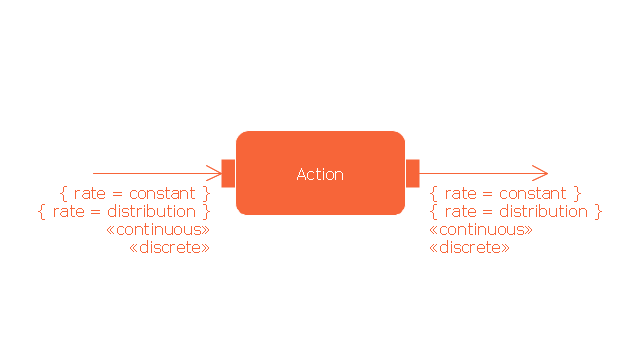
Action
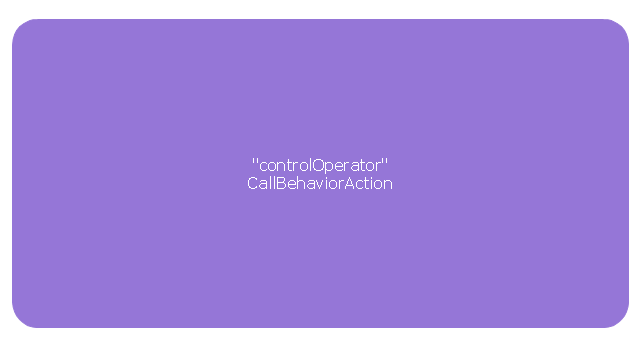
Call behavior action
Accept event action

Accept time event action

Send signal action
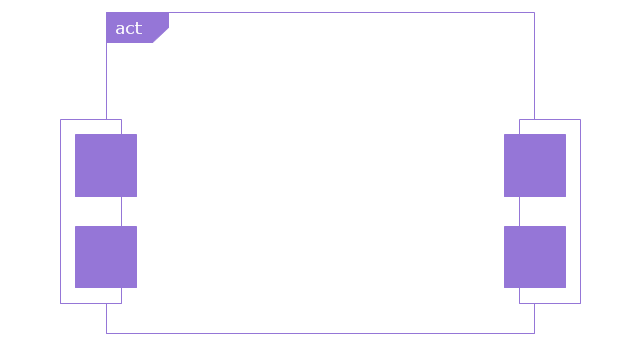
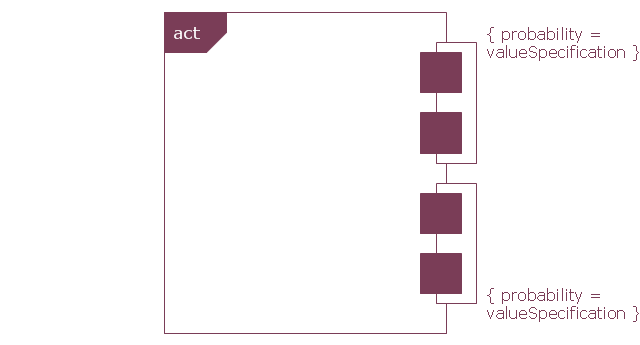
Activity
Activity final node

Flow final node
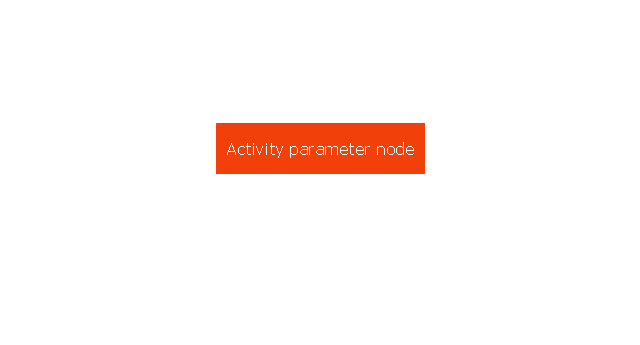
Activity parameter node
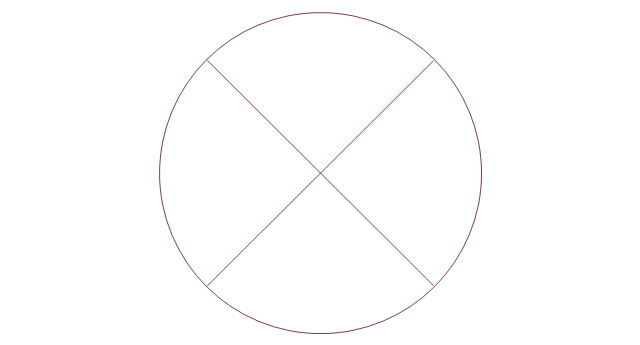
Control operator node
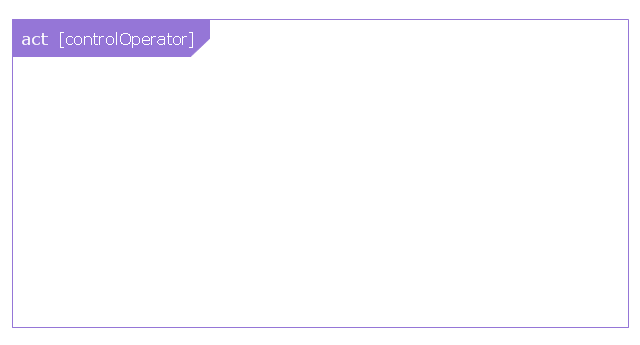
Control operator - frame
Decision/Merge node

Fork/Join node

Initial node

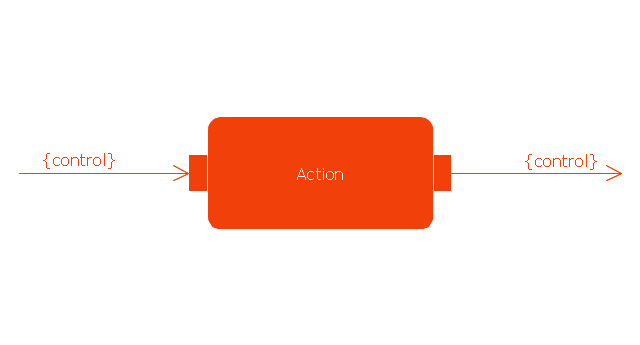
isControl
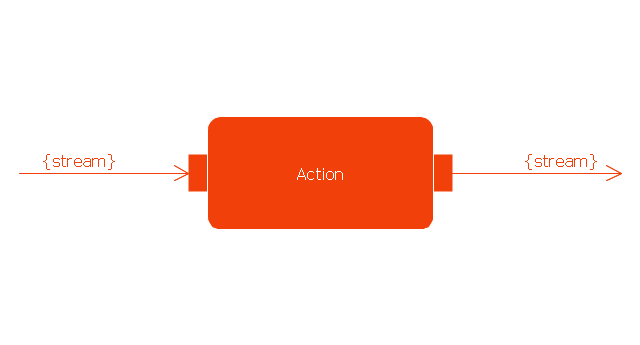
isStream
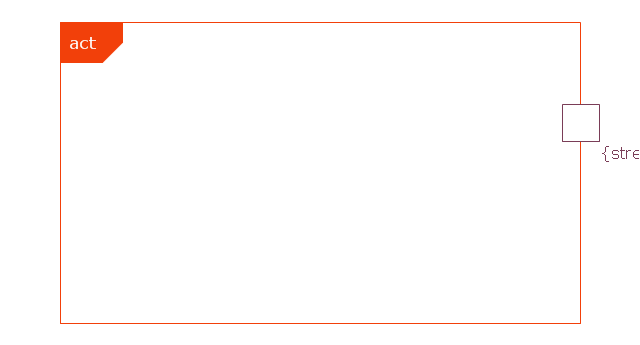
isStream 2
isStream 3
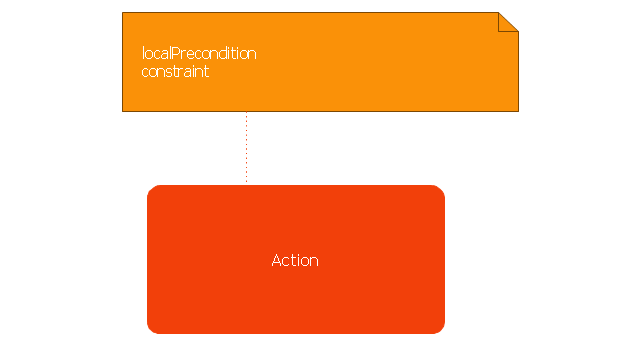
Local precondition
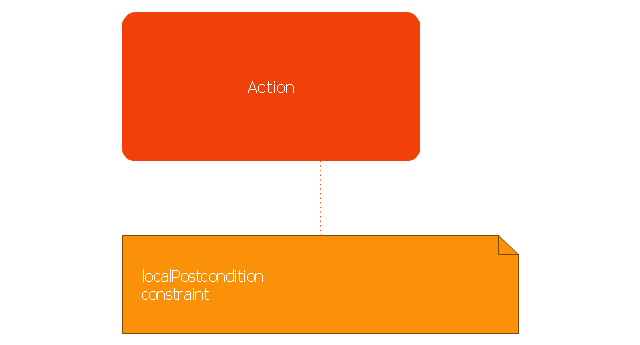
Local postcondition
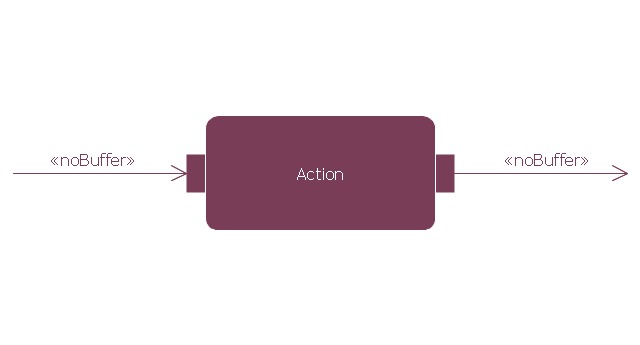
NoBuffer
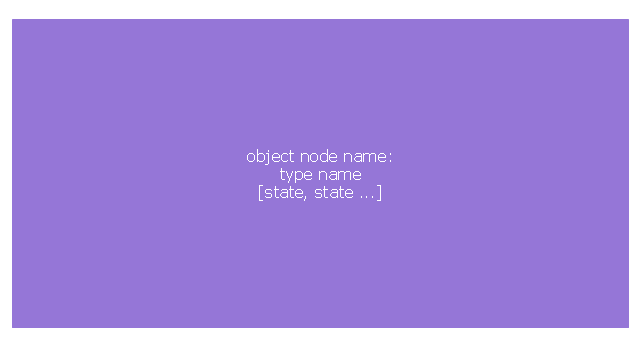
Object node
Object node 2
Optional
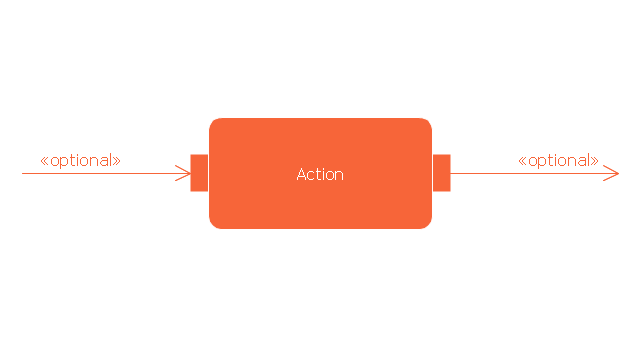
Optional 2
OverWrite
Parameter set
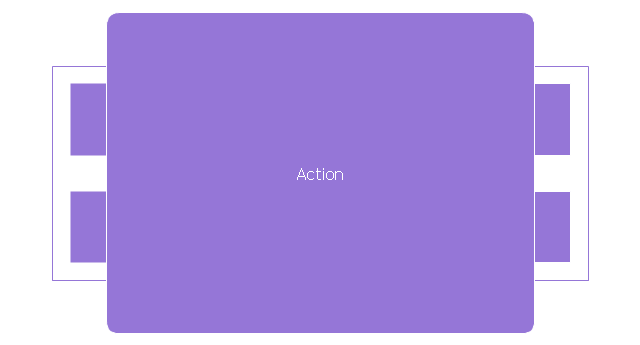
Parameter set 2
Probability
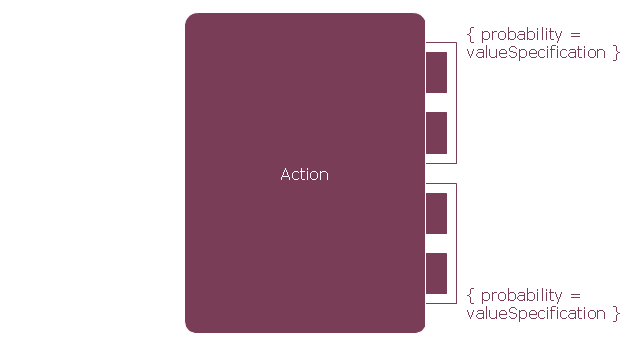
Probability 2
Rate
Rate 2
Rate 3
Rate 4
Rate 5
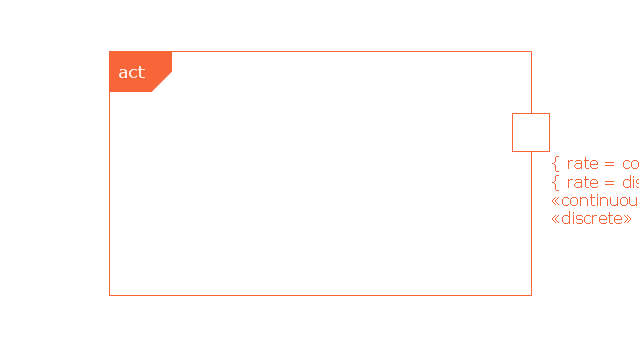
Rate 6
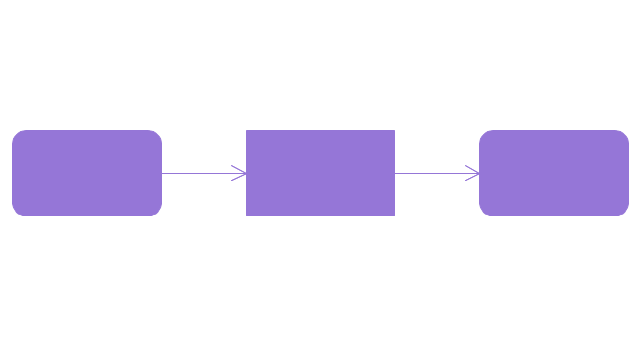
Control flow
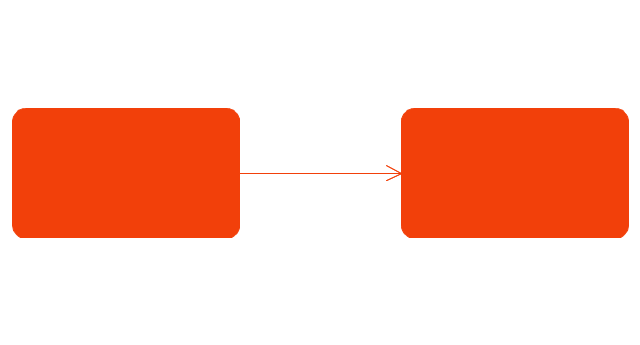
Control flow 2
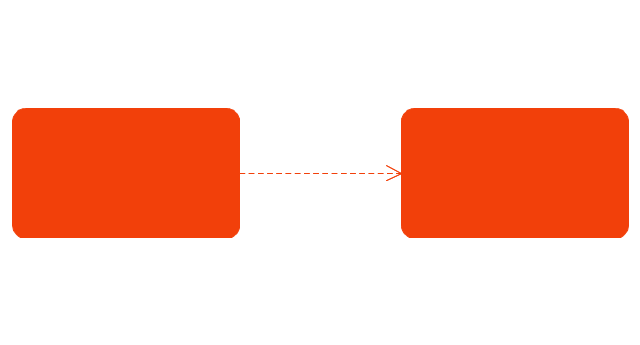
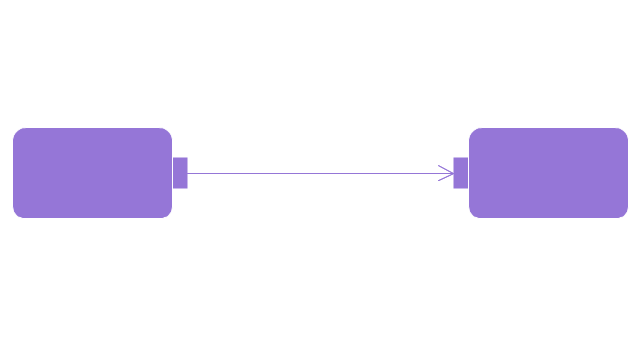
Object flow
Object flow 2
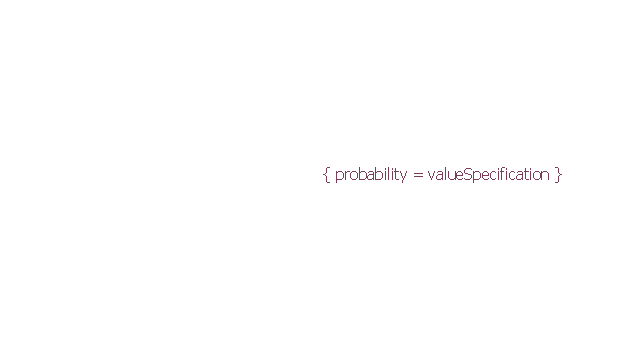
Probability path
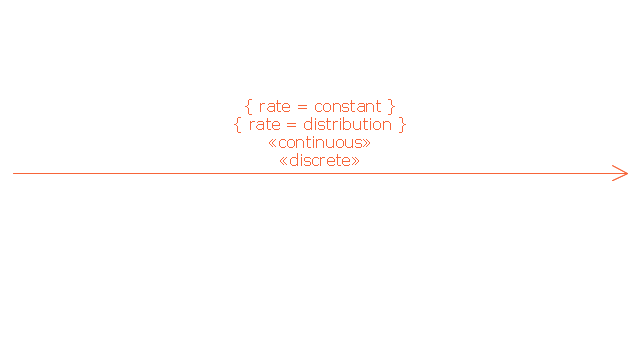
Rate path
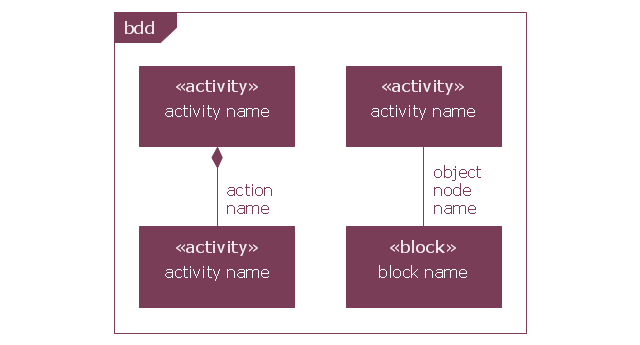
In block definition diagram, activity, association
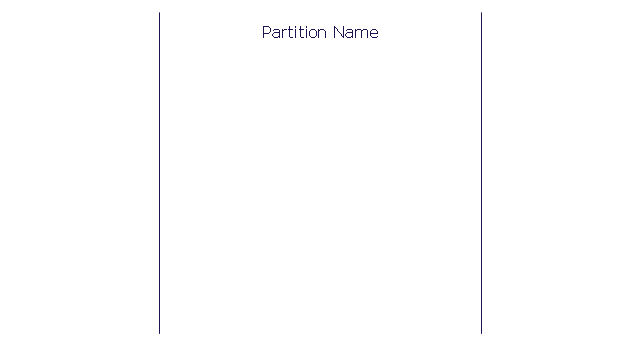
Activity partition
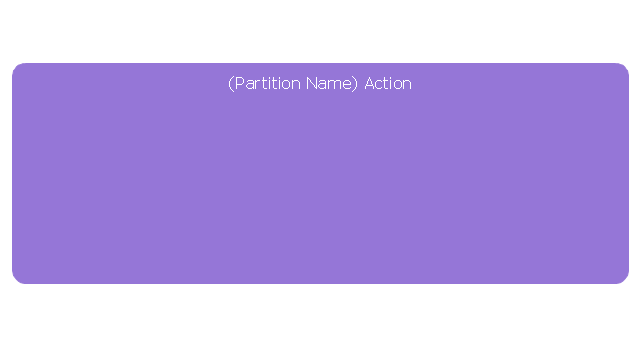
Activity partition - action
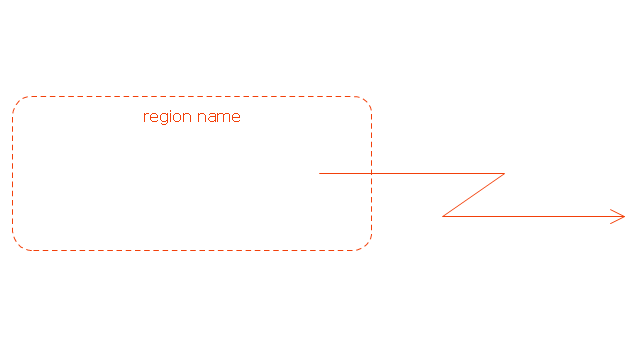
Interruptible activity region
Structured activity node
UML Activity Diagram. Design Elements
")

This vector stencils library contains 47 SysML activity diagram symbols.
Use it to design your SysML activity diagrams using ConceptDraw PRO diagramming and vector drawing software.
"Activity diagrams are constructed from a limited number of shapes, connected with arrows. The most important shape types:
- rounded rectangles represent actions;
- diamonds represent decisions;
- bars represent the start (split) or end (join) of concurrent activities;
- a black circle represents the start (initial state) of the workflow;
- an encircled black circle represents the end (final state).
Arrows run from the start towards the end and represent the order in which activities happen." [Activity diagram. Wikipedia]
The vector stencils library "Activity diagram" is included in the SysML solution from the Software Development area of ConceptDraw Solution Park.
Use it to design your SysML activity diagrams using ConceptDraw PRO diagramming and vector drawing software.
"Activity diagrams are constructed from a limited number of shapes, connected with arrows. The most important shape types:
- rounded rectangles represent actions;
- diamonds represent decisions;
- bars represent the start (split) or end (join) of concurrent activities;
- a black circle represents the start (initial state) of the workflow;
- an encircled black circle represents the end (final state).
Arrows run from the start towards the end and represent the order in which activities happen." [Activity diagram. Wikipedia]
The vector stencils library "Activity diagram" is included in the SysML solution from the Software Development area of ConceptDraw Solution Park.
Action
Call behavior action
Accept event action
Accept time event action
Send signal action
Activity
Activity final node
Flow final node
Activity parameter node
Control operator node
Control operator - frame
Decision/Merge node
Fork/Join node
Initial node
isControl
isStream
isStream 2
isStream 3
Local precondition
Local postcondition
NoBuffer
Object node
Object node 2
Optional
Optional 2
OverWrite
Parameter set
Parameter set 2
Probability
Probability 2
Rate
Rate 2
Rate 3
Rate 4
Rate 5
Rate 6
Control flow
Control flow 2
Object flow
Object flow 2
Probability path
Rate path
In block definition diagram, activity, association
Activity partition
Activity partition - action
Interruptible activity region
Structured activity node
EPC (Event-driven Process Chain) Flowcharts

Process Modelling using Event-driven Process chain

Process Flowchart


HelpDesk
How to Create a Timeline Diagram in ConceptDraw PRO

- ATM UML Diagrams | Event -driven Process Chain Diagrams | ATM ...
- UML Activity Diagram . Design Elements | Event -driven Process ...
- Design elements - UML activity diagrams | Vector stencils library ...
- Event Action Plan Sample
- UML activity diagram - User registration | Event -driven Process ...
- Purchase order processing UML activity diagram | Event -driven ...
- UML Activity Diagram . Design Elements | Vector stencils library ...
- Design elements - Activity diagram | Vector stencils library - Activity ...
- Design elements - UML activity diagrams | Design elements - Bank ...
- Vector stencils library - Activity diagram