 Seven Management and Planning Tools
Seven Management and Planning Tools solution extends ConceptDraw PRO and ConceptDraw MINDMAP with features, templates, samples and libraries of vector stencils for drawing management mind maps and diagrams.
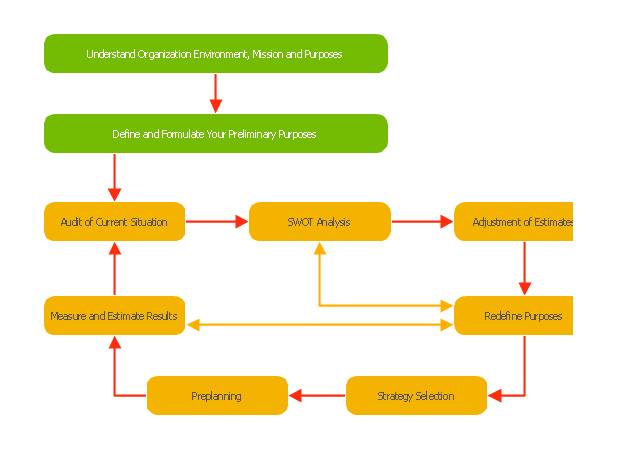
Example of Flowchart Diagram

"Planning (also called forethought) is the process of thinking about and organizing the activities required to achieve a desired goal.
Planning involves the creation and maintenance of a plan. As such, planning is a fundamental property of intelligent behavior. This thought process is essential to the creation and refinement of a plan, or integration of it with other plans; that is, it combines forecasting of developments with the preparation of scenarios of how to react to them.
An important, albeit often ignored aspect of planning, is the relationship it holds with forecasting. Forecasting can be described as predicting what the future will look like, whereas planning predicts what the future should look like. The counterpart to planning is spontaneous order." [Planning. Wikipedia]
The block diagram example "Planning process" was created using the ConceptDraw PRO diagramming and vector drawing software extended with the Block Diagrams solution from the area "What is a Diagram" of ConceptDraw Solution Park.
Block diagram
Bubble diagrams in Landscape Design with ConceptDraw PRO

 Event-driven Process Chain Diagrams
Event-driven Process Chain (EPC) Diagram is a type of flowchart widely used for modeling in business engineering and reengineering, business process improvement, and analysis. EPC method was developed within the Architecture of Integrated Information Systems (ARIS) framework.
Fishbone Diagram Example

Modelling Complex Events with Event-Driven Process chain

TQM Diagram Example

Affinity Diagram Software

Flowchart Process Example

This arrow loop diagram sample was created on the base of the figure illustrating the webpage "Safe Roads for a Safer Future A Joint Safety Strategic Plan" from the website of US Department of Transportation - Federal Highway Administration (FHWA) Office of Safety.
"STRATEGIC PLANNING CYCLE.
After the safety units issue the SSP, they will identify and prioritize strategies to support the established goals. Many strategies will originate in existing roadmaps or in other program planning activities. The safety units will also use this information when developing their Unit Performance Plans and individual performance plans. Teams within each safety unit will carry out projects and activities to support identified strategies and achieve the SSP goals.
The SSP process also includes continuous performance monitoring and evaluation through which the safety units will review past accomplishments against the established goals, consider how well strategies are implemented, assess progress toward goals, identify risks, consider changes in the environment, and discuss future strategic direction. As a part of the evaluation process, the three safety units will recognize achievements and discuss the need for adjustments. Figure ... shows the strategic planning cycle.
The safety units will update the SSP every 3 to 5 years using input from a variety of sources, including evaluations, safety trends, and legislative changes." [safety.fhwa.dot.gov/ ssp/ ]
The arrow loop diagram example "Strategic planning cycle" was created using the ConceptDraw PRO diagramming and vector drawing software extended with the Target and Circular Diagrams solution from the Marketing area of ConceptDraw Solution Park.
www.conceptdraw.com/ solution-park/ marketing-target-and-circular-diagrams
Arrow loop diagram
Example of DFD for Online Store (Data Flow Diagram) DFD Example


 Target and Circular Diagrams
This solution extends ConceptDraw PRO software with samples, templates and library of design elements for drawing the Target and Circular Diagrams.
 Entity-Relationship Diagram (ERD)
Entity-Relationship Diagram (ERD) solution extends ConceptDraw PRO software with templates, samples and libraries of vector stencils from drawing the ER-diagrams by Chen's and crow’s foot notations.
UML Class Diagram Example for Transport System

ConceptDraw PRO Network Diagram Tool


How To Create Restaurant Floor Plan in Minutes


 Fishbone Diagram
Fishbone Diagrams solution extends ConceptDraw PRO software with templates, samples and library of vector stencils for drawing the Ishikawa diagrams for cause and effect analysis.
- Seven Management and Planning Tools | TQM Diagram Example ...
- TQM Diagram Example | Seven Management and Planning Tools ...
- Flowchart Process Example | Example of Flowchart Diagram | Flow ...
- TQM Diagram Example
- Total Quality Management TQM Diagrams | TQM Diagram Example ...
- Block diagram - Personal planning process | Seven Management ...
- UML Class Diagram Example - Apartment Plan | Program ...
- Event-driven Process Chain Diagrams EPC | Seven Management ...
- Project planning diagram | Business Diagram Software ...
- Gantt chart examples | Flow Chart Diagram Examples | Gantt charts
- Seven Management and Planning Tools | Flowchart Process ...
- Gant Chart in Project Management | Gantt charts for planning and ...
- UML Collaboration Diagram Example Illustration | Beauty in nature ...
- Flowchart Process Example | Event-driven Process Chain Diagrams ...
- Block diagram - Personal planning process | Evernote exchange ...
- Marketing Analysis Diagram | Flowchart Example : Flow Chart of ...
- Types of Flowchart - Overview | TQM Diagram Example | Flowchart ...
- Flowchart - Project planning process | Project planning diagram |
- Seven Management and Planning Tools | TQM Diagram ...
- Seven Management and Planning Tools | Root cause analysis tree ...