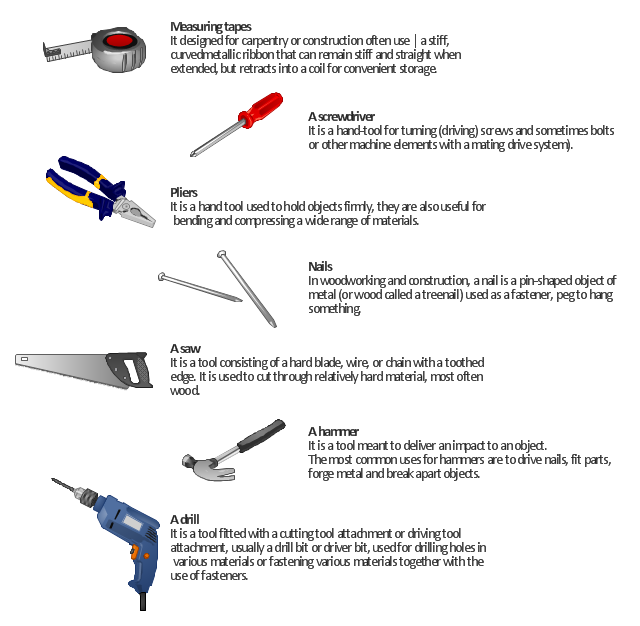
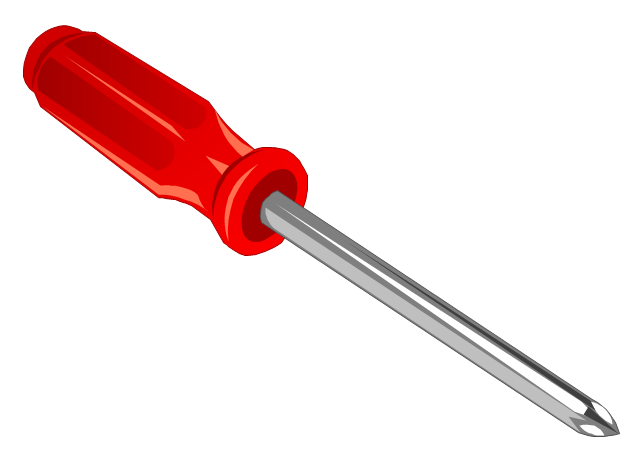
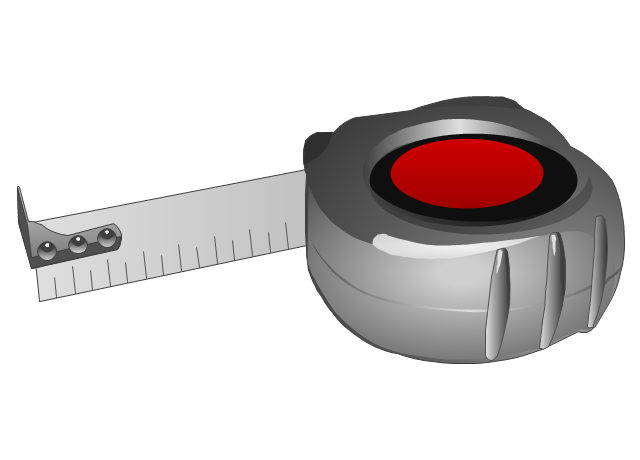
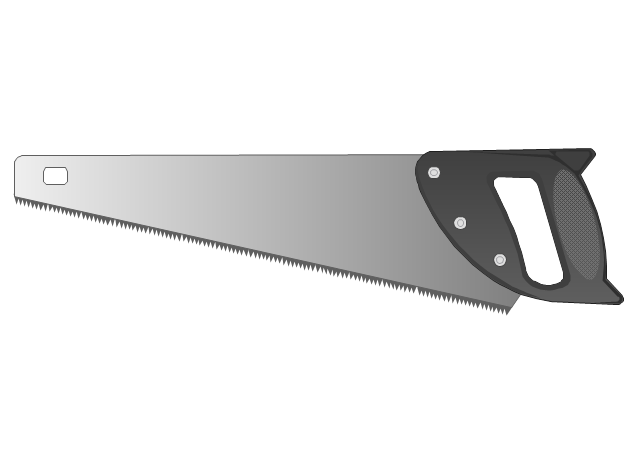
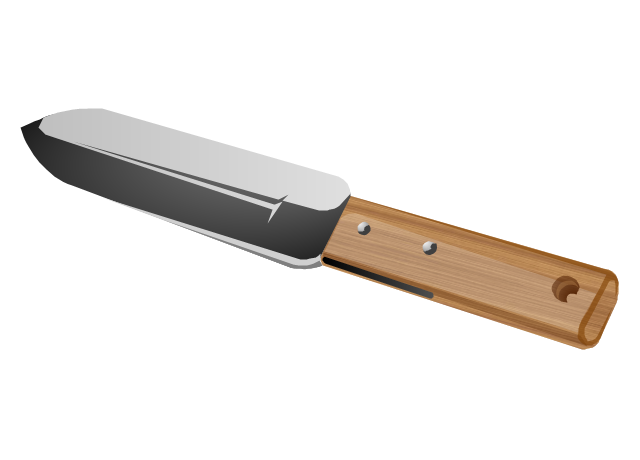
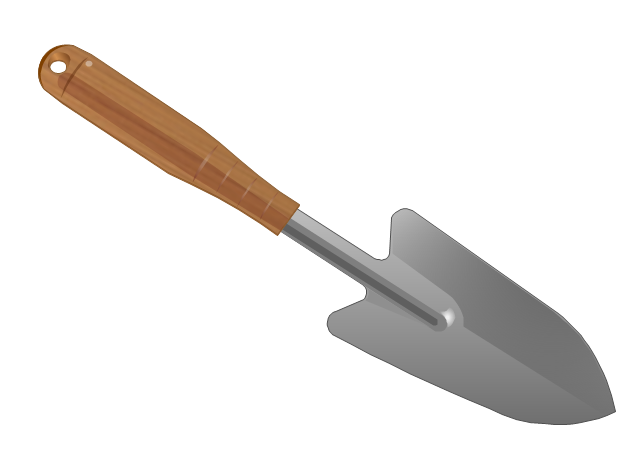
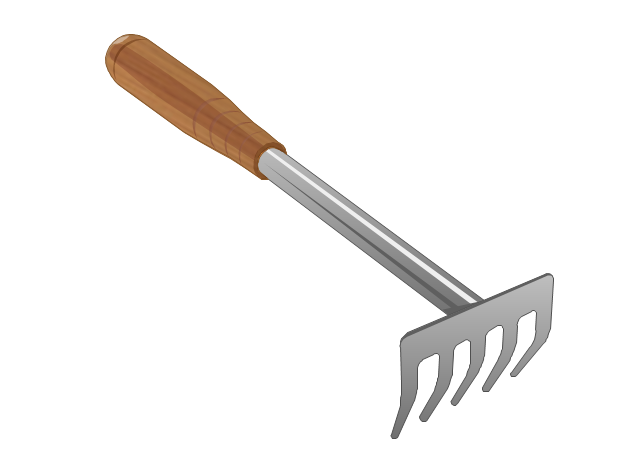
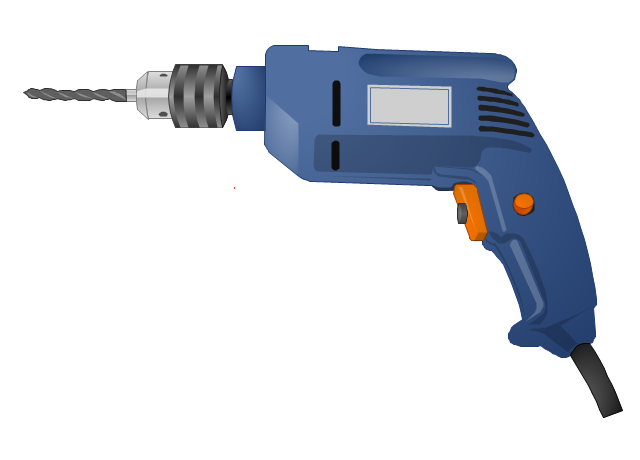
"A hand tool is any tool that is not a power tool – that is, one powered by hand (manual labour) rather than by an engine. Some examples of hand tools are hammers, spanners, pliers, screwdrivers and chisels. Hand tools are generally less dangerous than power tools." [Hand tool. Wikipedia]
"A power tool is a tool that is actuated by an additional power source and mechanism other than the solely manual labour used with hand tools. The most common types of power tools use electric motors. ...
Power tools are used in industry, in construction, in the garden, for housework tasks such as cooking, cleaning, and around the house for purposes of driving (fasteners), drilling, cutting, shaping, sanding, grinding, routing, polishing, painting, heating and more.
Power tools are classified as either stationary or portable, where portable means hand-held. Portable power tools have obvious advantages in mobility." [Power tool. Wikipedia]
The illustration example "7 tools that should be in every home" was created in the ConceptDraw PRO diagramming and vector drawing software using the Manufacturing and Maintenance solution from the Illustration area of ConceptDraw Solution Park.
Online Diagram Tool
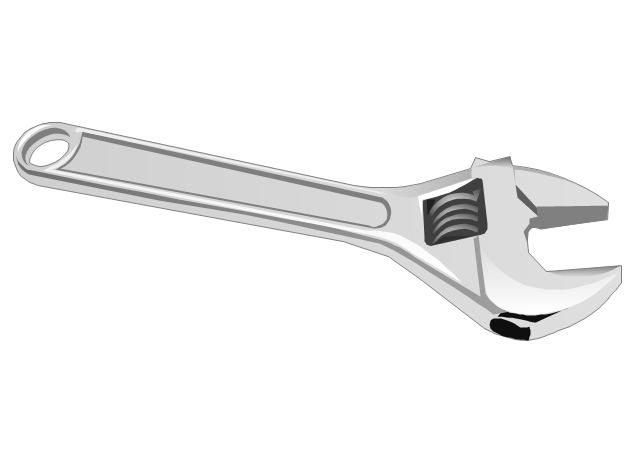
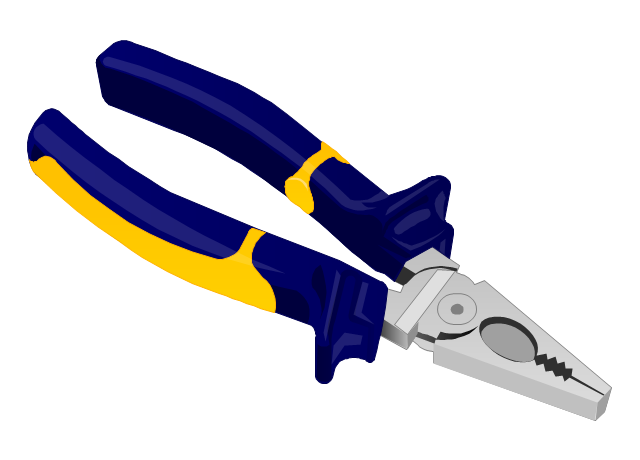
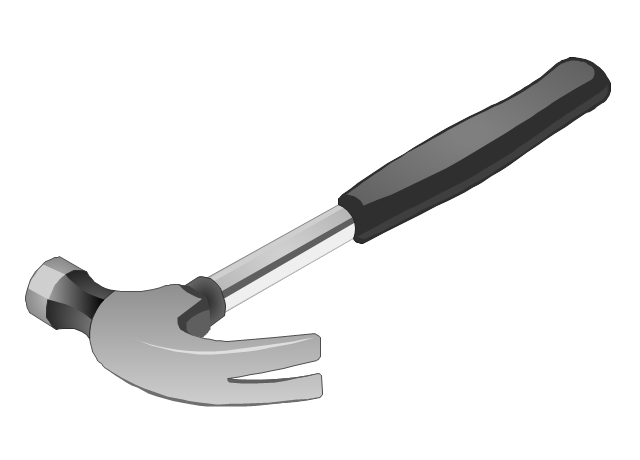
ConceptDraw PRO diagramming and vector drawing software extended with Rapid UML Solution from the Software Development Area is a powerful online diagram tool that will help you design any types of UML diagrams simply and fast.The vector stencils library "Tools" contains 11 clipart images of hand tools and instruments for drawing illustrations.
"A tool is any physical item that can be used to achieve a goal, especially if the item is not consumed in the process. Informally the word is also used to describe a procedure or process with a specific purpose. Tool use by humans dates back millions of years, and other animals are also known to employ simple tools.
Tools that are used in particular fields or activities may have different designations such as "instrument", "utensil", "implement", "machine", or "apparatus". The set of tools needed to achieve a goal is "equipment". The knowledge of constructing, obtaining and using tools is technology." [Tool. Wikipedia]
The clip art example "Tools - Vector stencils library" was created in ConceptDraw PRO diagramming and vector drawing software using the Manufacturing and Maintenance solution from the Illustration area of ConceptDraw Solution Park.
Process Flowchart
The main reason of using Process Flowchart or PFD is to show relations between major parts of the system. Process Flowcharts are used in process engineering and chemical industry where there is a requirement of depicting relationships between major components only and not include minor parts. Process Flowcharts for single unit or multiple units differ in their structure and implementation. ConceptDraw PRO is Professional business process mapping software for making Process flowcharts, Process flow diagram, Workflow diagram, flowcharts and technical illustrations for business documents and also comprehensive visio for mac application. Easier define and document basic work and data flows, financial, production and quality management processes to increase efficiency of your business with ConcepDraw PRO. Business process mapping software with Flowchart Maker ConceptDraw PRO includes extensive drawing tools, rich examples and templates, process flowchart symbols and shape libraries, smart connectors that allow you create the flowcharts of complex processes, process flow diagrams, procedures and information exchange. Process Flowchart Solution is project management workflow tools which is part ConceptDraw Project marketing project management software. Drawing charts, diagrams, and network layouts has long been the monopoly of Microsoft Visio, making Mac users to struggle when needing such visio alternative like visio for mac, it requires only to view features, make a minor edit to, or print a diagram or chart. Thankfully to MS Visio alternative like ConceptDraw PRO software, this is cross-platform charting and business process management tool, now visio alternative for making sort of visio diagram is not a problem anymore however many people still name it business process visio tools.
Example Process Flow
A flowchart is a picture of the separate steps of a process in sequential order. ConceptDraw PRO is a Process Flowcharts software. This software includes basic package of process flow examples. The software contains object libraries with vector stencils that allows you use RapidDraw technology. By clicking on direction arrows you can add a new object to the flowchart.Diagramming Software for Design UML Communication Diagrams
UML Communication Diagram depicts the interactions between objects or parts in terms of sequenced messages and describes both the static structure and dynamic behavior of a system.
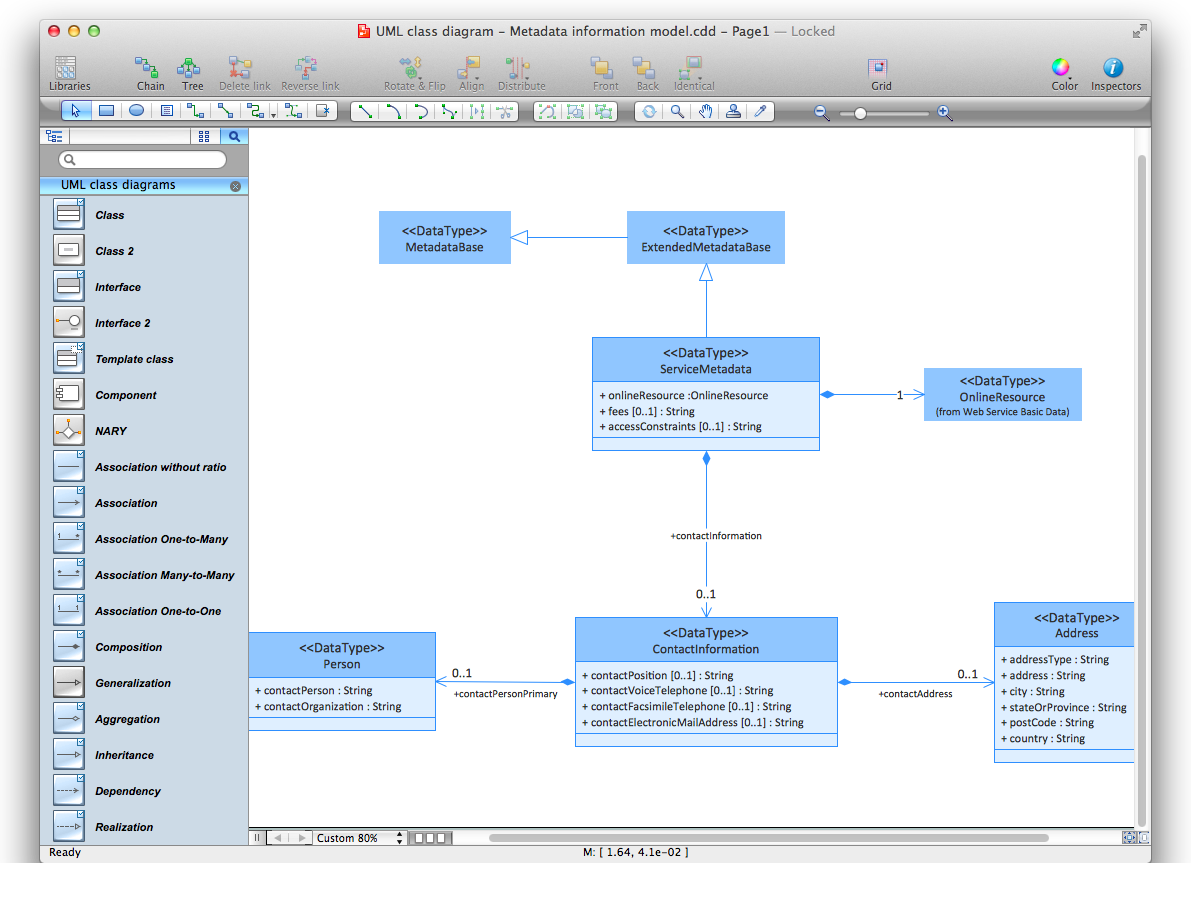
UML Class Diagrams. Diagramming Software for Design UML Diagrams
In software engineering, a UML Class Diagrams is a type of static structure diagram that is used both for general conceptual modeling of the systematics of the application, and for detailed modeling translating the models into programming code. Use ConceptDraw PRO with UML class diagram templates, samples and stencil library from Rapid UML solution to show the classes of system, their attributes, operations or methods, and the relationships among the classes.
Diagramming Software for Design UML Collaboration Diagrams
ConceptDraw helps you to start designing your own UML Collaboration Diagrams with examples and templates.
UML Deployment Diagram. Diagramming Software for Design UML Diagrams
Deployment diagram describes the hardware used in system implementations and the execution environments and artifacts deployed on the hardware.
Diagramming Software for UML Composite Structure Diagrams
UML Composite Structure Diagram shows the internal structure of a class and the possible interactions at this structure.
Wireframe Tools
A wireframe is a scheme of a future web page. Wireframe illustrates the web page structure, location and size of the main elements, as well as their interaction with the user. With such scheme designer defines the functionality of the page, not its appearance.Technical Flow Chart Example
What illustrates a technical flow chart? Technical flow chart is a diagrammatic representation which visually illustrates the sequence of operations that must to be performed to get the problem's solution. ConceptDraw PRO enhanced with Flowcharts Solution from the "Diagrams" Area of ConceptDraw Solution is a perfect software for drawing Technical Flow Chart Example illustrating the essence and importance of the technical flow chart use.Gantt charts for planning and scheduling projects
ConceptDraw PROJECT is an excellent simple project scheduling software. It maintain classic project gantt charts and the line of professional reports on resources usage. It include handy critical path scheduling software tools and diagraming tools which helps prepare the presentation of project status. It include project tracking dashboard to keep project metrics upto date, also it have handy feature to export project management dashboard in excel file.Example of DFD for Online Store (Data Flow Diagram) DFD Example
Data Flow Diagram (DFD) is a methodology of graphical structural analysis and information systems design, which describes the sources external in respect to the system, recipients of data, logical functions, data flows and data stores that are accessed. DFDs allow to identify relationships between various system's components and are effectively used in business analysis and information systems analysis. They are useful for system’s high-level details modeling, to show how the input data are transformed to output results via the sequence of functional transformations. For description of DFD diagrams are uses two notations — Yourdon and Gane-Sarson, which differ in syntax. Online Store DFD example illustrates the Data Flow Diagram for online store, the interactions between Customers, Visitors, Sellers, depicts User databases and the flows of Website Information. ConceptDraw PRO enhanced with Data Flow Diagrams solution lets you to draw clear and simple example of DFD for Online Store using special libraries of predesigned DFD symbols.
Diagramming Software for Design UML Package Diagrams
UML Package Diagram illustrates the functionality of a software system.
- Examples Of Hand Tools Drawing
- 7 tools that should be in every home
- Pict Tool Example
- Tools - Vector stencils library | 7 tools that should be in every home ...
- All Kind Of Hand Tools With Label
- 7 tools that should be in every home | Basketball Court Diagram and ...
- Tools - Vector stencils library | Diagram Of Hammer And Hand Saw
- Seven Basic Tools of Quality | Process Flowchart | 7 tools that ...
- Hand Saw Drawing Hd
- Five Examples Of Hand Tools Diagram
- 7 tools that should be in every home | Offensive Play – Double Wing ...
- Diagram Of Different Electrical Hand Tool
- Tools - Vector stencils library | Examples Of Phillips Screw Driver
- Nail room | Tools - Vector stencils library | Spa | Nail Png
- Tools - Vector stencils library | Design elements - Day spa ...
- Tools - Vector stencils library | Diagram Of Spade
- Tools - Vector stencils library | Diagram Of Screwdriver And Its ...
- Funny aquatic fauna - Vector stencils library | DroidDia prime | Sales ...
- Manufacturing and Maintenance | Manufacturing and Maintenance ...
- Tools - Vector stencils library | Diagram Of A Garden Trowel
