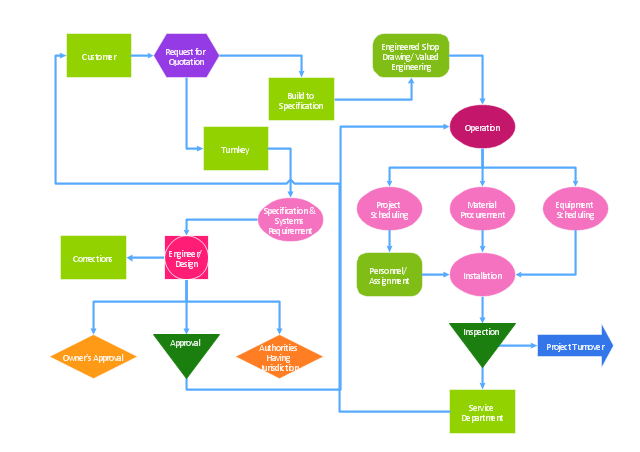
"The Process Flow Chart provides a visual representation of the steps in a process. ...
When to Use:
One of the first activities of a process improvement effort is constructing a flowchart. It provides the following benefits:
1- It give you and everyone a clear understanding of the process.
2- Facilitates teamwork and communication.
3- Helps to identify non-value-added operations."
[bexcellence.org/ Flow-Chart.html]
This TQM diagram example shows a business process that can be then analyzed to improve the effectiveness and diagnose quality issues that require resolution.
This example was created using the ConceptDraw PRO diagramming and vector drawing software extended with the Total Quality Management (TQM) Diagrams solution from the Quality area of ConceptDraw Solution Park.
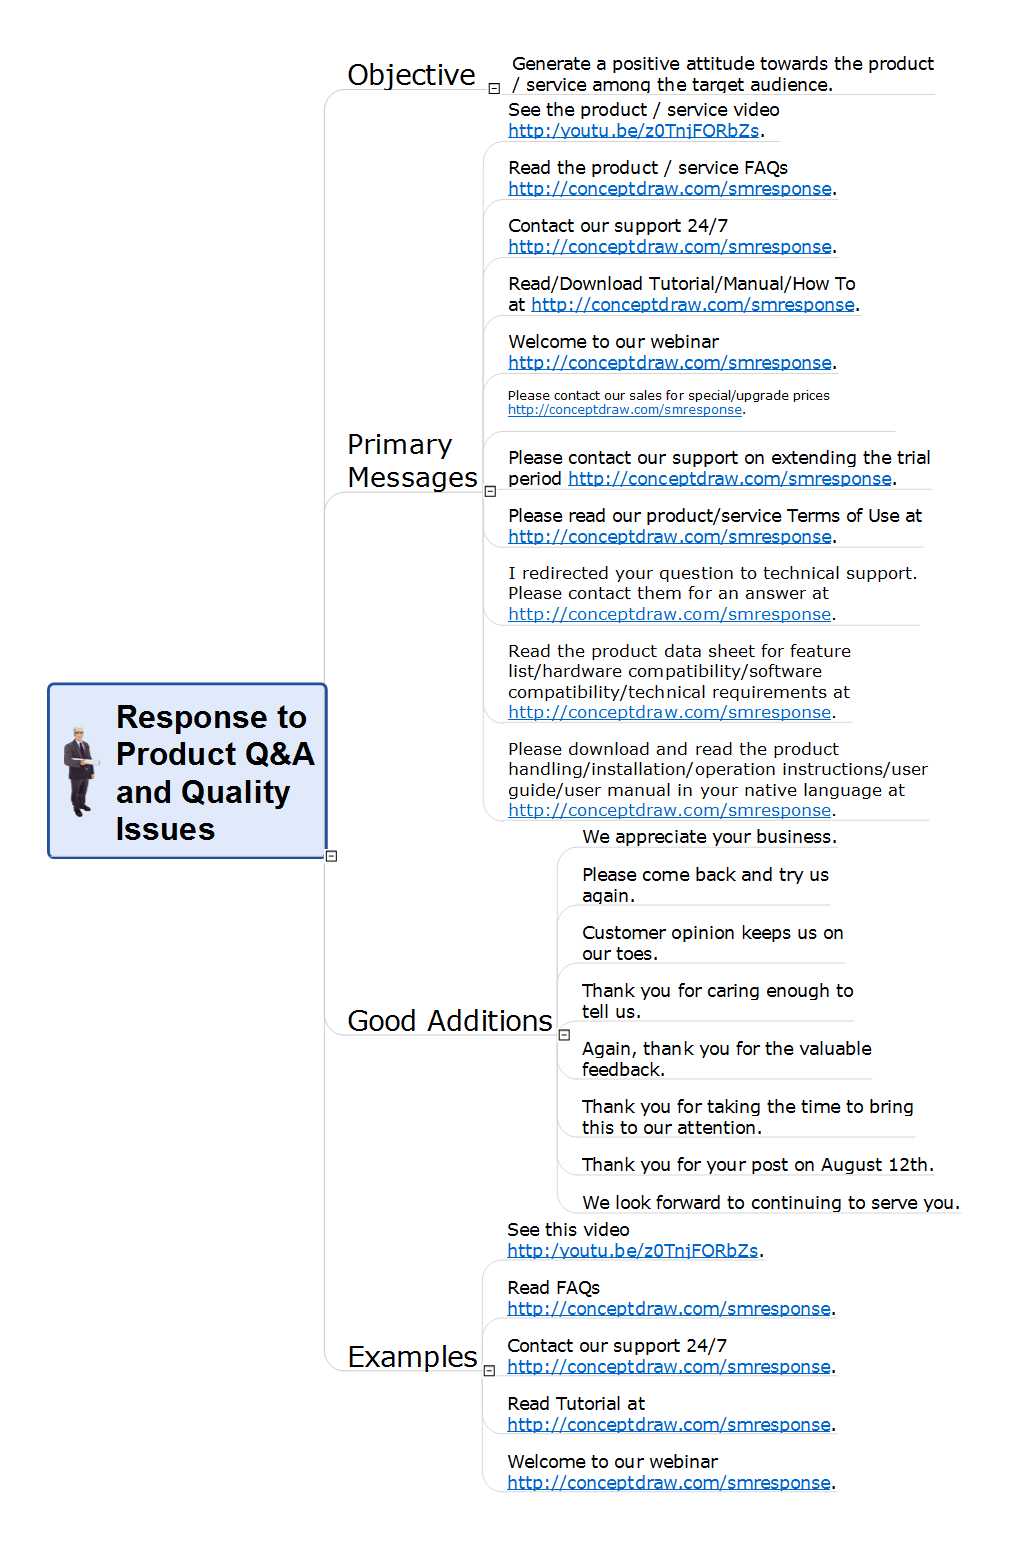
Q&A Quality Issues
Each product and service must to meet specific consumer demands, the quality characterizes conformity of goods to these requirements. The company's success is strongly determined by quality and cost of provided services and produced goods. In other words, in order to achieve a success in its activities, the company needs to ensure competitive quality and competitive prices for their products and services. The quality assurance (QA) is a set of actions planned and systematically implemented in the framework of the quality system, needed for creation a product of appropriate quality. It is one of the key elements of any business, any sphere of production, including software development and IT. The quality assurance in IT covers all technological stages of development, release and operation of software information systems, with a goal to develop a quality product. This action Mind Map constructed in ConceptDraw MINDMAP helps to clarify for customer the questions related to quality issues and quality assurance of products or services.Quality issues in heir organization
ConceptDraw Quality MindMap solution is a perfect additional tool for the quality team of your organization.
 Seven Basic Tools of Quality
Manage quality control in the workplace, using fishbone diagrams, flowcharts, Pareto charts and histograms, provided by the Seven Basic Tools of Quality solution.
Quality Mind Maps - samples and templates
Use samples and templates to describe your own quality processes, brainstorm, and structure quality issues.
 Cross-Functional Flowcharts
Cross-functional flowcharts are powerful and useful tool for visualizing and analyzing complex business processes which requires involvement of multiple people, teams or even departments. They let clearly represent a sequence of the process steps, the order of operations, relationships between processes and responsible functional units (such as departments or positions).
Cause and Effect Analysis - Fishbone Diagrams for Problem Solving
Fishbone diagram is a powerful tool used for solving business problems and obstacles. ConceptDraw PRO software extended with Fishbone Diagrams solution from the Management area of ConceptDraw Solution Park is a helpful tool for cause and effect analysis. It gives the ability to easy identify many possible causes and factors which cause the effects and to draw Fishbone Diagrams for problem solving.TQM Diagram Example
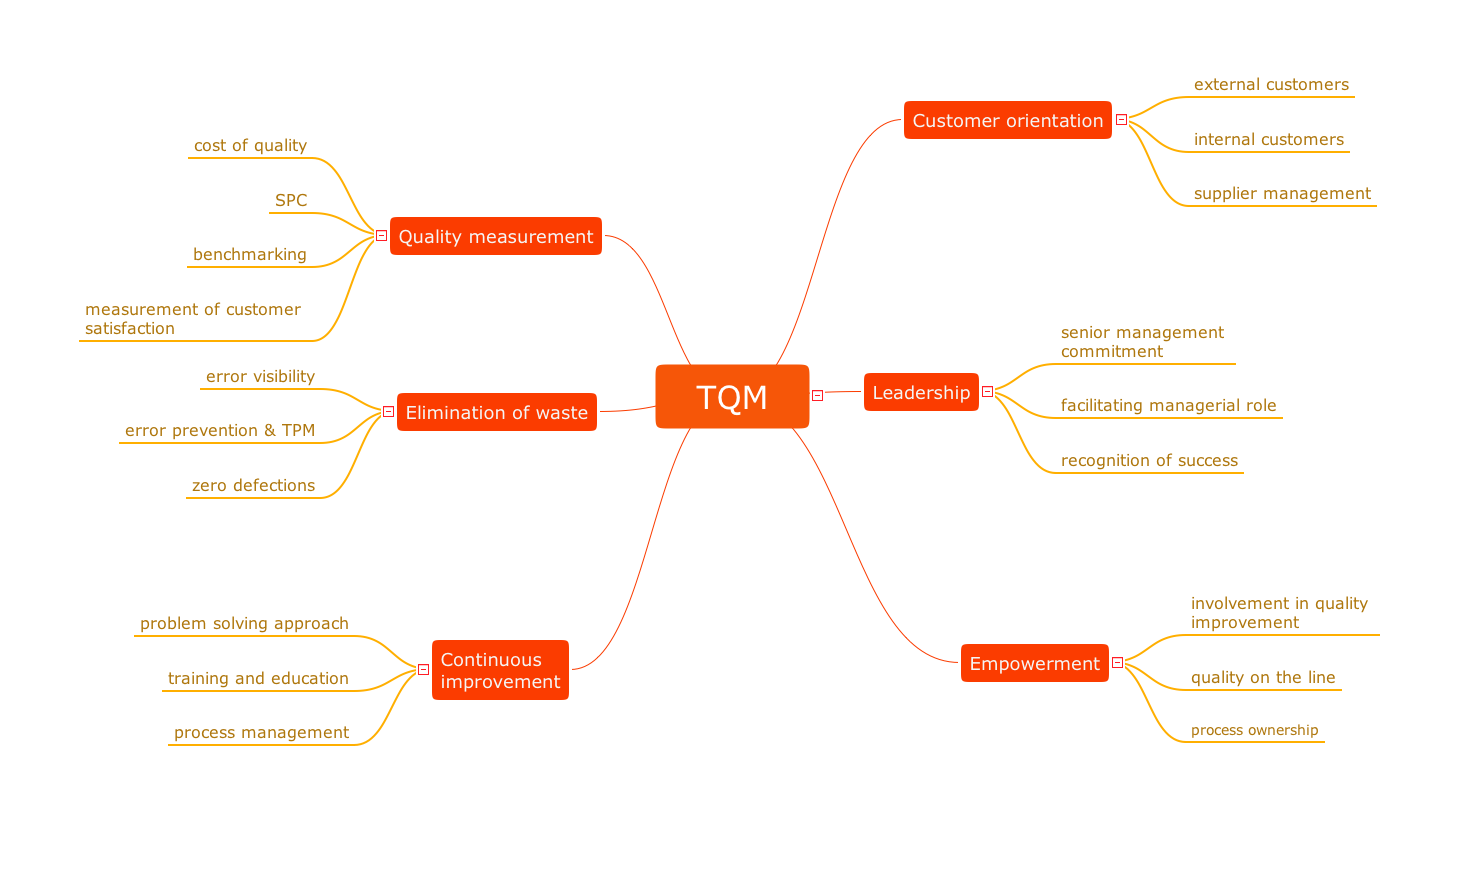
The Total Quality Management Diagram solution helps you and your organization visualize business and industrial processes. Create Total Quality Management diagrams for business process with ConceptDraw software.
 House of Quality
House of Quality solution provides the powerful drawing tools, numerous specific samples and examples, and set of vector design elements of House of Quality shapes and symbols, which will help you in application the Quality function deployment (QFD) methodology and in easy creation the House of Quality Matrices intended for satisfaction the consumers' desires and requirements, for representing them in a visual way and then transformation into the targets and technical requirements to be followed for development the best products.
- Cause and Effect Analysis - Fishbone Diagrams for Problem Solving ...
- Tqm Flowchart Example
- Quality Problem Example
- Quality Mind Map | Quality Problems Examples
- Fishbone Diagrams | Fishbone diagram - Causes of low- quality ...
- Fishbone Diagrams | Total Quality Management with ConceptDraw ...
- Total Quality Management Value | TQM diagram example ...
- Process Flowchart | TQM Diagram Example | TQM Diagram ...
- Quality Management Issue Report About Fishbone Diagram Pdf
- TQM Diagram Example | Total Quality Management TQM Diagrams ...


