Marketing and Sales Organization chart. Organization chart Example
The use of Organization Charts is very popular at the fields of marketing and sales. They help to depict in a visual form a lot of information about organization: the company's structure, relationships of positions within an organization in terms of authorities and responsibilities, and company's strategies. All Organizational Charts are constructed from the similar building blocks (rectangles and lines), this makes them easily for interpretation and understanding by all interested people inside and outside of this company, such as shareholders, employees, investors, distributors, suppliers, customers, etc. Organization Charts can be hand-drawn on the paper, however the preferable is to use a special software. ConceptDraw DIAGRAM diagramming and vector graphics software extended with useful Organizational Charts solution is ideal for easy representing information and data, and professional drawing Marketing and Sales Organization Chart with any depth of detailing. Organizational structure may differ during the company's development, you can design and compare the charts on each stage.Marketing Sales Funnel Examples
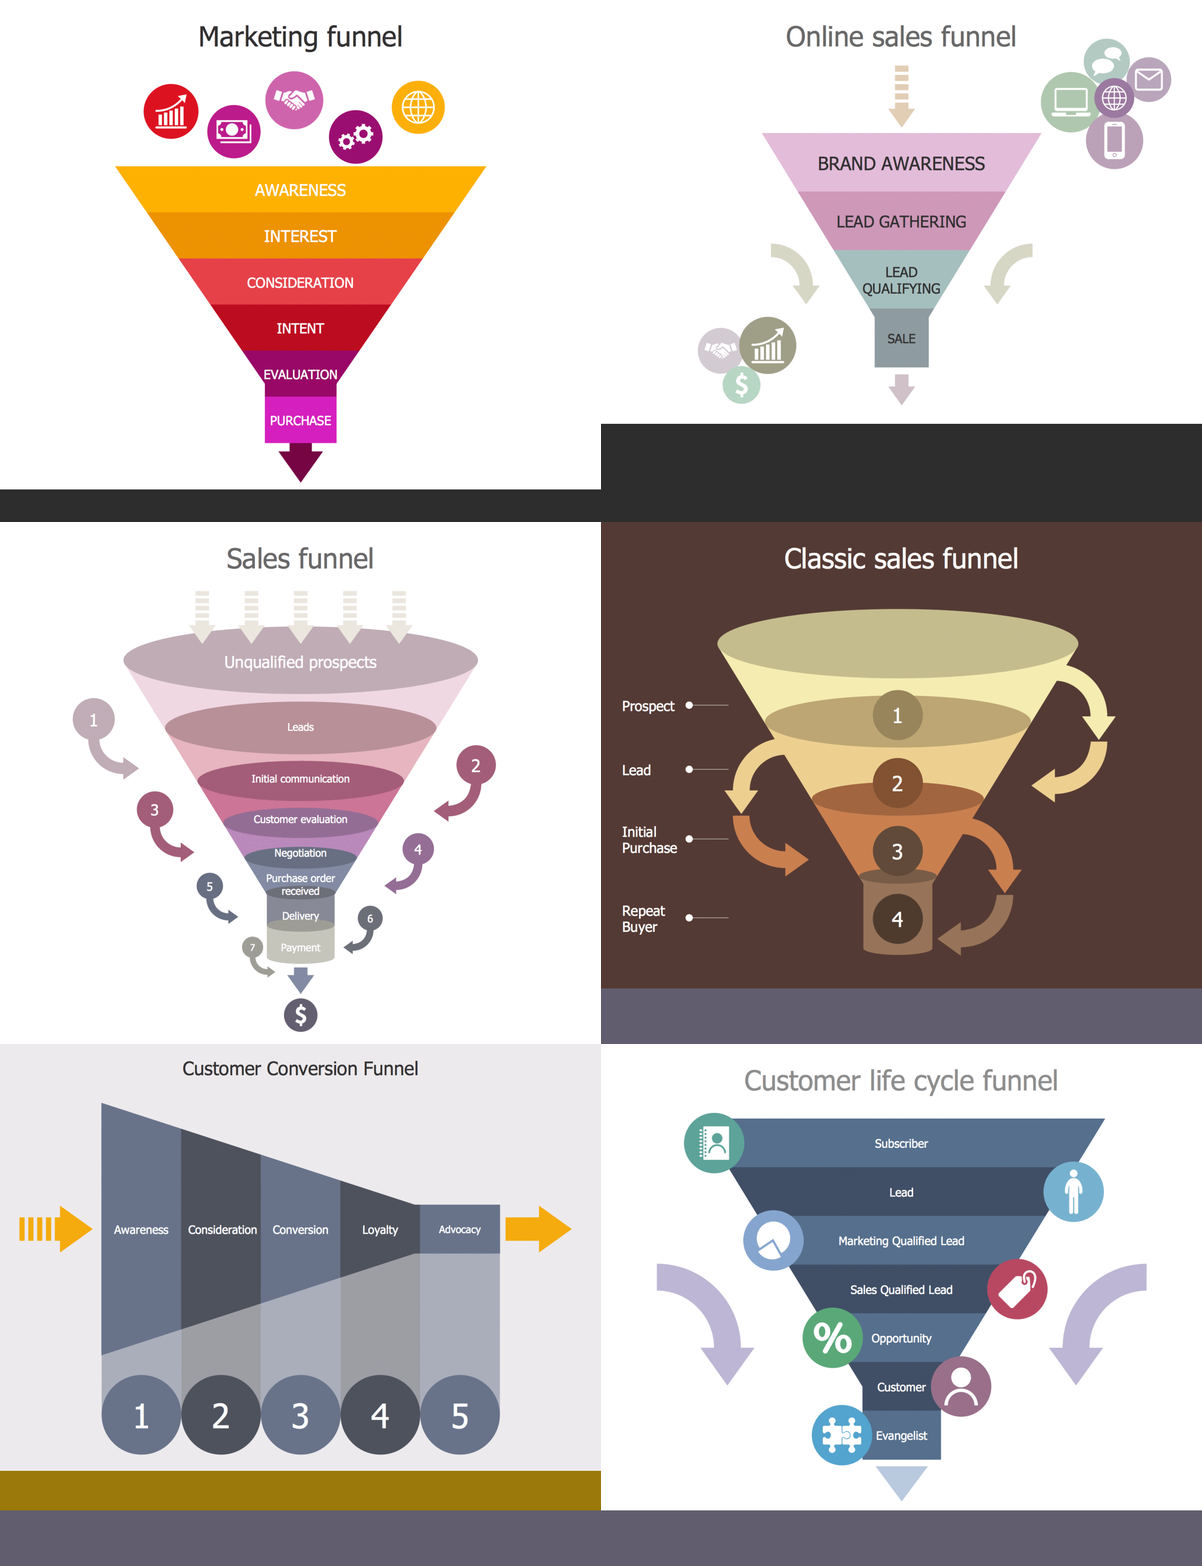
In order to boost your marketing results and so to increase the sales, the ConceptDraw DIAGRAM diagramming and vector drawing software can be used. The last-mentioned tool was developed especially for business specialists who seek for the right application to use in their field, including marketing. Having the Funnel Diagrams solution to use while working in the ConceptDraw DIAGRAM application may simplify your tasks of creating the professionally-looking marketing and sales funnel diagrams, such as the purchase ones.
 Sales Flowcharts
The Sales Flowcharts solution lets you create and display sales process maps, sales process workflows, sales steps, the sales process, and anything else involving sales process management.
Sales Process Flowchart. Flowchart Examples
Sales Process Flowchart is an invaluable tool for business. It gives you opportunity to visualise and better understand the sales process, reveal and also visually highlight issues or bottlenecks, and predict the number of sales. The Flowchart is ideal method to represent in details all steps of the process, tasks and decisions needed to obtain maximum effectiveness and success. The steps are graphically represented by boxes linked with arrows indicating direction of the workflow, decision is shown by diamond. The sales process is closely linked to the company's success and usually includes the following main steps: Product knowledge, Prospecting, Planning the sale (Pre-approach), Approach, Need assessment, Presentation, Meeting objections, Gaining commitment, Follow-up. Create fast and easy your own Flowcharts of sales business processes using the ConceptDraw DIAGRAM ector graphic software extended with Cross-Functional Flowcharts solution from Business Processes area and also Sales Flowcharts solution from Marketing area of ConceptDraw Solution Park.
 Sales Dashboard
Sales Dashboard solution extends ConceptDraw DIAGRAM software with templates, samples and library of vector stencils for drawing the visual dashboards of sale metrics and key performance indicators (KPI).
Venn Diagram Template for Word
This template shows the Venn Diagram. It was created in ConceptDraw DIAGRAM diagramming and vector drawing software using the ready-to-use objects from the Venn Diagrams Solution from the "Diagrams" area of ConceptDraw Solution Park.Remote Projects in Corporate Strategy
Communication is the main challenge and the key success factor for organizational project management in company with remote projects. Communicating visually via Skype you bring all projects together to achieve corporate goals.
Six Markets Model Chart Template
This template shows the Six Markets Model Chart and was included in Marketing Diagrams Solution. It is available from ConceptDraw STORE and can be used as the base for creating your own marketing diagrams.Business People Clipart
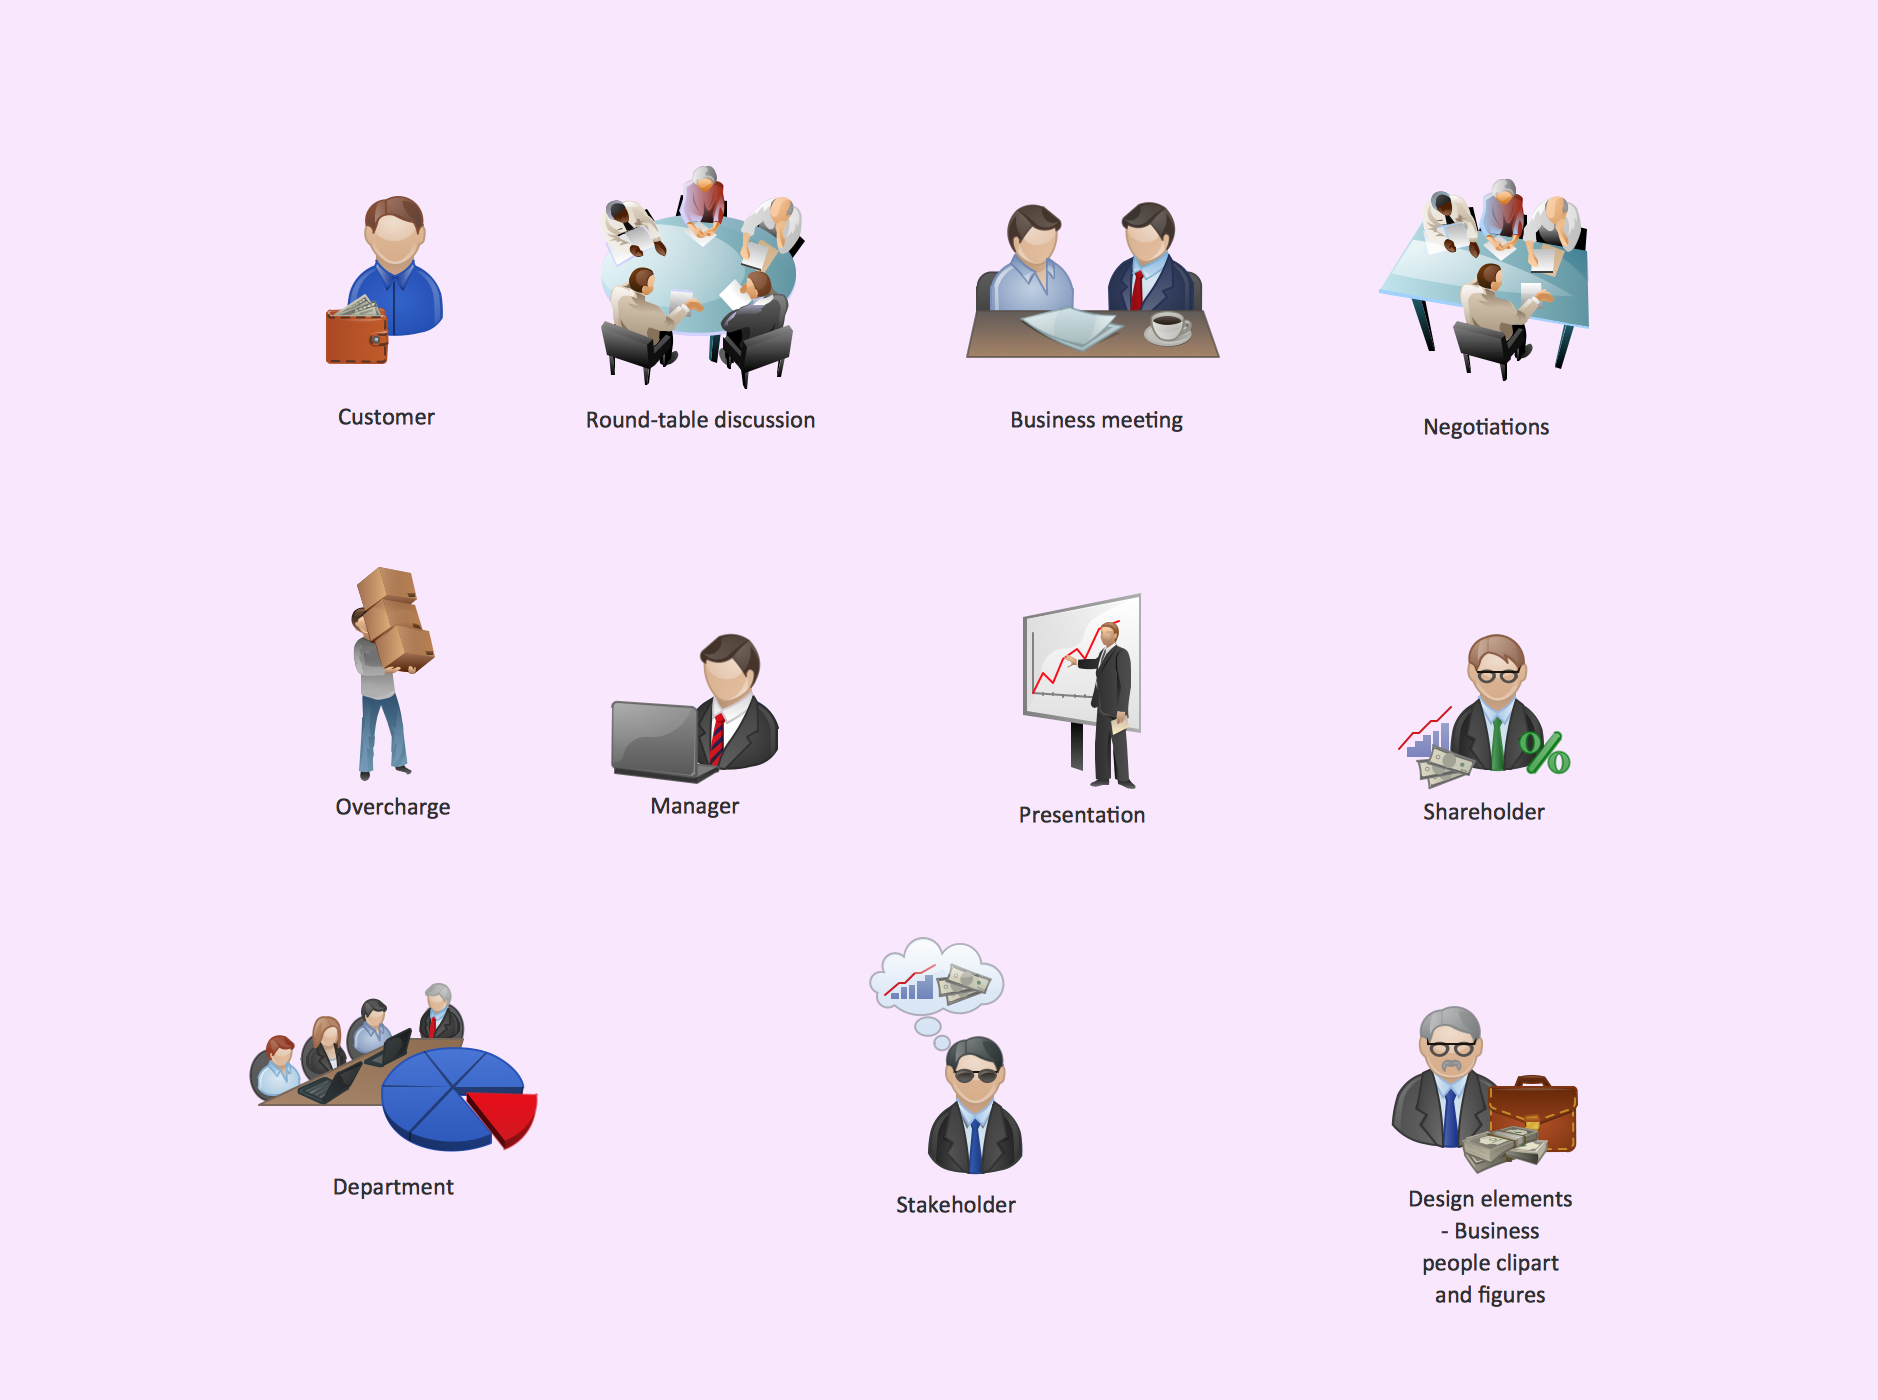
Business People Clipart - Business and Finance solution from Illustration area of ConceptDraw Solution Park. Use it to quick draw illustrations, diagrams and infographics for your business documents, presentations and websites. The vector stencils library Business People Clipart includes 12 images.Sales Process Map
You need create a Sales Process Map? Use the ConceptDraw DIAGRAM software which is ideal for the sales process management, marketing and engineering thanks to the powerful Sales Flowcharts solution from the Marketing area of ConceptDraw Solution Park.Marketing Analysis Diagram
An example of marketing analysis diagram, can be used to analyse product market and define marketing strategy. This types of charts used by small business project management for making presentations on market shares, it used by marketing project management software and project management tracking tools for reporting results and statuses.Business Productivity - Marketing
Mind Map is effective tool for depiction the main idea and related concepts, and representation a thought process. Mind Maps have essential value in marketing field, advertising and sales. They help successfully accomplish marketing goals and easy get marketing answers, to achieve a sustainable competitive advantages and increasing sales. Mind Maps help in new product development, they allow to generate and structure ideas about its properties and features, to define the target customers, brainstorm the key words and phrases for advertising and sales materials. ConceptDraw MINDMAP is a perfect marketing diagramming and marketing strategy tool that help accomplish marketing goals, represent marketing information and easy design Marketing Mind Maps and Marketing Diagrams (Marketing Step Chart, Marketing Mix Diagram, Market Environment Analysis Charts, Sales Pyramids, Target and Marketing Scope Diagrams, Feature Comparison Chart, Product Position Map, Products Comparison Chart, Timeline, SWOT, Boston Growth Matrix, Ansoff Product-Market Growth Matrix) for further using in visual documents and presentations.Sales Process Flowcharts
ConceptDraw DIAGRAM diagramming and vector drawing software extended with Sales Flowcharts solution from the Marketing area of ConceptDraw Solution Park offers the set of extensive tools for quick and easy drawing professional looking Sales Process Flowcharts.The Sales Process
The Sales Process is a complex approach for selling a product or service which assumes many steps including the sales planning, realization of the sales marketing and management strategies, sales process analysis, etc. Now we have a ConceptDraw DIAGRAM software extended with unique Sales Flowcharts solution from the Marketing area of ConceptDraw Solution Park which ideally suits for the planning and realization the company's sales process.Matrix Organization Structure
Matrix organizational structure is one of the main forms of structures which is actively used by organizations to carry forth the functions of a company visually and effectively. Now we have ConceptDraw DIAGRAM diagramming and vector drawing software extended with 25 Typical Orgcharts solution from the Management area of ConceptDraw Solution Park which will help easy represent matrix organizational structure of any degree of complexity.Sales Process Management
Sales process management is a business discipline which focuses on the development and practical application of various sales techniques, and on the management of sales operations of the company.It is effective to use professional software for the sales process management. ConceptDraw DIAGRAM diagramming and vector drawing software extended with Sales Flowcharts solution from the Marketing area of ConceptDraw Solution Park is the best choice.
Sales Process
ConceptDraw DIAGRAM is effective software for a variety of activity fields. Now, extended with Sales Flowcharts solution from the Marketing area of ConceptDraw Solution Park it become also useful in the field of sales. It helps to design professional looking Sales Flowcharts, Sales Process Flowcharts, Sales Process Maps, Plans and Diagrams to effectively realize the process of selling a product or service, and to display the sales results.
 Funnel Diagrams
Funnel Diagrams solution including wide range of funnel diagram samples, sales funnel examples, and vector design elements, makes the ConceptDraw DIAGRAM ideal for funnel management and creation the Funnel Diagrams of different types and designs, AIDA Model, AIDAS, ACCA Dagmar, Rossiter-Percy Model, Sales funnel, Marketing funnel, Search funnel, Brand funnel, Purchase funnel, Lead funnel, Conversion funnel, Business funnel, etc. You are free to choose to place your funnel object horizontally or vertically, you can use the objects with desired quantity of sales funnel stages, as well as to modify their size, color filling, and other parameters to make exceptionally looking Funnel diagrams fully responding to your desires.
Flowchart of Products. Flowchart Examples
This sample shows the Flowchart of the Sustainment and Disposal. A Flowchart is a graphically representation of the process that step-by-step lead to the solution the problem. The geometric figures on the Flowchart represent the steps of the process and are connected with arrows that show the sequence of the actions. The Flowcharts are widely used in engineering, architecture, science, analytics, government, politics, business, marketing, manufacturing, administration, etc.Line Chart Template for Word
This sample was created in ConceptDraw DIAGRAM diagramming and vector drawing software using the Line Graphs Solution from Graphs and Charts area of ConceptDraw Solution Park. This sample shows the Line Chart of annual percentage change. The Line Chart allows you to clearly see the changes of data over the time.- Sales Process Flowchart. Flowchart Examples | Sales Process ...
- Entity-Relationship Diagram (ERD) | Marketing Sale Relationship
- Business Process Diagrams | Fishbone Diagram | Rapid UML ...
- Sales And Market Entity Relation
- Example Erd Of Sales And Marketing System
- Fishbone Diagram Sample For Sales Marketing
- Marketing Organization Chart | Marketing and Sales Organization ...
- Flowchart Marketing Process. Flowchart Examples | Content ...
- Entity Relationship Diagram For Product Sales Management
- Marketing Analysis Diagram | Flowchart Example : Flow Chart of ...
- Sales Flowcharts | Flowchart Example : Flow Chart of Marketing ...
- Flowchart Marketing Process. Flowchart Examples | Marketing Flow ...
- How to Draw an Organization Chart | Marketing and Sales ...
- Sales department - Vector stencils library | Design elements ...
- Sales Process Flowchart. Flowchart Examples | Sales Process ...
- Six Markets Model Chart | Basic Flowchart Examples | Marketing ...
- Flowchart Marketing Process. Flowchart Examples | Good Flow ...
- Example Of Flows Of Information Between Marketing And Sales
- Sales Process Flowchart. Flowchart Examples
- Marketing and Sales Organization chart. Organization chart ...


