SWOT Analysis
Most of the data needed for market analysis (demand, prices, volume of sales, etc.) are undefined, and in future are possible their changes as in the worst and the best side. SWOT analysis is effective method for prediction these processes and decision making for organizations that function in a competitive environment. It allows you to see the whole situation, to identify the strengths and weaknesses of organization (advantages and disadvantages), as well as opportunities and threats of external environment. The results of SWOT analysis are the basis for optimization the business processes, for development by the leading specialists in organization of interrelated complex of strategies and competitive activities. ConceptDraw DIAGRAM software enhanced with SWOT and TOWS Matrix Diagrams Solution will effectively help you in strategic planning for your company, department, project, in development marketing campaign, in identification of four categories of factors of internal and external environment of organization, and construction professional-looking SWOT and TOWS matrices.SWOT Analysis
When starting a new business project or business venture and making the strategic decisions, you need to attach all strengths, utilize all opportunities to eliminate weaknesses and to avoid potential threats. All these actions look like hard, but it is not so when is applied a SWOT Analysis method. The main goal of this method is to help develop a strong business strategy, its major tools are SWOT Matrix and SWOT Mind Map that help you define the internal strengths and weaknesses, and also external opportunities and threats that you may face. The Mind Map is a unique visual tool, which lets you see immediately the key points and gaps, and to establish the links between seemingly unrelated information. ConceptDraw MINDMAP software is effective to save your time and efforts when carrying out a SWOT Analysis. The SWOT and TOWS Matrix Diagrams solution, that is available from ConceptDraw Solution Park, contains easy-to-use Mind Map templates to help you identify the Strengths, Weaknesses, Opportunities, and Threats, and represent the SWOT analysis results on the professionally-looking Mind Map.This SWOT matrix diagram example was created on the base of article "An Easy Way To Jumpstart Your Strategic Plan: SWOT" by Leslie Wolf from the website of the California Digital Library, the University of California. "Strategic planning doesn’t have to be a daunting and lengthy process. The goal is really a simple one: to help you understand your world and build a road map to guide your efforts. ...
This analysis tool can help you focus your attention on the specific success factors that are right for your team.
The tool is called a SWOT analysis. SWOT stands for Strengths and Weaknesses, Opportunities and Threats. Here’s what it means:
(1) Strengths are those positive internal attributes that strengthen your business or team. You can develop plans to capitalize on those strengths.
(2) Weaknesses are those negative internal attributes that are working against your success. You can shore up those weaknesses so they don’t stop your success.
(3) Opportunities are those external conditions that can have a positive effect on your goals. These opportunities can point you in the right direction.
(4) Threats are those external conditions that can have a negative effect on your goals. These threats will affect you less if you can identify and minimize them. ...
We thought it would be helpful to show you a sample SWOT analysis for a business you can easily visualize: a small independent bookstore in a university town. The store owner brought the team together to think about how the bookstore could survive during the continuing financial downturn. After an hour of brainstorming, this is the SWOT analysis they developed." [cdlib.org/ cdlinfo/ 2010/ 09/ 29/ an-easy-way-to-jumpstart-your-strategic-plan-swot/ ]
The matrix diagram example "SWOT analysis for a small independent bookstore" was created using the ConceptDraw PRO diagramming and vector drawing software extended with the SWOT Analysis solution from the Management area of ConceptDraw Solution Park.
How to Make SWOT Analysis in a Word Document
A SWOT Analysis is a popular tool of the strategic planning which is used to evaluate the Strengths, Weaknesses, Opportunities, and Threats that are involved in any businesses. Use of mind maps allows you to collect a lot of information used for SWOT Analysis, visually structure it and also identify the relationships between different parts of this information. SWOT and TOWS Matrix Diagrams solution for ConceptDraw Solution Park combines professional visual advantages of ConceptDraw MINDMAP software and presentation capabilities of ConceptDraw DIAGRAM , which together provide a complete work solution. The SWOT and TOWS diagrams, matrices or mind maps produced in ConceptDraw DIAGRAM using the predesigned vector objects or filling the ready templates, can be then easily exported to Microsoft Word, Microsoft Visio, Microsoft PowerPoint, Adobe PDF, and many other electronic file formats. The possibility of export makes easy the use of SWOT diagrams designed in ConceptDraw DIAGRAM and lets you efficiently collaborate even with people who maybe don't have this software.When To Use a Fishbone Diagram
Fishbone diagrams work for most entrepreneurs and almost any industry or person having a problem. Professional diagramming software may help you create Fishbone (Cause and Effect or Ishikawa) diagrams. When people are unclear about what is causing an issue, ConceptDraw DIAGRAM will be your lifesaver. When to use a Fishbone diagram? Originally developed as a quality control tool, you may find a Fishbone diagram helpful when used in many cases, such as to analyze a complex problem when there are many causes, for identifying all possible root causes for an effect or a problem, when you need different point of view to look on a problem, to uncover bottlenecks and identify where and why a process doesn't work, for acceleration a process when traditional ways of problem solving consume many time.Stakeholder Mapping Tool
Stakeholders are the groups of people or organizations whose contribution matters to the organization's success, this can be labour participation, financial participation, dissemination of information about organization, etc. So, the employees of the company, its suppliers, customers, media, public organizations, state authorities, all they are stakeholders of the company. ConceptDraw DIAGRAM diagramming and vector drawing software extended with Stakeholder Onion Diagrams Solution from the Management Area of ConceptDraw Solution Park is a powerful stakeholder mapping tool which allows easy create Stakeholder Onion diagrams and maps depicting the layers of a project, relationships of stakeholders to a project goal, and relationships between stakeholders.
 UK Map
The Map of UK solution contains collection of professionally designed samples and scalable vector stencil graphics maps, representing the United Kingdom counties, regions and cities. Use the Map of UK solution from ConceptDraw Solution Park as the base fo
Microsoft Azure
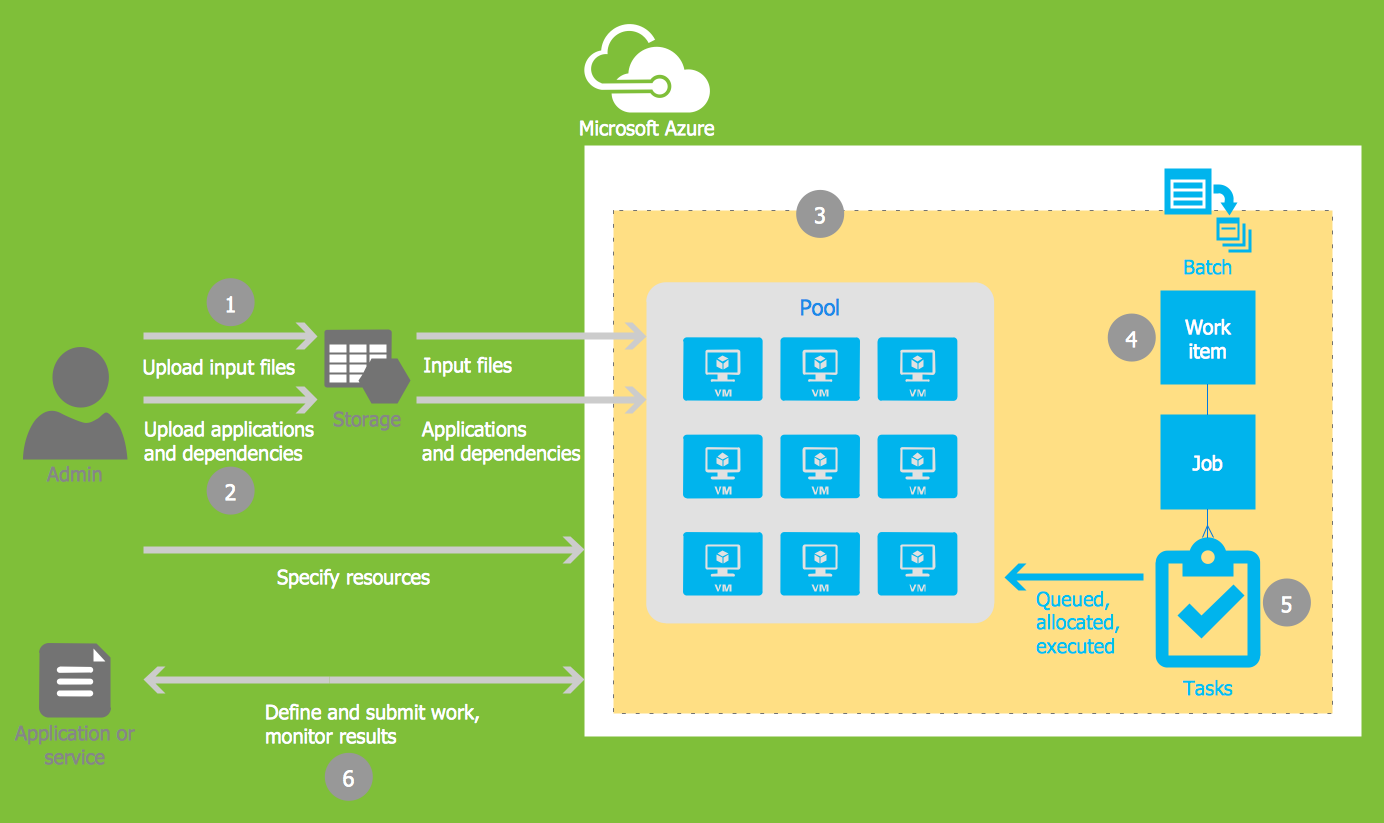
Microsoft Azure is widely used cloud platform which was created by Microsoft and now is managed by Microsoft datacenters in 19 regions of the world, and has a wide set of benefits and features. ConceptDraw DIAGRAM diagramming and vector drawing software extended with Azure Architecture Solution from the Computer and Networks area of ConceptDraw Solution Park is the best for designing various pictorial infographics, illustrations and materials showing the possibilities and work of Microsoft Azure Cloud System and Azure services.
 Workflow Diagrams
Workflow Diagrams solution extends ConceptDraw DIAGRAM software with samples, templates and vector stencils library for drawing the work process flowcharts.
 Australia Map
For graphic artists creating accurate maps of Australia. The Australia Map solution - allows designers to map Australia for their needs, offers a collection of scalable graphics representing the political geography of Australia, split into distinct state
Matrix Organization
Different organizations have different organizational structures. Matrix organization is one of the most popular and widely used type of organizational structure. Use ConceptDraw DIAGRAM diagramming and vector drawing software extended with 25 Typical Orgcharts solution from the Management area of ConceptDraw Solution Park for fast and easy designing matrix organizational chart for your company.Food Art
Food courts are very popular places. You want to increase attendance, advertise and invite attention to your food court? Make interesting design and create pictorial and bright food art posters and signboards, and don't forget to decorate your menu with images of tasty treats! ConceptDraw DIAGRAM diagramming and vector software supplied with Food Court solution from the Food and Beverage area of ConceptDraw Solution Park offers powerful drawing tools for effective food art.
 Line Graphs
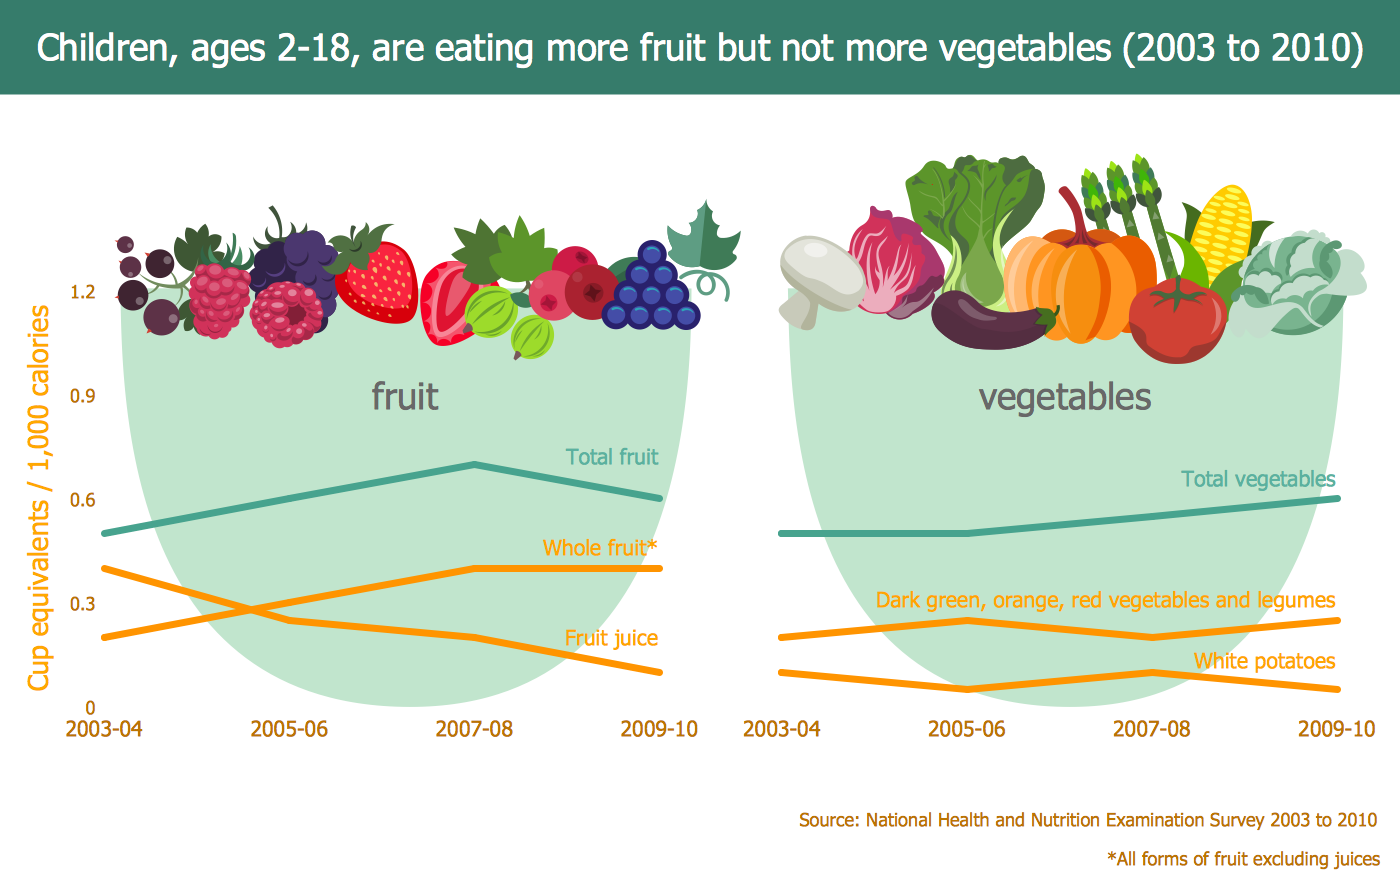
How to draw a Line Graph with ease? The Line Graphs solution extends the capabilities of ConceptDraw DIAGRAM with professionally designed templates, samples, and a library of vector stencils for drawing perfect Line Graphs.
 Azure Architecture
Azure Architecture solution bundles into one handy tool everything you need to create effective Azure Architecture diagrams. It adds the extra value to versatile ConceptDraw DIAGRAM software and extends the users capabilities with comprehensive collection of Microsoft Azure themed graphics, logos, preset templates, wide array of predesigned vector symbols that covers the subjects such as Azure management, Azure storage, and Azure services, amongst others, and allow you to illustrate Azure Architecture diagrams at any degree of complexity, to present visually your Azure cloud system architecture with professional style, to design Azure cloud topology, to document Windows Azure Architecture and Azure Cloud System Architecture, to visualize the great abilities and work of Microsoft Azure Cloud System and Azure services.
 Basic Line Graphs
This solution extends the capabilities of ConceptDraw DIAGRAM (or later) with templates, samples and a library of vector stencils for drawing Line Graphs.
- Personal Swot Analysis Examples For Students
- Personal Swot Analysis Pdf
- Example Of Personal Swot Analysis Pdf
- SWOT Analysis Solution - Strategy Tools | Swot Analysis Examples ...
- Personal Swot Analysis
- Self Swot Analysis Pdf
- Personal Swot Analysis Template
- Examples Of Personal Swot Analysis
- SWOT Analysis | SWOT Analysis | Self Evaluation Examples Of ...
- Personal Swot Analysis Ppt
- SWOT Analysis | SWOT Analysis | SWOT Matrix Template | Self Swot ...
- Personal Swot Analysis Ppt Free Download
- SWOT Analysis | SWOT Analysis | How to Add a Self -Drawn Object ...
- Swot Analysis Personal Development Plan Example
- Self Swot Analysis Template
- How to Create SWOT Analysis Template Using ConceptDraw PRO ...
- Engineering Student Personal Swot Analysis Sample
- Swot Analysis Of Self Example
- ConceptDraw PRO | Swot Analysis Of Myself As A Student
- Personal Swot Analysis Example Student


