 Value Stream Mapping
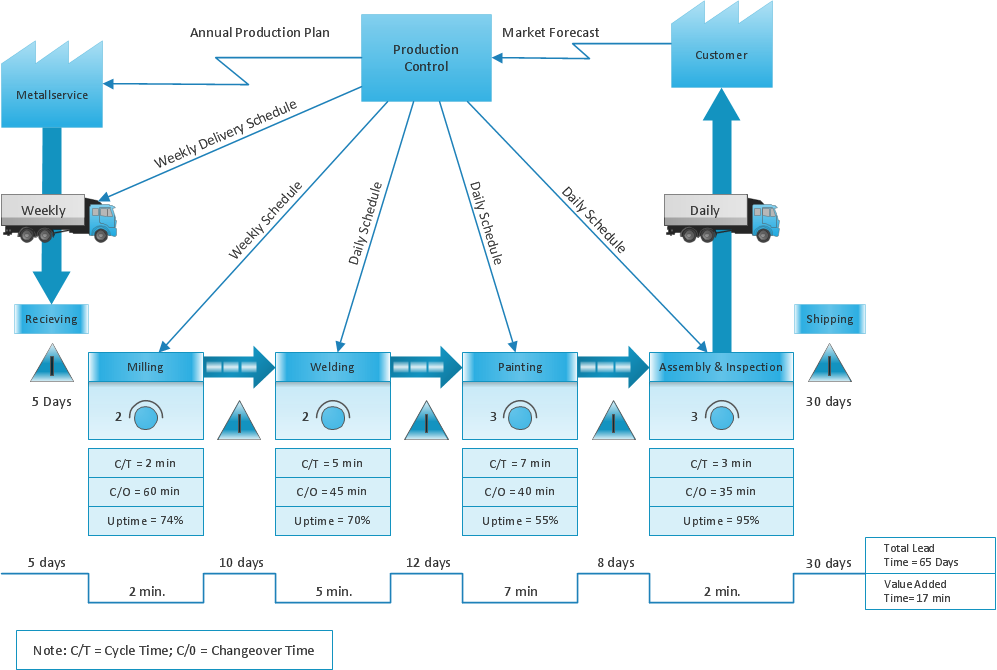
Value stream mapping solution extends ConceptDraw PRO software with templates, samples and vector stencils for drawing the Value Stream Maps (VSM) in lean manufacturing practice.
ConceptDraw Arrows10 Technology
Connecting objects manually in ConceptDraw PRO is a snap: - points; - Connecting groups of objects; - Auto-routing; - Connectors text; - Snap to Guides ; - Quick.ConceptDraw Arrows10 Technology
How should diagramming software work? The answer is - Fast and easy. "Tree"- mode drawing works like that. Just select objects in your drawing and press Tree or Chain button to connect all of them just in one click. Your diagram looks professional and it took only a moment to draw.
 Fault Tree Analysis Diagrams
This solution extends ConceptDraw PRO v9.5 or later with templates, fault tree analysis example, samples and a library of vector design elements for drawing FTA diagrams (or negative analytical trees), cause and effect diagrams and fault tree diagrams.
 ConceptDraw Solution Park
ConceptDraw Solution Park collects graphic extensions, examples and learning materials
ConceptDraw Arrows10 Technology
You can use text with any conceptDraw connectors to describe relationships between objects. Add text to connectors the same way you add text to any object - doubleclick a connector and type.Sentence Diagram
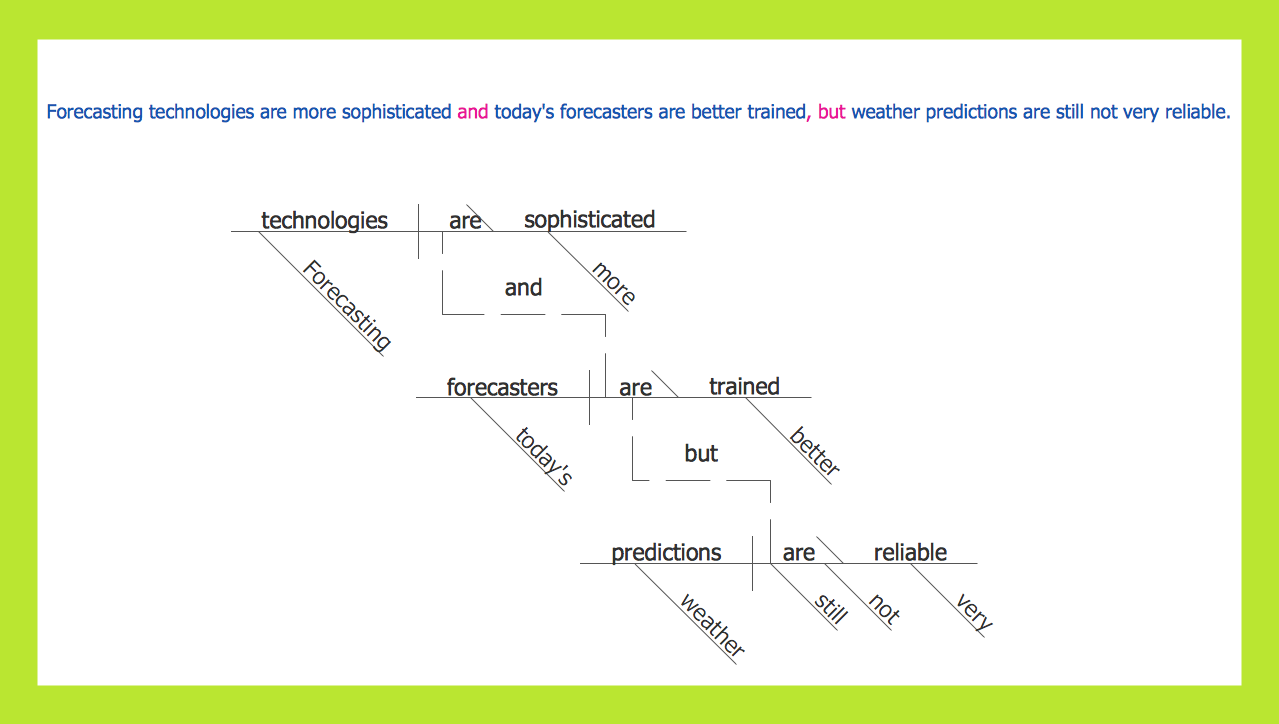
In pedagogy and theoretical syntax, a sentence diagram or parse tree is a pictorial representation of the grammatical structure of a sentence. The term "sentence diagram" is used more in pedagogy, where sentences are diagrammed. ConceptDraw PRO diagramming and vector drawing software extended with Language Learning solution from the Science and Education area is ideal for quick and easy drawing sentence diagrams of any complexity.
 Biology
Biology solution extends ConceptDraw PRO software with samples, templates and libraries containing biological vector symbols, to help you create scientific and educational designs in the field of biology.
 Event-driven Process Chain Diagrams
Event-driven Process Chain (EPC) Diagram is a type of flowchart widely used for modeling in business engineering and reengineering, business process improvement, and analysis. EPC method was developed within the Architecture of Integrated Information Systems (ARIS) framework.
How to Dramatically Reduce Drawing Time - New connection modes
The innovative ConceptDraw Arrows10 Technology included in ConceptDraw PRO is a powerful drawing tool that changes the way diagrams are produced. While making the drawing process easier and faster. This is more than enough versatility to draw any type of diagram with any degree of complexity.Scientific Symbols Chart
ConceptDraw PRO is the beautiful design software that provides many vector stencils, examples and templates for drawing different types of illustrations and diagrams.Mathematics Solution from the Science and Education area of ConceptDraw Solution Park includes a few shape libraries of plane, solid geometric figures, trigonometrical functions and greek letters to help you create different professional looking mathematic illustrations for science and education.
Cylinder Venn Diagram
You need design Cylinder Venn Diagram? Nothing could be easier with ConceptDraw PRO diagramming and vector drawing software extended with Venn Diagrams Solution from the “What is a Diagram” Area. ConceptDraw PRO allows you to design various Venn Diagrams including Cylinder Venn Diagrams.
 Seven Management and Planning Tools
Seven Management and Planning Tools solution extends ConceptDraw PRO and ConceptDraw MINDMAP with features, templates, samples and libraries of vector stencils for drawing management mind maps and diagrams.
 Audio, Video, Media
Use it to make professional-looking documents, impressive presentations, and efficient websites with colorful and vivid illustrations and schematics of digital audio, video and photo gadgets and devices, audio video connections and configurations, S Video connection, HD and 3D television systems, home entertainment systems, Closed-circuit television (CCTV) surveillance systems. All audio video schematics, drawings and illustrations designed in ConceptDraw PRO are professional looking, clear and understandable for all thanks to applying the most commonly used standards of designations, and are effective for demonstrating in front of a small audience and on the big screens.
Cross Functional Flowchart Examples
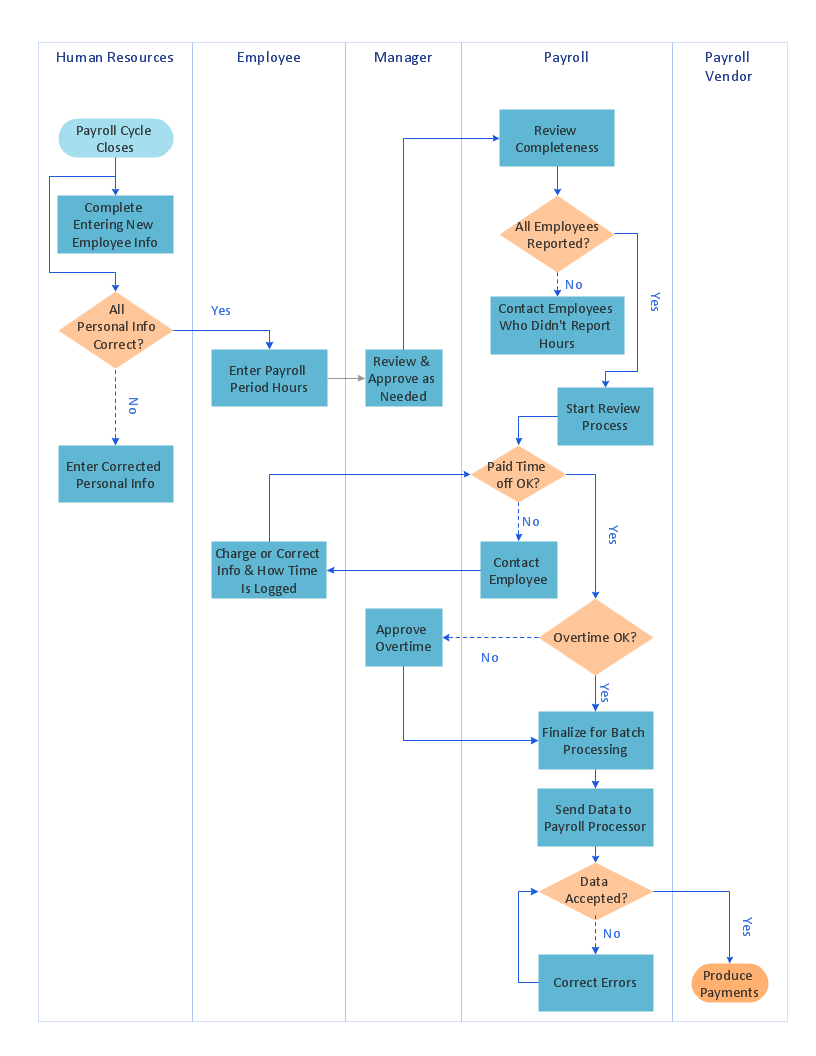
Take a look on an example of Cross-Functional-Flowchart, showing the software service cross-function process flowcharts among the different departments. It presents a simple flowchart among the customer, sales, technical support, tester and development. Try now Flowchart Software and Cross-Functional library with 2 libraries and 45 vector shapes of the Cross-Functional Flowcharts solution. Then you can use built-in templates to create and present your software service cross-function process flowcharts.- Venn Diagram Examples for Problem Solving. Venn Diagram as a ...
- Venn Diagram Examples for Problem Solving. Venn Diagram as a ...
- Venn Diagram Examples for Problem Solving. Venn Diagram as a ...
- How to Create a VSM Diagram Using ConceptDraw Value Stream ...
- PROBLEM ANALYSIS. Root Cause Analysis Tree Diagram | Using ...
- Mind Maps In Science Examples
- Venn Diagram Examples for Problem Solving. Environmental Social ...
- Venn Diagram Examples for Problem Solving. Computer Science ...
- Example Of Simple Flow Chart In Science
- Sentence Diagram | Best Value Stream Mapping mac Software ...
- Computer and Networks Area | Active Directory Diagram | Amazon ...
- PROBLEM ANALYSIS. Root Cause Analysis Tree Diagram | Root ...
- Basic Flowchart Symbols and Meaning | Scientific Symbols Chart ...
- Corrective Action Planning | 7 Management & Planning Tools ...
- Influence Diagram Software | Influence Diagram | CAD Drawing ...
- How to Draw an Organization Chart | How to Draw a Bubble Chart ...
- Root cause analysis tree diagram - Personal problem solution | Root ...
- ConceptDraw Arrows10 Technology | Create Block Diagram | How ...
- Decision tree diagram | Influence Diagram Software | Cause and ...
- Types of Flowcharts | Influence Diagram | Fault Tree Diagram ...


