Pyramid Chart Examples
Pyramid Charts and Triangle Diagrams are used to visually structure the topics and progressively order the quantitative data. They allow to illustrate hierarchical structure of the topics, proportional, interconnected and containment relations among the topics. The multilevel Pyramids and Triangle diagrams are constructed oriented up or down and divided into several horizontal slices. They are effectively used to represent marketing strategies, social strategies, information systems, market value, etc., to illustrate presentations, websites, documents, reports in business, finances, sales, management, marketing, media, training, consulting, and many other fields. To maximize the efficiency in drawing the Pyramid Charts, use the ConceptDraw DIAGRAM diagramming and vector drawing software extended with Pyramid Diagrams solution from Marketing area, which contains the set of Pyramid Chart examples, samples, templates and vector design elements of triangular diagrams and pyramids with different quantity of levels for various needs.Pyramid Diagram and Pyramid Chart
Pyramid Diagram, Triangle Chart or Triangular Diagram is a convenient and useful type of diagrams, which lets represent the data hierarchical structure and to illustrate the foundation-based relationships between the hierarchy levels. Pyramid Diagrams are used to visualize effectively the hierarchical, as well as proportional and foundation-based relationships, the process steps, the interconnections of organizational layers or topics. ConceptDraw DIAGRAM software enhanced with Pyramid Diagrams solution from Marketing area of ConceptDraw Solution Park is a powerful business charting software, that includes all required tools for designing the multilevel Pyramid Diagrams as quickly as possible. The build-in vector stencils and templates are the great aid for designers, a variety of examples and samples is a good base and source of inspiration. Use attractive and vivid 2D and 3D Pyramid Diagrams and Triangle Charts designed in ConceptDraw DIAGRAM to illustrate your documents, presentations, infographics, articles, reports, websites, etc.Pyramid Charts
ConceptDraw DIAGRAM extended with Pyramid Diagrams Solution from the Marketing Area of ConceptDraw Solution Park is a powerful Pyramid Charts making software. A Pyramid Chart has the form of triangle and hierarchically structures, organizes and help to analyze the information, data or ideas. Triangle is divided on the sections that usually have different widths. The width indicates the level of hierarchy among the topics.Pyramid Diagram
At the base of the identity of an organisational is its organizational culture.How to Create a Column Chart
The question how to create a column chart have a simple answer. Use ConceptDraw tips to find out how to create a column chart depicts your data the best way.
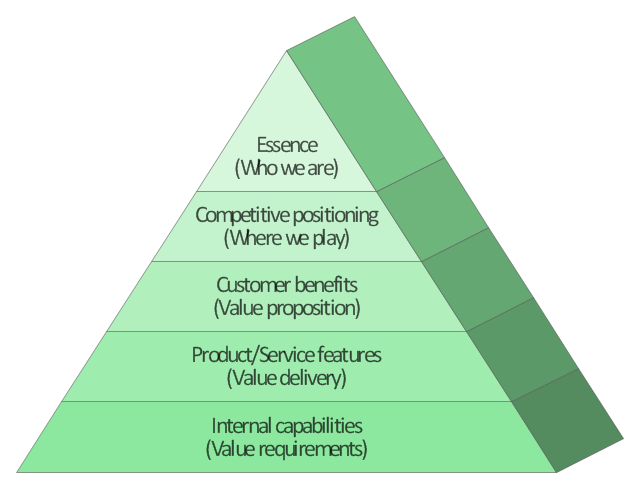
This market value pyramid diagram has 5 levels:
1) Essence (Who we are),
2) Competitive positioning (Where we play),
3) Customer benefits (Value proposition),
4) Product / Service features (Value delivery),
5) Internal capabilitiea (Value requirements).
Use this triangular scheme to develop your marketing strategy.
"Market value or OMV (Open Market Valuation) is the price at which an asset would trade in a competitive auction setting. Market value is often used interchangeably with open market value, fair value or fair market value, although these terms have distinct definitions in different standards, and may differ in some circumstances." [Market value. Wikipedia]
The triangle chart example "Market value" was created using the ConceptDraw PRO diagramming and vector drawing software extended with the Pyramid Diagrams solution from the Marketing area of ConceptDraw Solution Park.
Scatter Chart Examples
The Line Graphs solution from Graphs and Charts area of ConceptDraw Solution Park contains a set of examples, templates and design elements library of scatter charts. Use it to draw scatter graphs using ConceptDraw DIAGRAM diagramming and vector drawing software for illustrating your documents, presentations and websites.
Pyramid Diagrams
Pyramid Diagrams solution extends ConceptDraw DIAGRAM software with templates, samples and library of vector stencils for drawing the marketing pyramid diagrams.
Workflow Process Example
One of the most popular option helps to draw diagrams faster is pre-designed set of examples related to each kind of diagram. ConceptDraw DIAGRAM software extended with the Workflow Diagrams solution delivers a complete set of workflow process examples helps you to start making your own workflow faster.Chart Examples
Easy charting software comes with beautiful chart templates and examples. This makes it easy to create professional charts without prior experience.Bar Diagrams for Problem Solving. Create economics and financial bar charts with Bar Graphs Solution
Create bar graphs for visualizing economics problem solving and financial data comparison using the ConceptDraw DIAGRAM diagramming and vector drawing software extended with the Bar Graphs Solution from the Graphs and Charts area of ConceptDraw Solition Park.Pyramid Diagram
ConceptDraw Pyramid Diagram software allows drawing column charts using predesigned objects or drawing tools.Pyramid Diagram
Triangle diagram example of DIKW pyramid has 4 levels: data, information, knowledge and wisdom.Pyramid Diagram
The DIKW Pyramid refers loosely to a class of models for representing purported structural and/or functional relationships between data, information, knowledge, and wisdom.Polar Graph
This sample shows the Polar Graph. The Polar Graph is a graph in the polar coordinate system in which the each point on the plane is defined by two values - the polar angle and the polar radius. The certain equations have very complex graphs in the Cartesian coordinates, but the application of the polar coordinate system allows usually produce the simple Polar Graphs for these equations.- Marketing Pyramid
- Market value - Pyramid diagram | Pyramid Chart Examples | Pyramid ...
- Relative Value Chart Software | Pyramid Chart Examples | Pie Chart ...
- Pyramid Chart Examples | Porter's value chain matrix diagram | Bar ...
- Pyramid Diagram | Process Flowchart | Value Stream Mapping | Mis ...
- Market value - Pyramid diagram
- Marketing plan - Circular diagram | Market value - Pyramid diagram ...
- Pyramid Chart Examples | Workflow Process Example | Relative ...
- Market value - Pyramid diagram | Block diagram - Six markets model ...
- Market value - Pyramid diagram
- Six Markets Model Chart | Market value - Pyramid diagram | Market ...
- Pyramid Diagram and Pyramid Chart | Bar Chart Software | Rainfall ...
- Pyramid Chart Examples
- BCG Matrix | Competitor Analysis | Pyramid Chart Examples | Brand ...
- Pyramid Chart Examples | Pyramid Diagram | Pyramid Diagram ...
- Pyramid Diagram and Pyramid Chart
- Marketing | Positioning Map | Market value - Pyramid diagram ...
- Visio Stencil Layered Pyramid
- Marketing Analysis Diagram | Flowchart Marketing Process ...
- Market value - Pyramid diagram | Pyramid Charts | Pyramid Diagram ...