 Bar Graphs
The Bar Graphs solution enhances ConceptDraw PRO v10 functionality with templates, numerous professional-looking samples, and a library of vector stencils for drawing different types of Bar Graphs, such as Simple Bar Graph, Double Bar Graph, Divided Bar Graph, Horizontal Bar Graph, Vertical Bar Graph, and Column Bar Chart.
HelpDesk
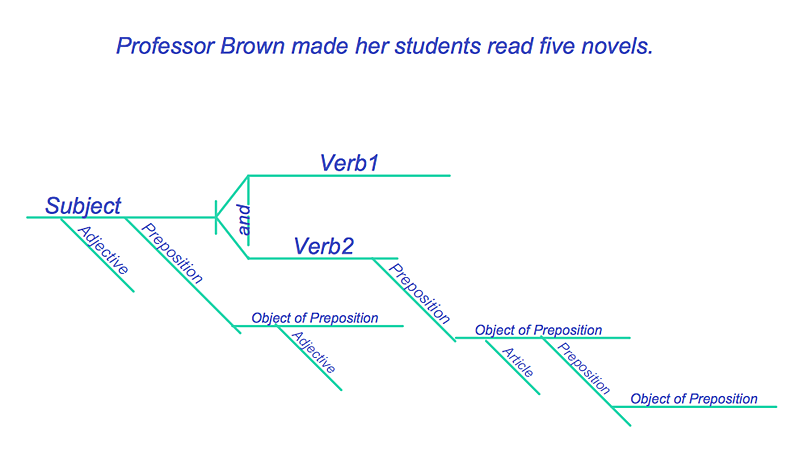
How to Diagram Sentences in ConceptDraw PRO
Diagramming sentences is a playful, fun way to learning English Grammer. Sentences can be very complex, and can contain many different parts of speech which implicate many different grammatical rules. Diagramming sentences will help you to make sure every parts of your sentence are grammatically correct, and provides you with more comprehensive understanding of the English Language. A Sentence Diagram displays the parts of a sentence as a diagram in order to show the relationship of words and groups of words within the sentence. Sentence Diagram shows the relationship between the proposal of its parts. This is a good way to teach grammar! Sentence Diagram helps to make the writing more coherent as well as more interesting to read. ConceptDraw PRO allows you to create clear sentence diagrams using the special templates and vector stencils library.
 Organizational Charts
Organizational Charts solution extends ConceptDraw PRO software with samples, templates and library of vector stencils for drawing the org charts.
HelpDesk
How to Draw a Divided Bar Chart in ConceptDraw PRO
A divided bar graph is a rectangle divided into smaller rectangles along its length in proportion to the data. Segments in a divided bar represent a set of quantities according to the different proportion of the total amount. A divided bar diagram is created using rectangular bars to depict proportionally the size of each category. The bars in a divided bar graph can be vertical or horizontal. The size of the each rectangle displays the part that each category represents. The value of the exact size of the whole must be known, because the each section of the bar displays a piece of that value. A divided bar diagram is rather similar to a sector diagram in that the bar shows the entire data amount and the bar is divided into several parts to represent the proportional size of each category. ConceptDraw PRO in conjunction with Divided Bar Diagrams solution provides tools to create stylish divided bar charts for your presentations.- The Use Of Bubble Diagrams In Making A Flow Chart
- Basic Flowchart Symbols and Meaning | Bubble diagrams in ...
- Difference Between A Flow Chat And A Bubble Diagram
- Bubble Diagram And Functional Flowchart
- Use Flow Chat Find Quadratic Equation
- Flow Of Bubble Diagram
- Types of Flowchart - Overview | Processing Flow Chart | Bubble ...
- Flow chart Example . Warehouse Flowchart | Flow Chat And Bobble ...
- Mechanical Engineering Drawing Symbols Chat Free Download
- Bubble Diagrams | CAD Drawing Software for Making Mechanic ...
- Process Flowchart | Organizational Structure | Process Flow Chart ...
- Basic Flowchart Symbols and Meaning | Sample Of A Flow Water Chat
- Flow Chat Of Policy Management In Tqm
- Write A Program And Draw A Flow Chat To Compute Quadratic
- Process Flowchart | Cross-Functional Flowchart | Sales Process ...
- Process Flowchart | Flow chart Example . Warehouse Flowchart ...
- Flow chart Example . Warehouse Flowchart | Process Flowchart ...
- Types of Flowcharts | Process Flowchart | Bubble diagrams in ...
- Definition TQM Diagram | Quality Management System ...

