HelpDesk
How to Use the Effort-Driven Scheduling Method
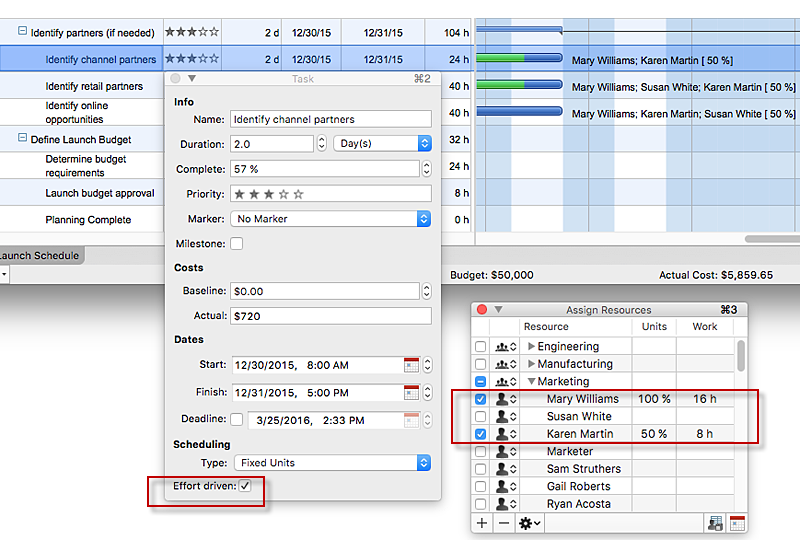
Effort-driven scheduling is the default method of project scheduling in ConceptDraw PROJECT.Flow chart Example. Warehouse Flowchart
Warehouse Flowcharts are various diagrams that describe the warehousing and inventory management processes on the warehouses. Typical purposes of Warehouse Flowcharts are evaluating warehouse performance, measuring efficiency of customer service and organizational performance. This type of Workflow diagrams can be used for identifying any disconnection between business activities and business objectives. They are effectively used by warehouse-related people and organizations, manufacturers, wholesalers, exporters, importers, transporters, and others. Standard Warehousing process flow diagram and standard Workflow diagram are used for process identification for further evaluating effectiveness and profitability of overall business process. Use the ConceptDraw PRO vector graphic software extended with Flowcharts solution to design your own professional-looking Workflow diagrams and Flowcharts of any types, including the Warehouse flowchart, Process flow diagrams which depict in details all steps of Warehouse packages flow. Microsoft Visio, designed for Windows users, can’t be opened directly on Mac. But fortunately, there are several Visio alternatives for Mac which will help Mac users to work Visio files. With ConceptDraw PRO, you may open, edit and save files in Visio format.
HelpDesk
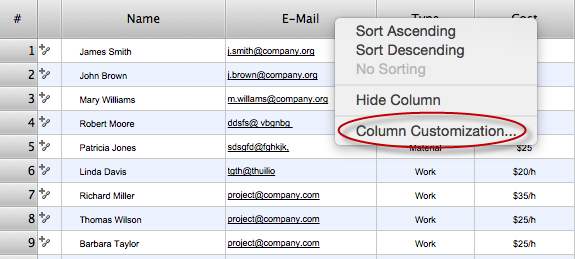
How to Determine what Information to be Displayed in the Project Resource List
After you create a project task list it is necessary move to resource planning. You need to determine and assign resources on each task. There are several types of resources defined in ConceptDraw PROJECT: work, material, cost and equipment. The columns of a project Resource List in ConceptDraw PROJECT displays the information you need to capture about each resource in your project.
Process Flowchart
The main reason of using Process Flowchart or PFD is to show relations between major parts of the system. Process Flowcharts are used in process engineering and chemical industry where there is a requirement of depicting relationships between major components only and not include minor parts. Process Flowcharts for single unit or multiple units differ in their structure and implementation. ConceptDraw PRO is Professional business process mapping software for making Process flowcharts, Process flow diagram, Workflow diagram, flowcharts and technical illustrations for business documents and also comprehensive visio for mac application. Easier define and document basic work and data flows, financial, production and quality management processes to increase efficiency of your business with ConcepDraw PRO. Business process mapping software with Flowchart Maker ConceptDraw PRO includes extensive drawing tools, rich examples and templates, process flowchart symbols and shape libraries, smart connectors that allow you create the flowcharts of complex processes, process flow diagrams, procedures and information exchange. Process Flowchart Solution is project management workflow tools which is part ConceptDraw Project marketing project management software. Drawing charts, diagrams, and network layouts has long been the monopoly of Microsoft Visio, making Mac users to struggle when needing such visio alternative like visio for mac, it requires only to view features, make a minor edit to, or print a diagram or chart. Thankfully to MS Visio alternative like ConceptDraw PRO software, this is cross-platform charting and business process management tool, now visio alternative for making sort of visio diagram is not a problem anymore however many people still name it business process visio tools.
UML Sample Project
Unified Modeling Language (UML) is a graphical modeling language for describing, visualizing, projecting and documenting of object oriented systems. UML digram is used for modeling of organizations and their business processes, for development the big projects, the complex software applications. Comprehensive UML diagram allows to create the set of interrelated documents that gives the complete visual representation of the modeling system.HelpDesk
How to Change the Working Time in a Project
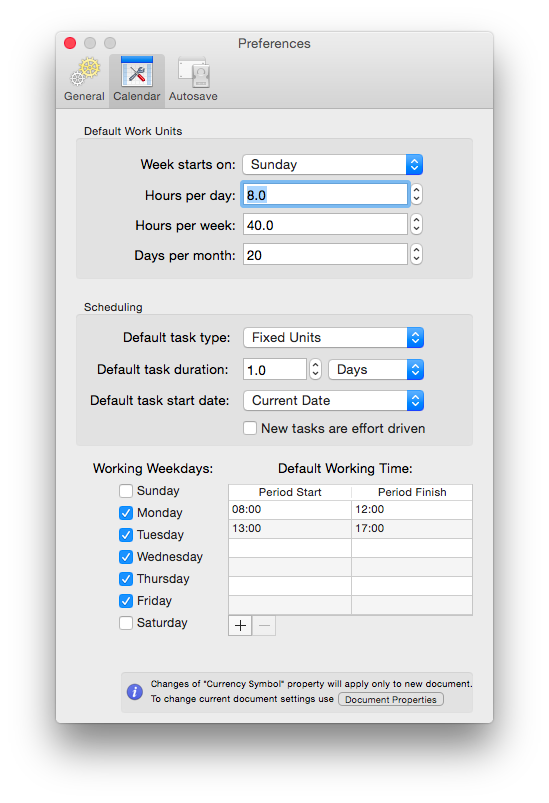
Project calendar determines working and non-working time of the project. It is used as a base to the project schedule development. There two types of project calendars: Project Calendar - which sets the working time for the whole project; and the Resource Calendar- which sets the working time of the particular project resource. The following article describes how to change the default calendar in ConceptDraw PROJECT.HelpDesk
How to Customize a Task’s Duration
When you create an automatically scheduled task, ConceptDraw PROJECT assigns it duration of one day by default. You need modify that duration to reflect the real amount of time that the task requires.Work Order Process Flowchart. Business Process Mapping Examples
The business process is a set of actions or tasks which are undertaken by an organization for production some goods or services, they are then offered for the customers and are ordered by them. Process Flowcharts and Order Process Flowcharts are sufficiently prevalent, well known and actively used in variety of fields of life, business and science. They are constructed using the common standardized symbols, thus are clear and understandable for all. They help effectively represent the processes, determine the order in which the process activities happen, document the order processes, and also effectively analyze the processes with a goal to increase their efficiency. Create your own Process Flowcharts, Order Process Flowcharts, Cross-Functional Flow Charts representing the order processing steps using powerful drawing tools of ConceptDraw PRO software and variety of predesigned vector objects from the libraries of Business Process Mapping Solution from Business Processes area of ConceptDraw Solution Park.HelpDesk
How are Summary Values of Project Phases Calculated
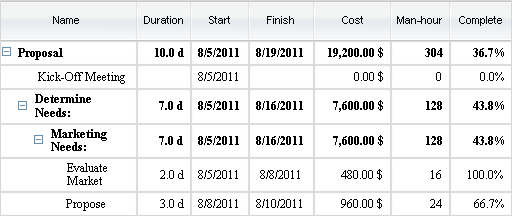
The project schedule usually consists of a list of project tasks joined into project phases. Each task has its own value such as duration, cost, % complete, etc.
 PM Easy
PM Easy solution extends the ConceptDraw PROJECT functionality with an ability to support neutral methodology of project management and to quickly start a project by listing the task relationships and dependencies, that makes the iterative planning much easier. The project management tool and available visual tools, such as mind mapping, increase the effectiveness of tracking and analysis your project tasks. PM Easy solution from ConceptDraw Solution Park is mainly targeted at project managers in small or medium-sized companies, allowing them to make the project plan and execute projects using mind mapping technique, to implement planning using mind mapping, and to track tasks using ConceptDraw PROJECT application.
 PM Agile
PM Agile solution provides powerful tools for project management, project planning and software development, ensuring support of Agile methods, assisting in holding the Scrum-meetings, collaborative planning sprints, maintaining backlog, calculating and reporting the velocity of the team. Intended for the companies using Agile methodology, specifically Scrum, Product Owners, Scrum Masters, software developers, and management specialists, this solution includes examples demonstrating the main principles of Agile methodology and Scrum, and numerous templates specially developed in ConceptDraw DIAGRAM and ConceptDraw MINDMAP applications. All Agile meetings and documents are powered by the mission of adapted Mind Map templates, tuned for collaborative work of development team. The key diagrams for visualization are made in ConceptDraw DIAGRAM.
ConceptDraw PROJECT Project Management Software Tool
ConceptDraw PROJECT is simple project management software. If you are on the fast track in your career and start facing such challenges as coordination many people, coordination tasks and works, manage project with a great deal of time and money involved - it is the right time to get Project management tool involved in your work.HelpDesk
What Information to be Displayed in the ConceptDraw PROJECT Gantt Chart View
What information can can contain the project task list? Gantt Chart view is a graphical representation of a project outline that allows one to allocate tasks.You can customize a project’s tasks list view to include the columns you need to meet your information requirements. The columns of the ConceptDraw PROJECT Gantt view contain the information you want to capture about each task in your project. The following article details what information can be contained in the columns of a project outline:<
- Software Work Flow Process in Project Management with Diagram ...
- Flow chart Example . Warehouse Flowchart | Workflow Diagrams ...
- Sample Project Flowchart. Flowchart Examples | Flowchart ...
- Sample Project Flowchart. Flowchart Examples | Flowchart ...
- Sample Project Flowchart. Flowchart Examples | Software Work ...
- Project Work Flow Chart Template
- Process Flowchart | Sample Project Flowchart. Flowchart Examples ...
- Business Process Reengineering Examples | Software Work Flow ...
- Sample Of A Project Work
- Workflow Diagram Template For Project Update
- UML Sample Project
- Pyramid Diagram | Software Work Flow Process in Project ...
- Dependencies Software Project Management Examples
- Construction Project Chart Examples | Gantt chart examples | How to ...
- How to Report Task's Execution with Gantt Chart | How to Create ...
- How to Create Multple Projects Schedule on Windows | How to ...
- Sample Project Flowchart. Flowchart Examples | Flowchart ...
- Basic Flowchart Symbols and Meaning | Audit Flowchart Symbols ...
- Audit flowchart - Project management process | Software Work Flow ...
- Workflow Diagram | Workflow Diagram Template | Software Work ...


