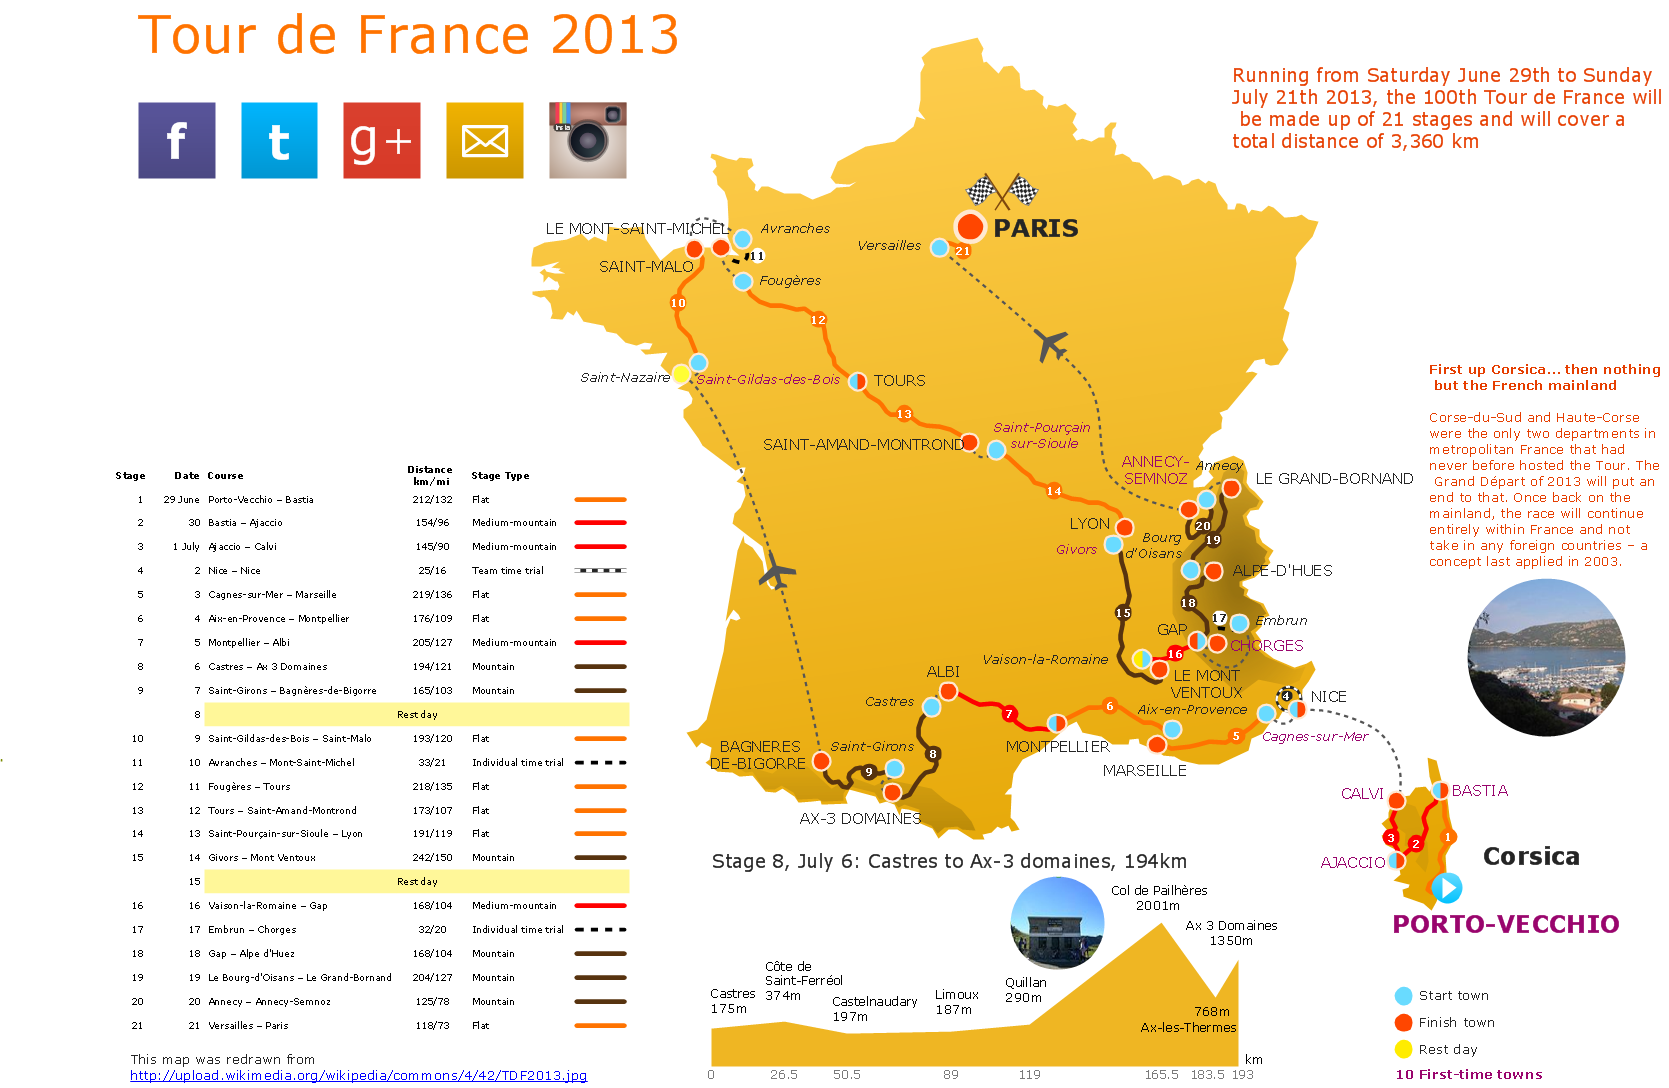
Excellent Examples of Infographic Maps
Create Spatial infographics with ConceptDraw using its excellent examples of infographic maps. We hope these can inspire and teach you!Spatial Data
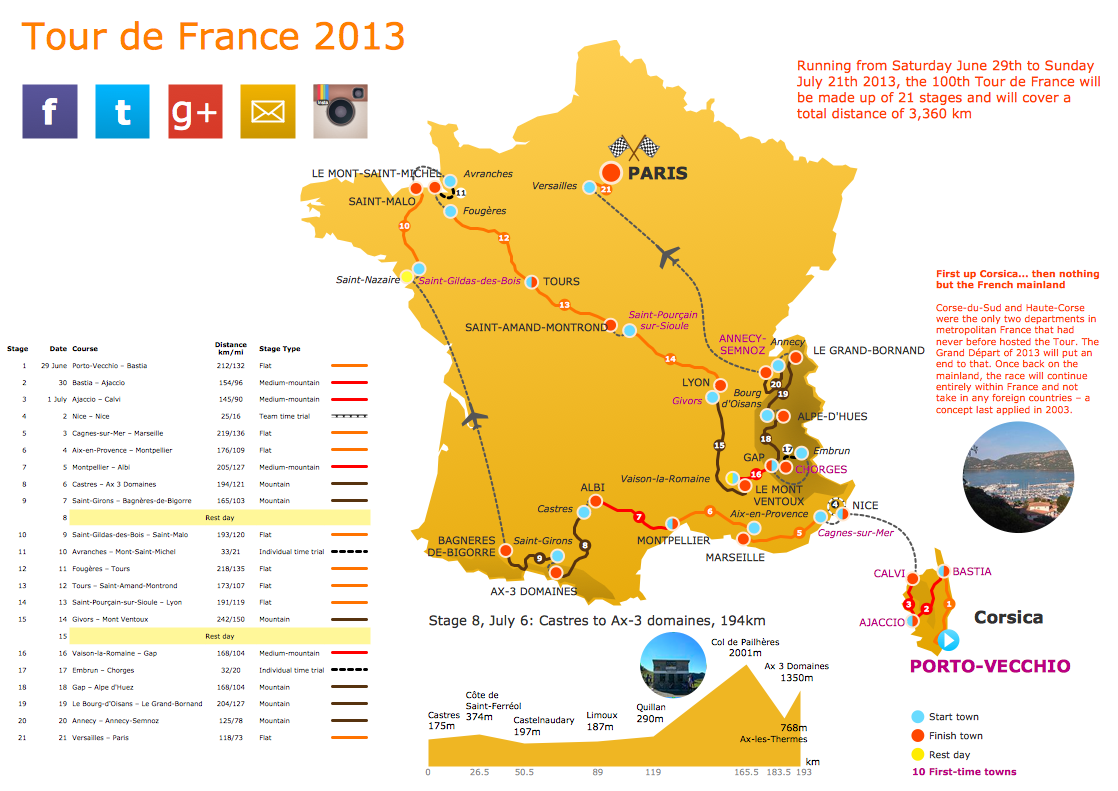
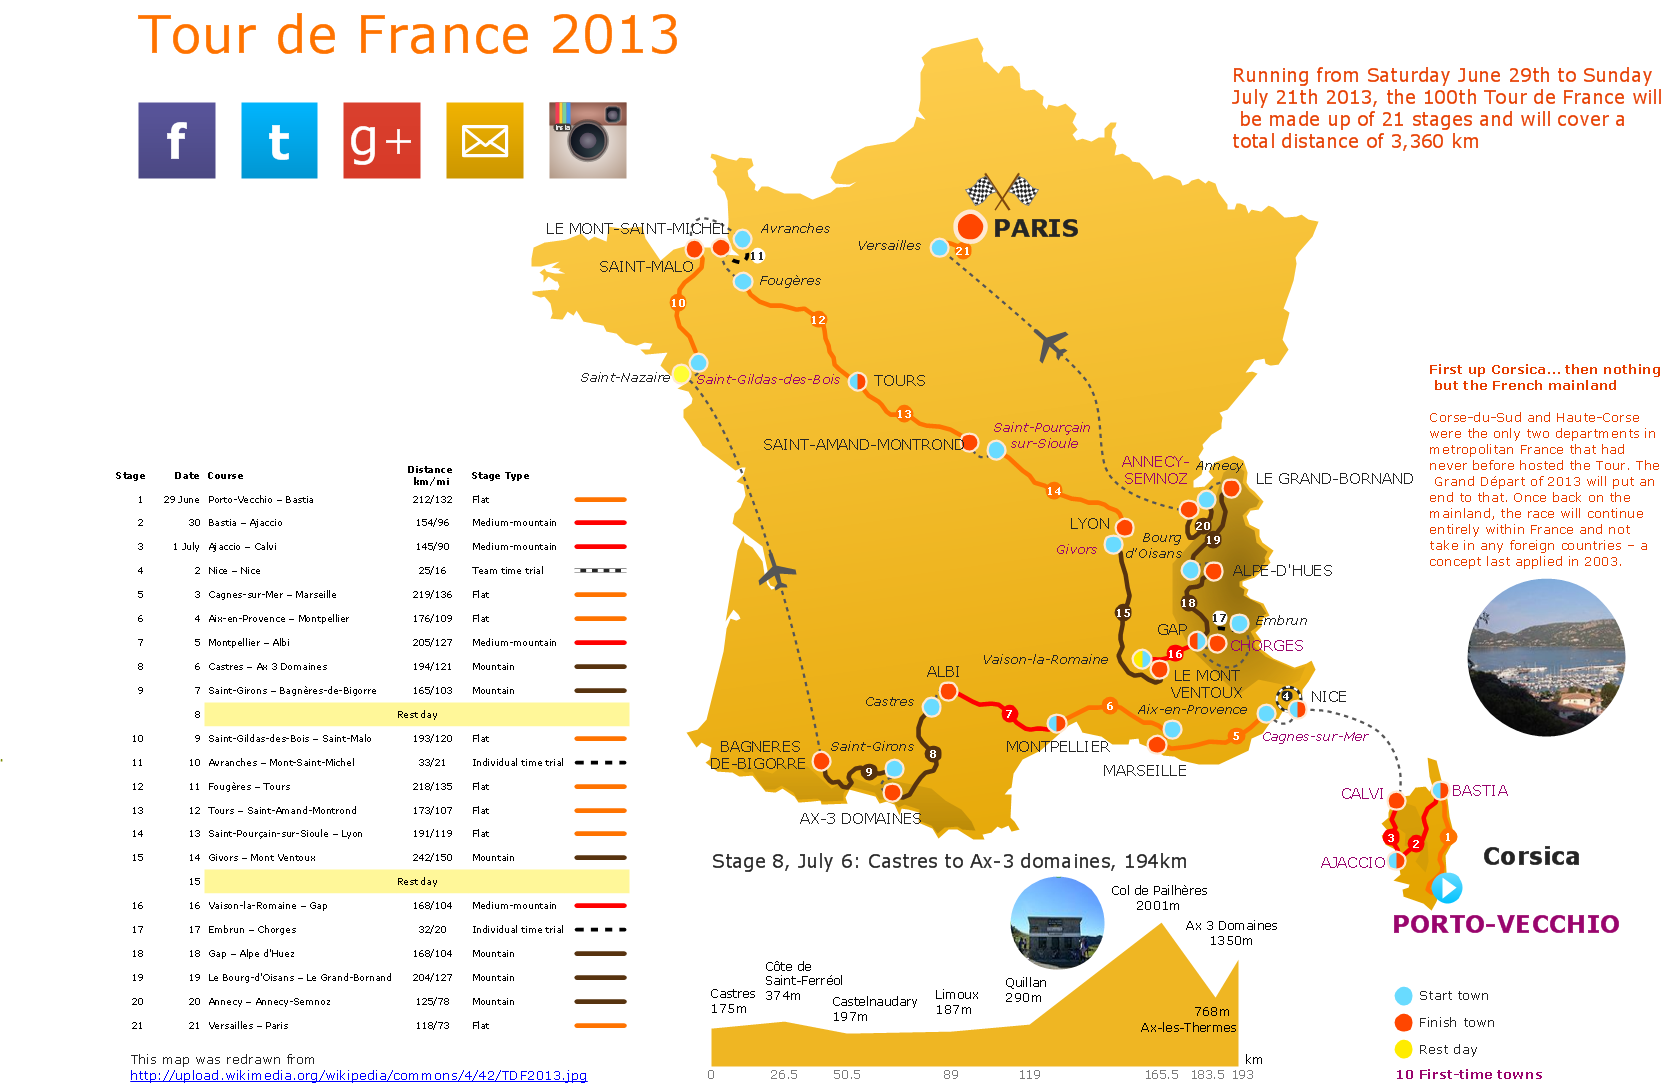
How to represent the spatial data quick and easy? All what you need is a powerful spatial infographic software. Never before creation of Spatial Infographics wasn’t so easy as now with Spatial Infographics Solution from the “What are Infographics” Area for ConceptDraw Solution Park.Geospatial Data
Effective spatial infographics design, easy geospatial data presenting, now it is reality thanks to the extensive drawing tools of the Spatial Infographics Solution included in “What are Infographics” Area of ConceptDraw Solution Park.Spatial Data Analysis
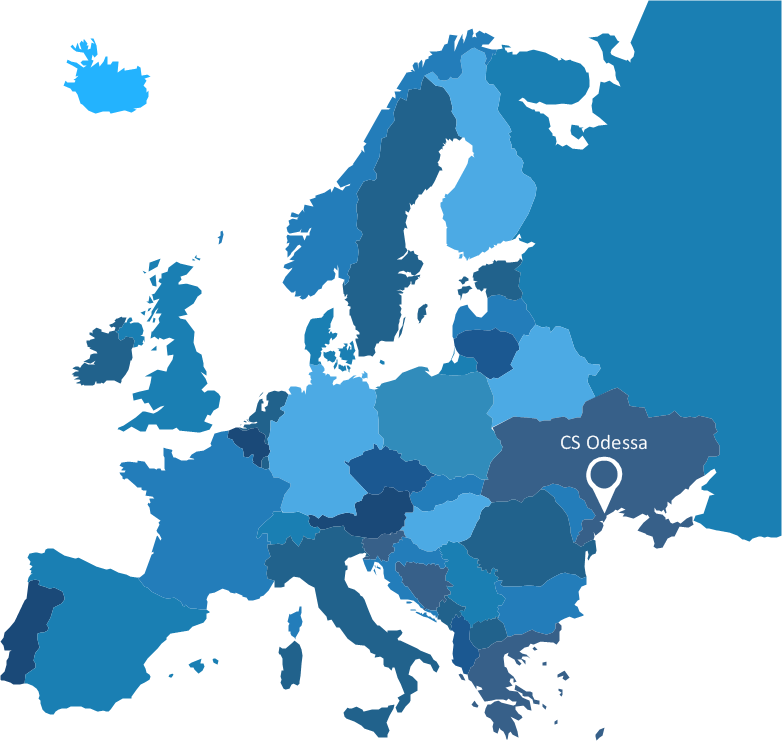
ConceptDraw PRO diagramming and vector drawing software extended with Pictorial Infographics Solution from the “What are Infographics” Area is the best for Spatial Data Analysis. You have a perfect possibility to make sure this right now.Visualization Spatial Data Using Thematic Maps Combined with Infographics
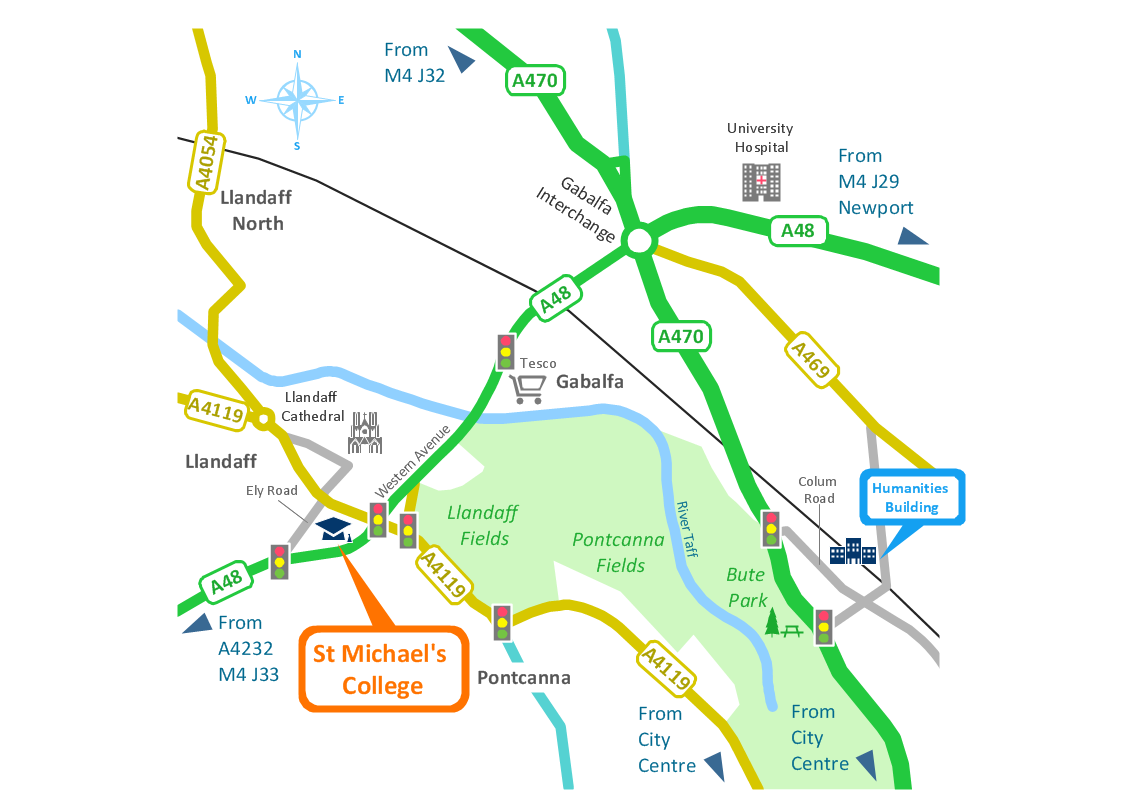
Now anyone can build an infographics from their data using ConceptDraw. Nice and simple, but the features it have are power-packed!Brilliant Examples of Infographics Map, Transport, Road
ConceptDraw PRO contains spatial infographics samples, map templates to be filled in, and libraries of vector stencils for main design elements of spatial infographics.Spatial Infographics
Not everyone can make spatial infographics from scratch, ConceptDraw will help you to create your own infographics.Superb Examples of Infographic Maps
Great examples of Infographic Maps, they are needed for inspiration.Tools to Create Your Own Infographics
Over the past few centuries, data visualization has evolved so much that we use it every day in all areas of our lives. Many believe that infographic is an effective tool of storytelling, as well as analytics, and that it is able to overcome most of the language and educational barriers. Understanding the mechanisms of human perception will help you to understand how abstract forms and colors used in data visualization can transmit information more efficient than long paragraphs of text.Best Tool for Infographic Construction
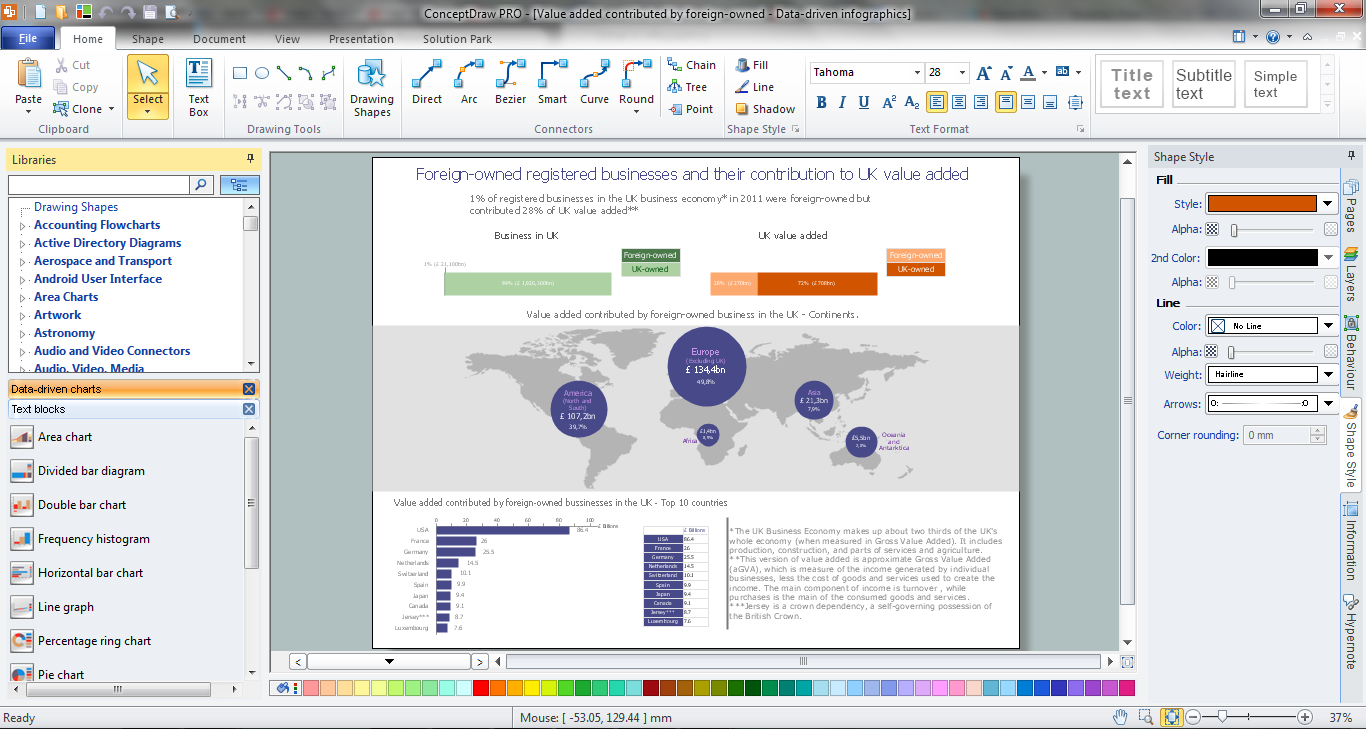
ConceptDraw is a best data visualization tool that will allow everyone to create rich infographics and visualizations quickly and easily.Infographic Tools
ConceptDraw PRO diagramming and vector drawing software offers the best infographic tools - Data-driven Infographics Solution from the “What are Infographics” Area of ConceptDraw Solution Park.Travel Infographics
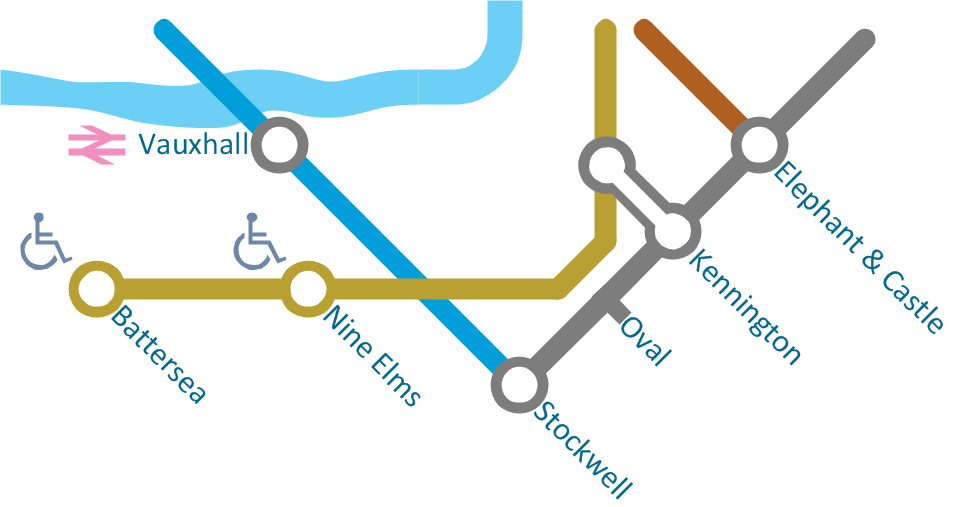
Creating Travel infographics is super-easy with ConceptDraw.Transportation Infographics
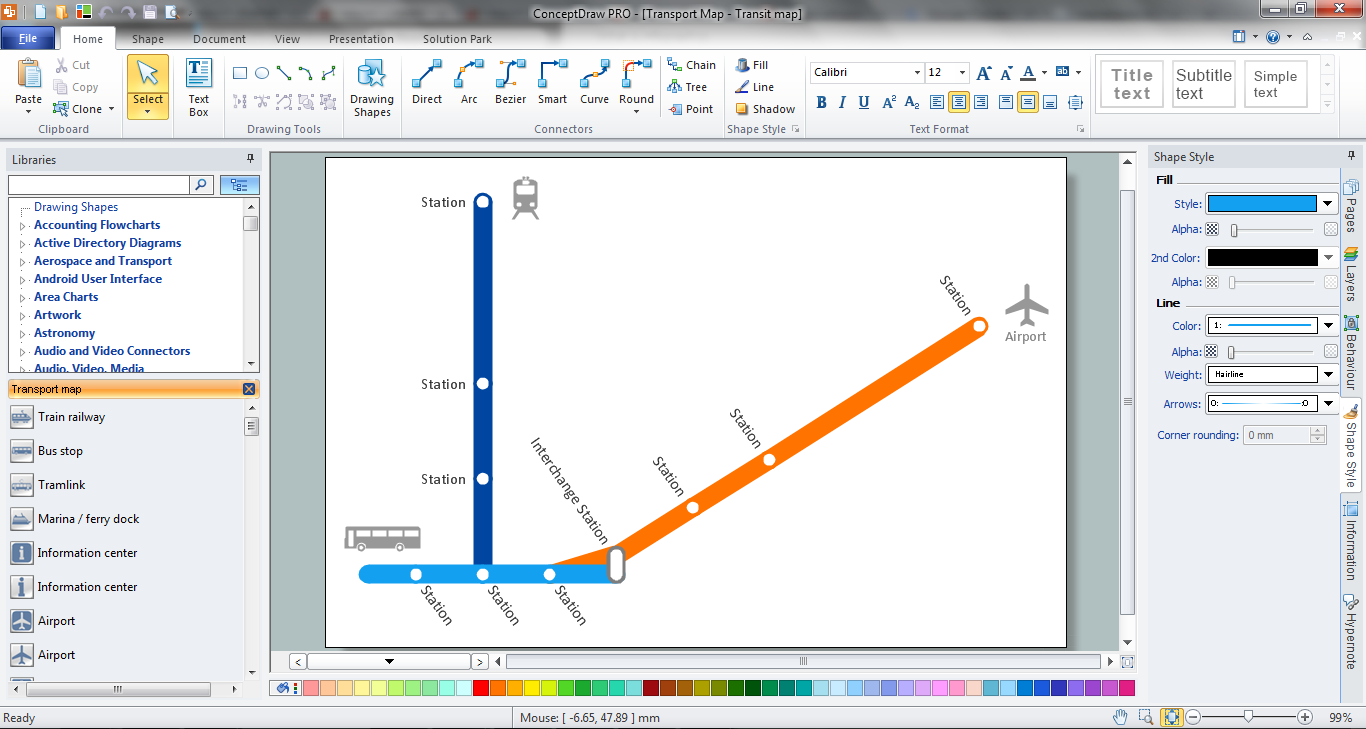
ConceptDraw is a visualization Software for making transportation infographics. Infographics design vector elements and vector graphics which will surely help you in your design process.Map Infographic Maker
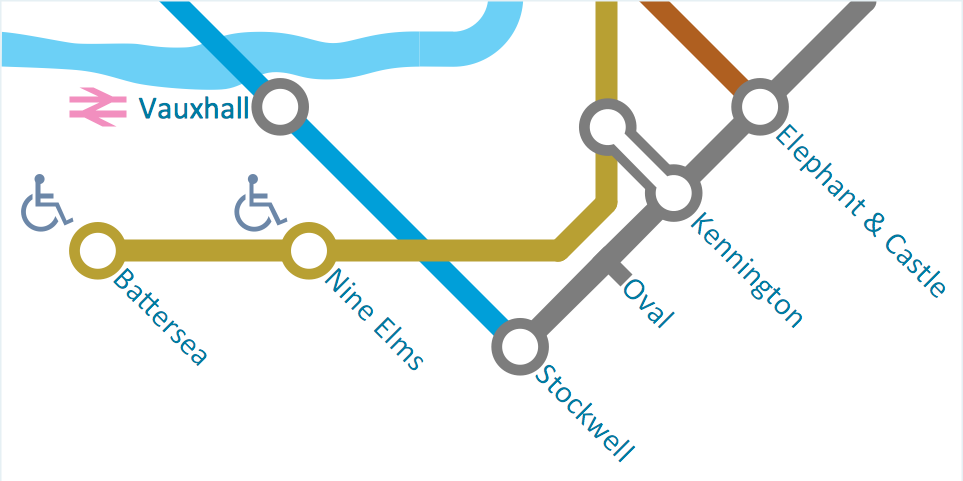
Take inspiration with ConceptDraw to visualise your maps and make eye-catching infographics.Map Infographic Design
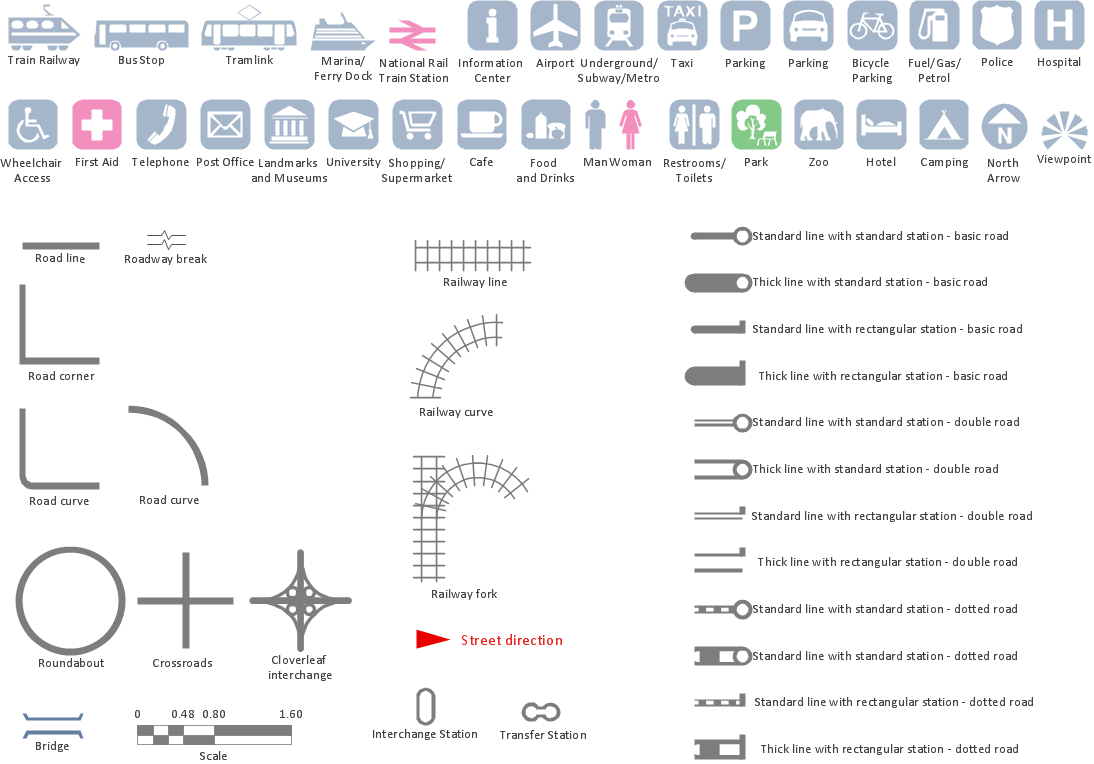
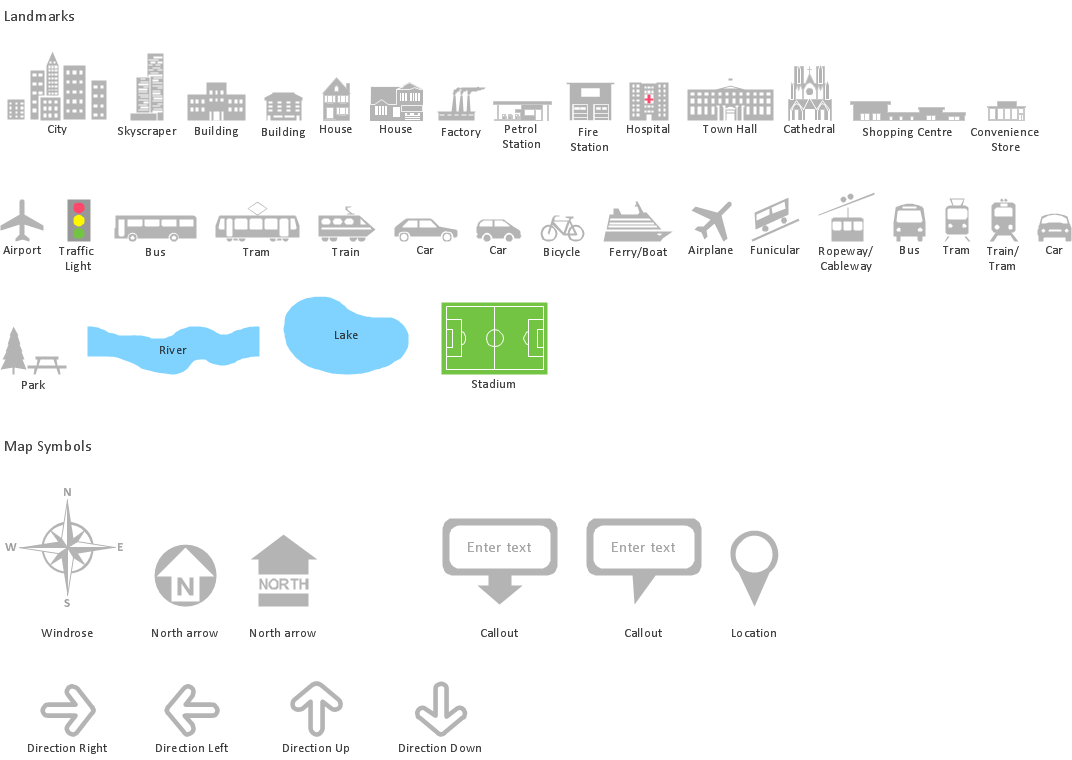
ConceptDraw collection of vector elements for infographics design.- Excellent Examples of Infographic Maps | Visualization Spatial Data ...
- Spatial Infographics | Transportation Infographics | Visualization ...
- Spatial Data Analysis | ConceptDraw Solution Park | Spatial ...
- Spatial Data Analysis | Informative and Well-Designed Infographics ...
- Data Visualization Software Solutions | Visualization Spatial Data ...
- Geospatial Data | Spatial Infographics | Spatial Data | The Spatial ...
- Flowchart of Products. Flowchart Examples | Business Process ...
- Process Flowchart | Business Diagram Software | Spatial Data ...
- Spatial Infographics | Spatial Infographics | Map Infographic Design ...
- Spatial Data Analysis | How to Draw Pictorial Chart. How to Use ...
- Spatial Data Analysis | Flowchart Definition | Flowchart of Products ...
- Map Infographic Maker | Spatial infographics Design Elements ...
- Visualization Spatial Data Using Thematic Maps Combined with ...
- Spatial Infographics | Spatial Dashboard | Tools to Create Your Own ...
- Visualization Spatial Data Using Thematic Maps Combined with ...
- Process Flowchart | Spatial Data Analysis | Types of Welding in ...
- Typography Infographic Examples | Examples of Infographics ...
- Technical drawing - Machine parts assembling | Spatial Data ...
- Map Infographic Creator | Spatial infographics Design Elements ...
- Process Flowchart | Spatial infographics Design Elements: Location ...

