"Causes in the diagram are often categorized, such as to the 6 M's ...
The 6 Ms (used in manufacturing industry):
(1) Machine (technology);
(2) Method (process);
(3) Material (Includes Raw Material, Consumables and Information.);
(4) Man Power (physical work)/ Mind Power (brain work): Kaizens, Suggestions;
(5) Measurement (Inspection);
(6) Milieu/ Mother Nature (Environment).
The original 6Ms used by the Toyota Production System have been expanded by some to include the following and are referred to as the 8Ms. However, this is not globally recognized. It has been suggested to return to the roots of the tools and to keep the teaching simple while recognizing the original intent; most programs do not address the 8Ms.
(7) Management/ Money Power;
(8) Maintenance." [Ishikawa diagram. Wikipedia]
This 8Ms Ishikawa diagram (manufacturing cause and effect diagram) template is included in the Fishbone Diagram solution from the Management area of ConceptDraw Solution Park.
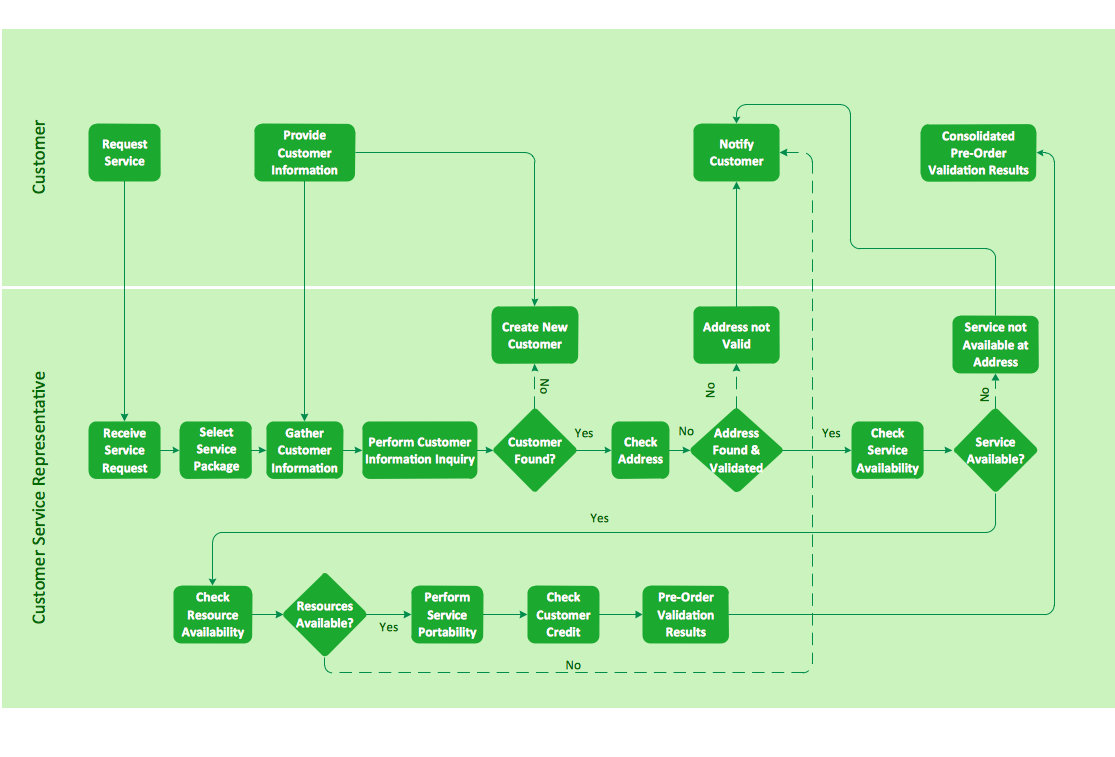
Cross-Functional Flowchart Basics
Don't let your first glance fool you. ConceptDraw is a lot easier to use than it looks. Use its cross-functional templates and library as basics to get started. All you need to know are a few basic steps and terms. ConceptDraw Arrows10 Technology is a new age in drawing software. Use it for process flows and its new rapid draw feature enables to draw an impressive charts in a seconds.ConceptDraw Arrows10 Technology
How should diagramming software work? The answer is - Fast and easy. "Tree"- mode drawing works like that. Just select objects in your drawing and press Tree or Chain button to connect all of them just in one click. Your diagram looks professional and it took only a moment to draw.ConceptDraw Arrows10 Technology
Connecting objects manually in ConceptDraw PRO is a snap: - points; - Connecting groups of objects; - Auto-routing; - Connectors text; - Snap to Guides ; - Quick.ConceptDraw Arrows10 Technology
How should diagramming software work? Is it possible to develop a diagram as quickly as the ideas come to you? The innovative ConceptDraw Smart Connectors Technology - This is more than enough versatility to draw any type of diagram with any degree of complexity. Connection points are necessary for diagramming network, flowchart and organizational charts. In ConceptDraw you connect shapes by attaching, or snapping and gluing, connectors to shape connection points.Cross-functional flowchart landscape, U.S. units
In Cross-Functional Flowchart first step is to determine how many lanes you want to represent and what the lane titles will be. The choice of vertical or horizontal swim lanes landscape comes down to personal choice or just plain “what fits best”. With ConceptDraw, we make that simple by including different swim lanes templates. Professional looking examples and templates of Swimlane Flowchart which help you create Cross Functional Flowcharts rapidly.- Explain The 8ms In Production Management
- How Do Fishbone Diagrams Solve Manufacturing Problems | Cause ...
- Data Flow Diagram Model | Process Flowchart | Manufacturing 8 Ms ...
- Process Flowchart | Manufacturing 8 Ms fishbone diagram ...
- Production Management Digram
- 4 Ms fishbone diagram - Production process | Manufacturing 8 Ms ...
- 4 Ms fishbone diagram - Production process | Defensive Formation ...
- Data Flow Diagram Model | Process Flowchart | Manufacturing 8 Ms ...
- With The Aid Of Diagram Explain Production Management
- With The Aid Of Diagram Explain 4 Ms Of Management
- Explain Production System Model With Diagram Example
- Production Management Process Diagram
- With The Aid Of Diagram Discuss Production Management
- With The Aid Of A Diagram Explain The Ms Of Management
- 8 Ms In Management Explained
- Prosess Of Production System Flow Chart
- Illustrate The Eight Ms Of Management
- With The Aid Of Diagram Explain The Modelling Process Of Any ...
- Simple Diagram Of Production System
- Service 8 Ps fishbone diagram - Template | Create Fishbone ...


