ConceptDraw DIAGRAM Compatibility with MS Visio
For those who are migrating from MS Visio to ConceptDraw DIAGRAM, or for those who have colleagues and clients who use Visio, ConceptDraw DIAGRAM is compatible with MS Visio.VSDX formatted files.VSDX is Visio’s open XML file format, and it can be easily imported and exported by ConceptDraw DIAGRAM.Block Diagram
The vector stencils libraries: Block Diagrams, Blocks with Perspective, Callouts, Connectors, Raised Blocks from the solution Block Diagrams contain specific block diagram symbols such as arrows, input/output symbols, start/end symbols, processing symbols, conditional symbols, commenting symbols, callouts, connectors, etc. for ConceptDraw DIAGRAM diagramming and vector drawing software. The Block Diagrams solution is contained in a "Diagrams" area of ConceptDraw Solution Park.Use the libraries from the Block Diagrams solution to draw block diagrams for your business documents, presentations and websites in a few minutes.
Project Exchange
This solution extends ConceptDraw PROJECT and ConceptDraw MINDMAP software with the ability to import and export project data.
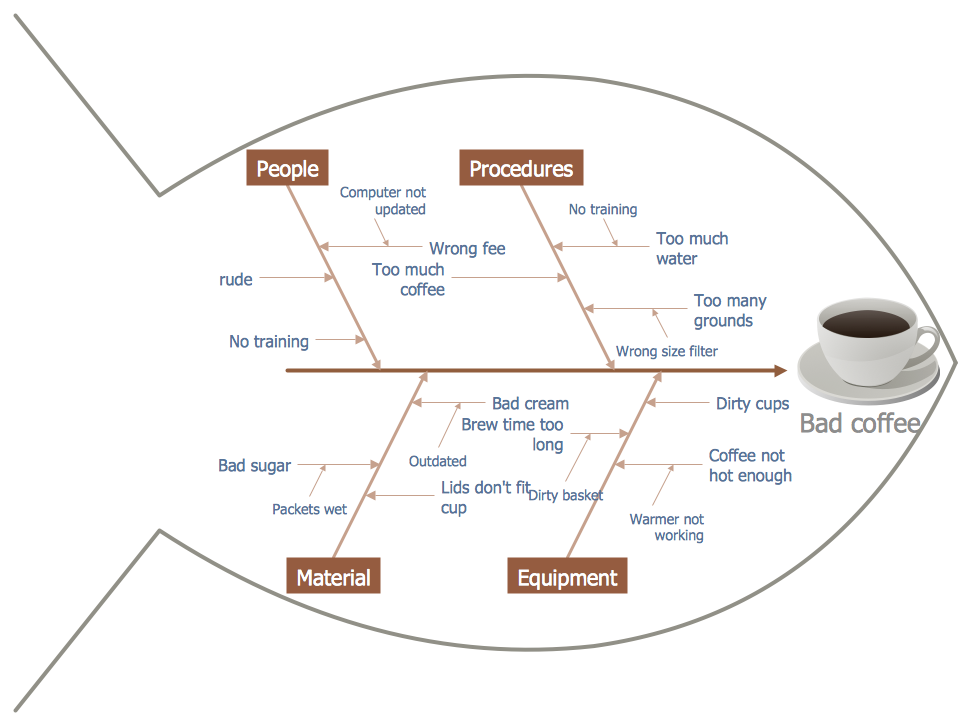
TQM Diagram Example
The Total Quality Management Diagram solution helps you and your organization visualize business and industrial processes. Create Total Quality Management diagrams for business process with ConceptDraw software.Total Quality Management Definition
Total quality management is the one known to be consisting of some organization-wide efforts put in order to install and to make some climate in which this organization can continuously improve its ability to deliver the high-quality products and services to its customers permanently.How to Make a Timeline
Timeline is a type of diagram which illustrates the series of events in a chronological order on a linear timescale. How to make a timeline? It is convenient to use a modern powerful software. ConceptDraw DIAGRAM diagramming and vector drawing software extended with Timeline Diagrams solution from the Management area is exactly what you need.Cause and Effect Diagram
ConceptDraw DIAGRAM software extended with Fishbone Diagrams solution from the Management area of ConceptDraw Solution Park is perfect for Cause and Effect Diagram creating. It gives the ability to draw fishbone diagram that identifies many possible causes for an effect or a problem. Causes and Effects are usually grouped into major categories to identify these sources of variation. Causes and Effects in the diagram show relationships among various factor. Fishbone diagram shows factors of Equipment, Process, People, Materials, Environment and Management, all affecting the overall problem.Ishikawa Diagram
In almost every sphere of life and work the people time to time are faced with the fact that on their way there are certain obstacles and problems. But it is not always possible to identify the true cause of particular problem. To understand the basic causes of problems and eliminate them, it is convenient to use the chart of Kaoru Ishikawa - the technique specially designed for this.ConceptDraw DIAGRAM diagramming and vector drawing software extended with Fishbone Diagrams solution from the Management area can help you with construction the Fishbone Diagram also known as Ishikawa Diagram.
Ishikawa Diagram shows factors of Equipment, Process, People, Materials, Environment and Management, all affecting the overall problem in one drawing for the further analysis. It is a well effective way to analyze the business problems you must identify and solve.
HelpDesk
How to Convert a Mind Map into MS Project XML
The easiest way to start this project is to conduct a brainstorm session that identifies necessary tasks, then prepare a project schedule in the form of a Gantt chart and assign resources to tasks. With ConceptDraw MINDMAP, you can initiate a project using a mind map to represent all critical and important tasks. ConceptDraw MINDMAP supports a mind map export to MS Project; it also allows import a project file from MS Project giving team members who use macOS or Windows a working visual map of a planned project.Affinity Diagram
The affinity diagram is a business tool used to organize ideas and data. It is one of the Seven Management and Planning Tools. But how design the Affinity Diagram quick and easy? ConceptDraw DIAGRAM diagramming and vector drawing software offers the Seven Management and Planning Tools Solution from the Management Area.SWOT Matrix Template
A SWOT analysis can be carried out for a product, place, industry or person. It involves specifying the objective of the business venture or project and identifying the internal and external factors that are favorable and unfavorable to achieving that objective.Fishbone Diagram
Fishbone Diagram is another name for the Cause and Effect Diagram or the Ishikawa Diagram which got its name from the fact that it looks like a fish skeleton. Developed by Kaoru Ishikawa in 1968, a Fishbone Diagram is effectively used for a cause and effect analysis which allows to consider all possible causes for a certain problem or event.ConceptDraw DIAGRAM supplied with Fishbone Diagrams solution from the Management area is the best software for fast and easy drawing professional looking Fishbone Diagram.
HelpDesk
How to Export Project Data to MS Excel Worksheet
You can share your ConceptDraw PROJECT files with colleagues who use MS Excel®using the export capabilities of the PROJECT.Cause and Effect Diagrams
Cause and Effect Diagrams are designed to identify the potential factors that cause an overall effect. The causes are grouped into the categories, each cause is a source of variation.ConceptDraw DIAGRAM powerful diagramming and vector drawing software provides the Fishbone Diagrams solution from the Management area of ConceptDraw Solution Park that allows to design the Cause and Effect Diagrams quick, easy and effective.
Cause and Effect Fishbone Diagram
Cause and Effect Fishbone Diagram is one of the popular productivity and management tools widely used in business organizations. It is also known as Fishbone Diagram, because it looks like a fish skeleton. Cause and Effect Diagram provides a structured way which helps to identify all possible causes of a problem. Cause and Effect Diagram can be applied anywhere where exists a causal relationship.Now the problem of complexity the Cause and Effect Fishbone Diagram creating is solved thanks to the ConceptDraw DIAGRAM diagramming and vector drawing software extended with Fishbone Diagrams solution from the Management area.
- Import And Export Management System Er Diagram
- Activity Diagram For Import Export Management System
- Automated payroll management system UML activity diagram ...
- Import Export Management Project Flow Diagram
- Er Diagram For Import Export Management Free Download Pdf
- Diagrams Shows How An Export Management Company Export
- Import process - Flowchart
- Quality | Fishbone Diagram | MindWave for SAP Streamworks | Sap ...
- Activity Diagram For Bank Management System
- Dfd Diagram For Export System Project
- Use Case And Er Diagrams For Online Bank Management System
- Process Flowchart | Block Diagrams | How To use House Electrical ...
- ConceptDraw PRO Compatibility with MS Visio | UML Diagrams with ...
- Flowchart Software | Flowchart - Import process | Basic Diagramming
- Diagram Of Export Pricing
- Sequence Diagrams For Restaurant Management System
- TQM Diagram Example | How To Convert a Business Process ...
- Mind Map Exchange | Management | Note Exchange | Maps P
- Dfd Of Import And Export Sys
- Data Flow Diagrams For Export Import System
- ERD | Entity Relationship Diagrams, ERD Software for Mac and Win
- Flowchart | Basic Flowchart Symbols and Meaning
- Flowchart | Flowchart Design - Symbols, Shapes, Stencils and Icons
- Flowchart | Flow Chart Symbols
- Electrical | Electrical Drawing - Wiring and Circuits Schematics
- Flowchart | Common Flowchart Symbols