Process Flowchart
The main reason of using Process Flowchart or PFD is to show relations between major parts of the system. Process Flowcharts are used in process engineering and chemical industry where there is a requirement of depicting relationships between major components only and not include minor parts. Process Flowcharts for single unit or multiple units differ in their structure and implementation. ConceptDraw PRO is Professional business process mapping software for making Process flowcharts, Process flow diagram, Workflow diagram, flowcharts and technical illustrations for business documents and also comprehensive visio for mac application. Easier define and document basic work and data flows, financial, production and quality management processes to increase efficiency of your business with ConcepDraw PRO. Business process mapping software with Flowchart Maker ConceptDraw PRO includes extensive drawing tools, rich examples and templates, process flowchart symbols and shape libraries, smart connectors that allow you create the flowcharts of complex processes, process flow diagrams, procedures and information exchange. Process Flowchart Solution is project management workflow tools which is part ConceptDraw Project marketing project management software. Drawing charts, diagrams, and network layouts has long been the monopoly of Microsoft Visio, making Mac users to struggle when needing such visio alternative like visio for mac, it requires only to view features, make a minor edit to, or print a diagram or chart. Thankfully to MS Visio alternative like ConceptDraw PRO software, this is cross-platform charting and business process management tool, now visio alternative for making sort of visio diagram is not a problem anymore however many people still name it business process visio tools.
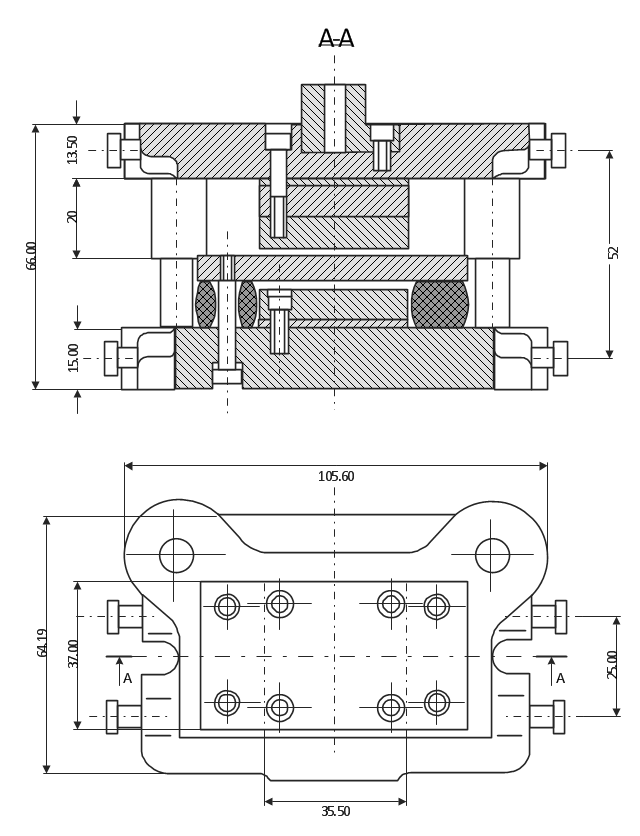
This technical drawing shows the machine parts assembly using joining by threaded fasteners.
"Assembling (joining of the pieces) is done by welding, binding with adhesives, riveting, threaded fasteners, or even yet more bending in the form of a crimped seam. Structural steel and sheet metal are the usual starting materials for fabrication, along with the welding wire, flux, and fasteners that will join the cut pieces. As with other manufacturing processes, both human labor and automation are commonly used. The product resulting from fabrication may be called a fabrication. Shops that specialize in this type of metal work are called fab shops. The end products of other common types of metalworking, such as machining, metal stamping, forging, and casting, may be similar in shape and function, but those processes are not classified as fabrication." [Metal fabrication. Wikipedia]
This mechanical engineering drawing example was designed using ConceptDraw PRO diagramming and vector drawing software extended with Mechanical Engineering solution from Engineering area of ConceptDraw Solution Park.
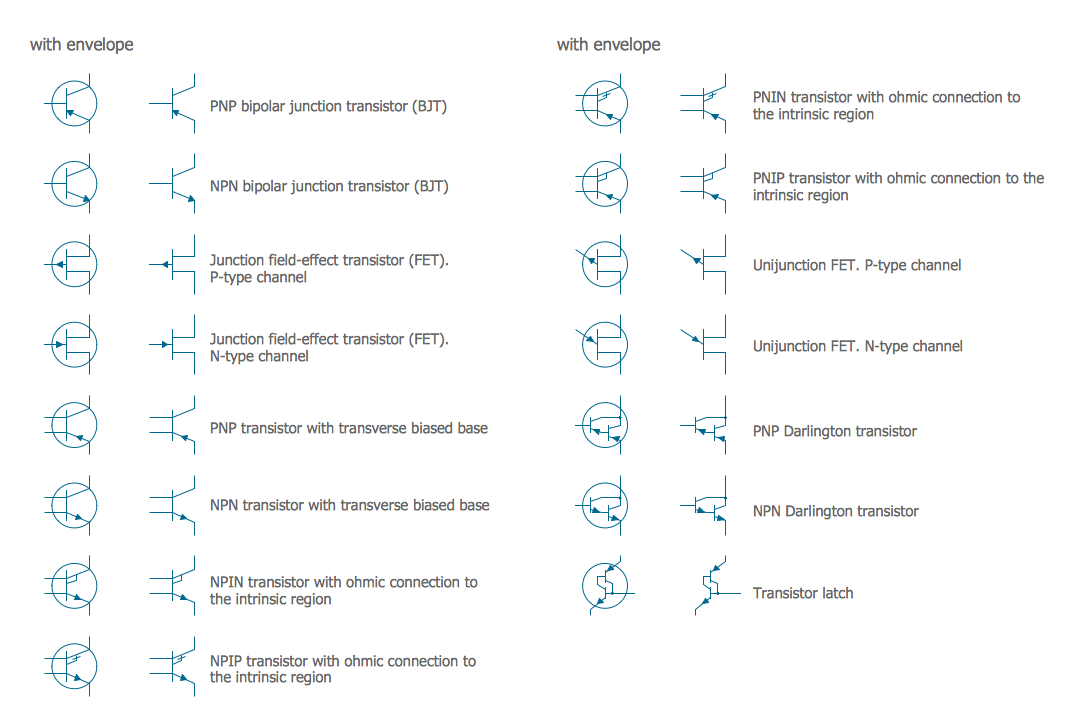
Electrical Symbols — Transistors
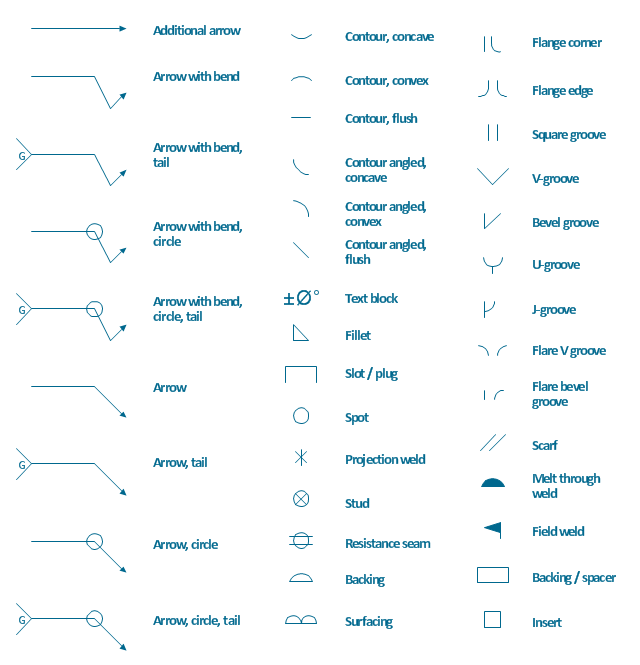
A transistor is a semiconductor device used to amplify or switch electronic signals and electrical power. It is composed of semiconductor material usually with at least three terminals for connection to an external circuit. A voltage or current applied to one pair of the transistor's terminals changes the current through another pair of terminals. Because the controlled (output) power can be higher than the controlling (input) power, a transistor can amplify a signal. Today, some transistors are packaged individually, but many more are found embedded in integrated circuits. 26 libraries of the Electrical Engineering Solution of ConceptDraw PRO make your electrical diagramming simple, efficient, and effective. You can simply and quickly drop the ready-to-use objects from libraries into your document to create the electrical diagram.The vector stencils library "Welding" contains 38 welding joint symbols to identify fillets, contours, resistance seams, grooves, surfacing, and backing.
Use it to indicate welding operations on working drawings.
"Welding is a fabrication or sculptural process that joins materials, usually metals or thermoplastics, by causing coalescence. This is often done by melting the workpieces and adding a filler material to form a pool of molten material (the weld pool) that cools to become a strong joint, with pressure sometimes used in conjunction with heat, or by itself, to produce the weld. This is in contrast with soldering and brazing, which involve melting a lower-melting-point material between the workpieces to form a bond between them, without melting the workpieces.
Many different energy sources can be used for welding, including a gas flame, an electric arc, a laser, an electron beam, friction, and ultrasound.
Welds can be geometrically prepared in many different ways. The five basic types of weld joints are the butt joint, lap joint, corner joint, edge joint, and T-joint (a variant of this last is the cruciform joint). Other variations exist as well - for example, double-V preparation joints are characterized by the two pieces of material each tapering to a single center point at one-half their height. Single-U and double-U preparation joints are also fairly common - instead of having straight edges like the single-V and double-V preparation joints, they are curved, forming the shape of a U. Lap joints are also commonly more than two pieces thick - depending on the process used and the thickness of the material, many pieces can be welded together in a lap joint geometry." [Welding. Wikipedia]
The shapes example "Design elements - Welding" was created using the ConceptDraw PRO diagramming and vector drawing software extended with the Mechanical Engineering solution from the Engineering area of ConceptDraw Solution Park.
Bar Diagrams for Problem Solving. Create manufacturing and economics bar charts with Bar Graphs Solution
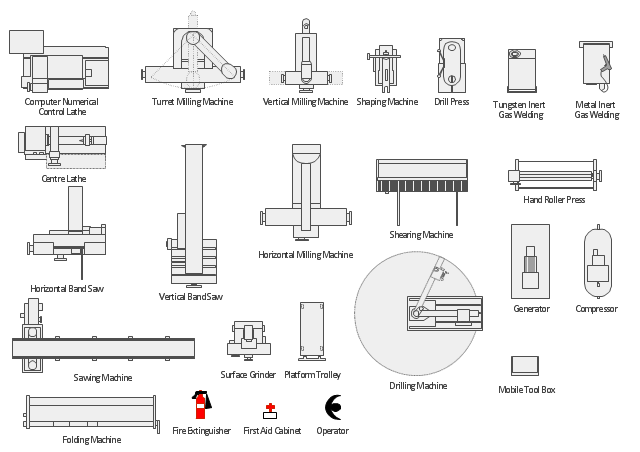
Create bar charts for visualizing problem solving in manufacturing and economics using the ConceptDraw PRO diagramming and vector drawing software extended with the Bar Graphs Solution from the Graphs and Charts area of ConceptDraw Solition Park.The vector stencils library "Machines and equipment" contains 24 symbols of industrial machines and equipment.
Use the design elements library "Machines and equipment" for drawing plant interior design plans, manufacturing equipment layouts and factory floor plans using the ConceptDraw PRO diagramming and vector drawing software.
"Manufacturing is the production of goods for use or sale using labor and machines, tools, chemical and biological processing, or formulation. The term may refer to a range of human activity, from handicraft to high tech, but is most commonly applied to industrial production, in which raw materials are transformed into finished goods on a large scale.
Modern manufacturing includes all intermediate processes required for the production and integration of a product's components. Some industries, such as semiconductor and steel manufacturers use the term fabrication instead.
The manufacturing sector is closely connected with engineering and industrial design." [Manufacturing. Wikipedia]
The shapes library "Machines and equipment" is included in the Plant Layout Plans solution from the Building Plans area of ConceptDraw Solution Park.
Cross Functional Flowchart Examples
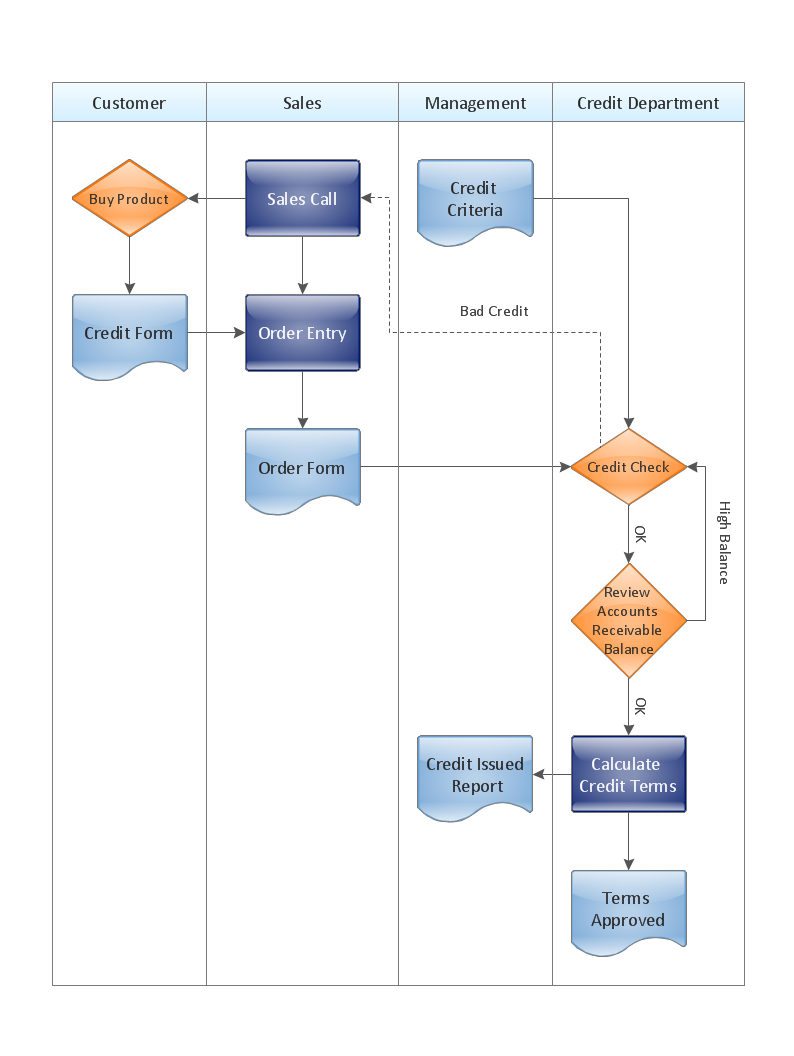
Take a look on an example of Cross-Functional-Flowchart, showing the software service cross-function process flowcharts among the different departments. It presents a simple flowchart among the customer, sales, technical support, tester and development. Try now Flowchart Software and Cross-Functional library with 2 libraries and 45 vector shapes of the Cross-Functional Flowcharts solution. Then you can use built-in templates to create and present your software service cross-function process flowcharts.Spatial Data Analysis
ConceptDraw PRO diagramming and vector drawing software extended with Pictorial Infographics Solution from the “Infographics” Area is the best for Spatial Data Analysis. You have a perfect possibility to make sure this right now.Cross-Functional Flowchart - The easiest way to draw crossfunctional
ConceptDraw PRO diagramming software provides vector shapes and connector tools for quick and easy drawing diagrams for business, technology, science and education. Use ConceptDraw PRO enhanced with solutions from ConceptDraw Solution Park to create diagrams to present and explain structures, process flows, logical relationships, networks, design schemes and other visually organized information and knowledge.Total Quality Management Definition
The Total Quality Management Diagram solution helps you and your organization visualize business and industrial processes. Create Total Quality Management diagrams for business process with ConceptDraw software.Material Requisition Flowchart. Flowchart Examples
Material requisition is a request generated by internal or external organization with a goal to inform the purchase department about the needed items and materials. The requisition can be represented as a written document on a pre-printed form or online request in form of electronic document. The electronic inquisition occupies a leading position in a modern world, now the paper forms are replaced by electronic ordering processes and workflows. The requisition is actively used in business as an internal document for notification the store about the needed goods, in medicine for making the orders on medical equipment and medicaments, in industry for creation request for purchasing some items and materials, and so on. ConceptDraw PRO vector graphics software extended with Flowcharts solution from the Diagrams area is powerful and useful tool for drawing various types of Flowcharts, including without doubt the Material Requisition Flowchart of any degree of detailing. Succeed in drawing using the large quantity of predesigned flowchart specific shapes, symbols and icons.Sales Process Map
You need create a Sales Process Map? Use the ConceptDraw PRO software which is ideal for the sales process management, marketing and engineering thanks to the powerful Sales Flowcharts solution from the Marketing area of ConceptDraw Solution Park.How Do Fishbone Diagrams Solve Manufacturing Problems
How do Fishbone diagrams solve manufacturing problems? Fishbone diagrams are successfully used in various fields of industries and manufacturing to analyze the set of possible causes and their effects. Fishbone diagram provides a process to clearly define the “Effect” and then puts you to thinking about the possible causes, based on the categories of common problems in manufacturing. ConceptDraw PRO application extended with Fishbone Diagrams solution lets you construct Fishbone diagrams and represent globally recognized standards for manufacturing 6 Ms and 8 Ms.The Sales Process
The Sales Process is a complex approach for selling a product or service which assumes many steps including the sales planning, realization of the sales marketing and management strategies, sales process analysis, etc. Now we have a ConceptDraw PRO software extended with unique Sales Flowcharts solution from the Marketing area of ConceptDraw Solution Park which ideally suits for the planning and realization the company's sales process.
 Event-driven Process Chain Diagrams
Event-driven Process Chain (EPC) Diagram is a type of flowchart widely used for modeling in business engineering and reengineering, business process improvement, and analysis. EPC method was developed within the Architecture of Integrated Information Systems (ARIS) framework.
- Technical Drawing Software | Mechanical Drawing Symbols ...
- Fabrication Engineering Drawing Symbol
- Mechanical Drawing Symbols | Electrical Symbols , Electrical ...
- Mechanical Fabrication Drawing Symbols
- Process Flowchart | Steel Fabrication Drafting Symbols
- Mechanical Drawing Symbols | Mechanical Engineering | Technical ...
- Mechanical Drawing Symbols | Engineering | Technical drawing ...
- Technical drawing - Machine parts assembling | Process Flowchart ...
- Symbols Of Steel Fabrication Engineering
- Basic Flowchart Symbols and Meaning | Technical drawing ...
- Technical drawing - Machine parts assembling | Mechanical ...
- Mechanical Drawing Symbols | Technical drawing - Machine parts ...
- Mechanical Drawing Symbols | Technical drawing - Machine parts ...
- Technical Drawing Software | Butt weld geometry | Welding symbols ...
- Process Flowchart | Fabrication And Machining Symbol
- Mechanical Engineering | Technical drawing - Machine parts ...
- All Symbols Of Mechanic Fabrication
- Process Flowchart | Machining Symbols For Fabrication
- How to Create a Mechanical Diagram | Technical Drawing Software ...

