Financial Comparison Chart
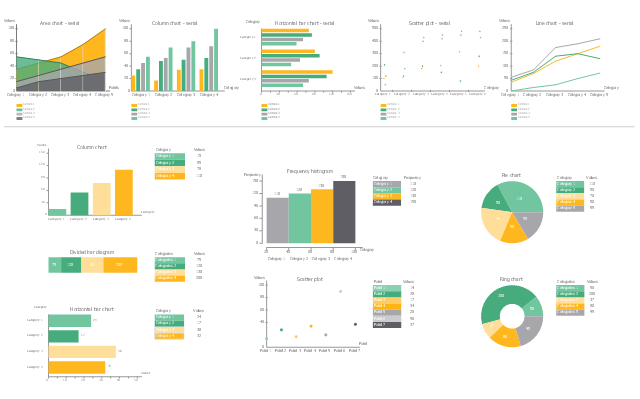
This sample shows the Bar Chart of the leverage ratios for two major investment banks. The leverage ratio is the ratio of the total debt to the total equity; it is a measure of the risk taken by the bank. The higher of the leverage ratio denotes the more risk, the greater risks can lead to the subprime crisis.The vector stencils library "Financial charts" contains 12 charts and graphs.
"A chart, also called a graph, is a graphical representation of data, in which the data is represented by symbols, such as bars in a bar chart, lines in a line chart, or slices in a pie chart". A chart can represent tabular numeric data, functions or some kinds of qualitative structure and provides different info." [Chart. Wikipedia]
Use it to design your financial infographics.
Bar Diagrams for Problem Solving. Create economics and financial bar charts with Bar Graphs Solution
Create bar graphs for visualizing economics problem solving and financial data comparison using the ConceptDraw DIAGRAM diagramming and vector drawing software extended with the Bar Graphs Solution from the Graphs and Charts area of ConceptDraw Solition Park.
 Accounting Flowcharts
Accounting Flowcharts solution extends ConceptDraw DIAGRAM software with templates, samples and library of vector stencils for drawing the accounting flow charts.
 Audit Flowcharts
Audit flowcharts solution extends ConceptDraw DIAGRAM software with templates, samples and library of vector stencils for drawing the audit and fiscal flow charts.
 Business Diagrams Package
Business Diagrams Package is a large set of comprehensive graphical solutions from the ConceptDraw Solution Park, which are powerful in solving the business, marketing and quality tasks in completely different fields, such as finance, education, health food and cooking, HR, and many others. The tools of this package's solutions are a powerful assistant in drawing all diversity of Financial and Marketing infographics, Business process workflow diagrams, Organizational charts, Education infographics, Quality diagrams, Health food diagrams, HR flowcharts, as well as different graphics and charts, which depict the values of key business indicators, their dependencies, give the full understanding of a situation within a company and on the market.
HelpDesk
How to Create Financial Infographics
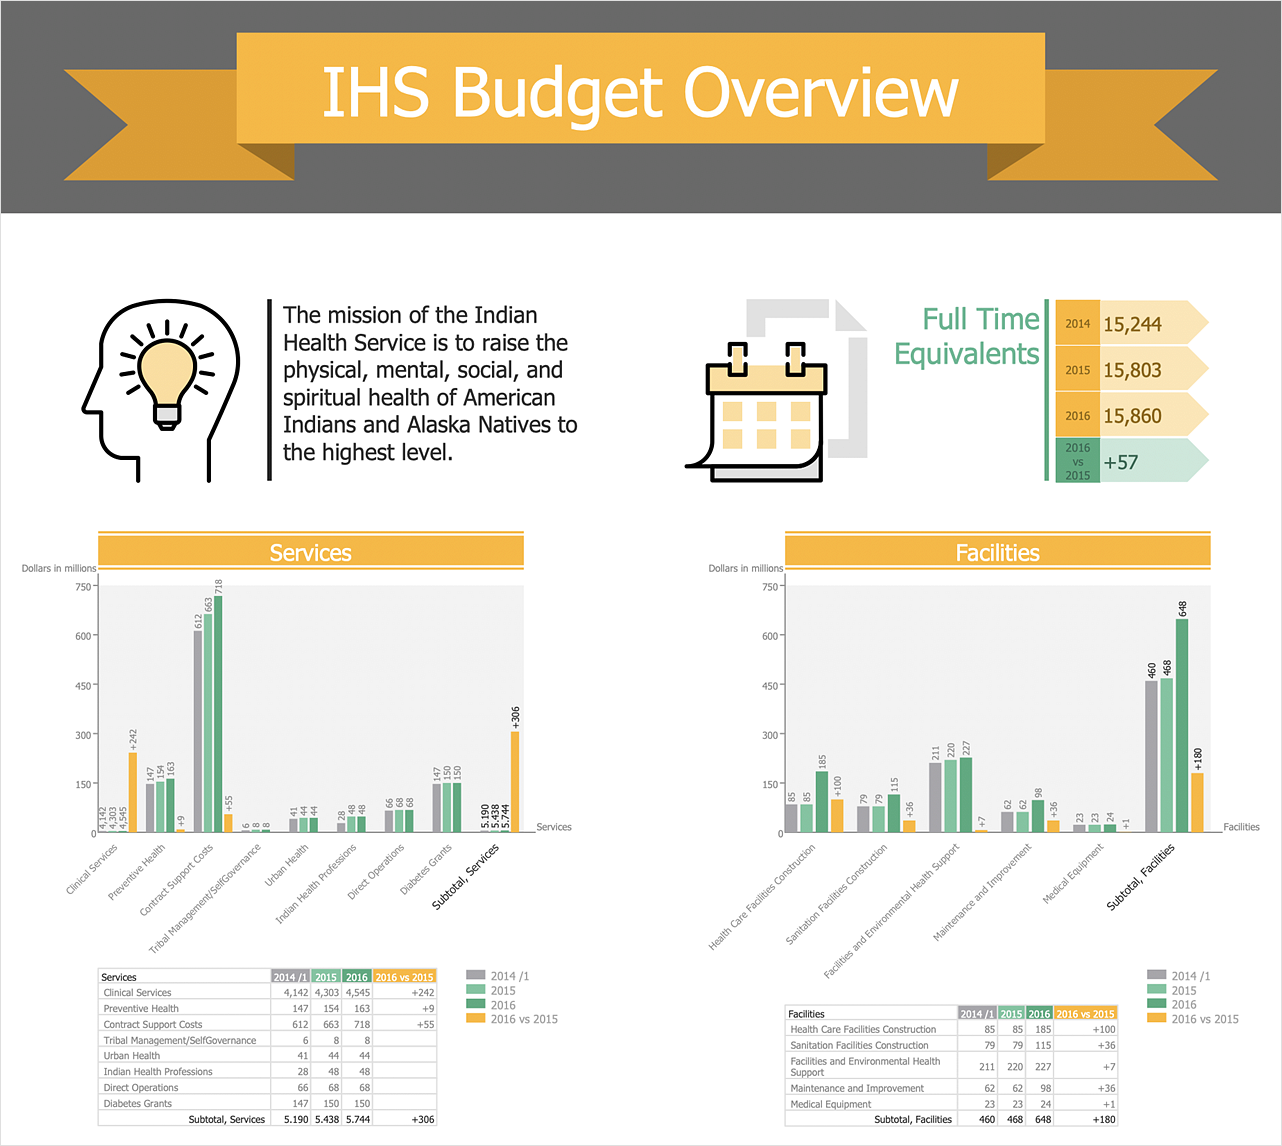
Making Infographics is an ideal choice for organizing attractive and interesting financial presentations, detailed financial reports. Infographics are rather helpful for depiction the basic concepts of financial management and principles of management the cash flows, for implementing the financial analysis and construction financial forecasts. The Financial Infographics solution for ConceptDraw DIAGRAM contains pre-designed samples, templates to be filled in, and libraries of vector design elements of financial symbols, charts, indicators, maps, lists, titles, callouts, etc.The Best Drawing Program for Mac
ConceptDraw DIAGRAM is the professional business graphic software for drawing diagrams and charts with great visual appeal on Mac OS X.- Financial Comparison Chart | Bar Diagrams for Problem Solving ...
- Design elements - Financial charts | Finance Chart Image Png
- Financial Comparison Chart | Sales Growth. Bar Graphs Example ...
- Accounting Flowcharts | Financial Accounting Flowchart
- Design elements - Financial charts
- Feature Comparison Chart Software | Financial Comparison Chart ...
- Financial Comparison Chart | Feature Comparison Chart Software ...
- Financial Audit Process Flowchart
- Accounting Data Flow from the Accounting Flowcharts Solution ...


