 Fishbone Diagram
Fishbone Diagrams solution extends ConceptDraw DIAGRAM software with templates, samples and library of vector stencils for drawing the Ishikawa diagrams for cause and effect analysis.
 Fishbone Diagrams
The Fishbone Diagrams solution extends ConceptDraw DIAGRAM software with the ability to easily draw the Fishbone Diagrams (Ishikawa Diagrams) to clearly see the cause and effect analysis and also problem solving. The vector graphic diagrams produced using this solution can be used in whitepapers, presentations, datasheets, posters, and published technical material.
Network Diagram Software
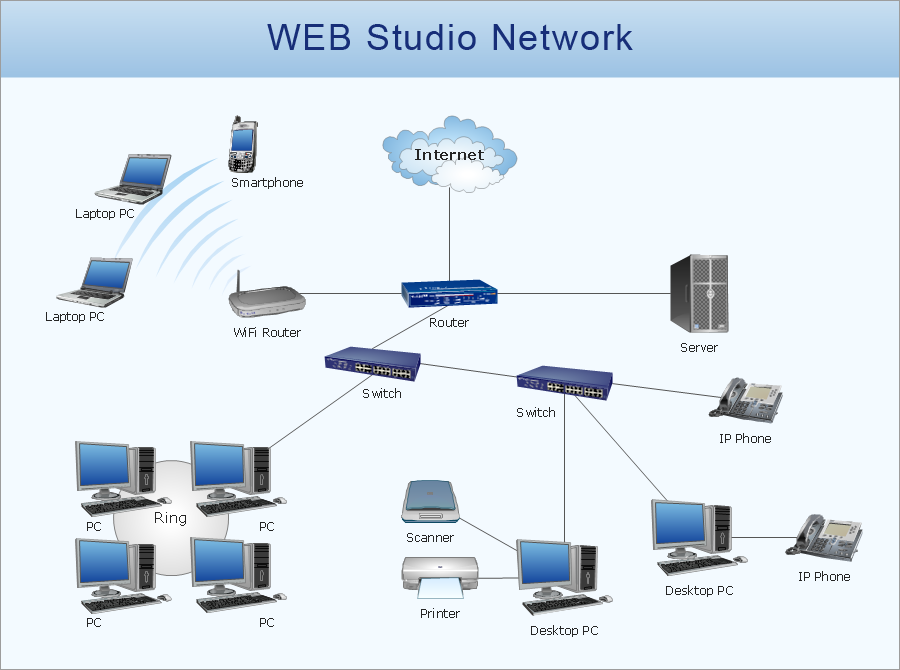
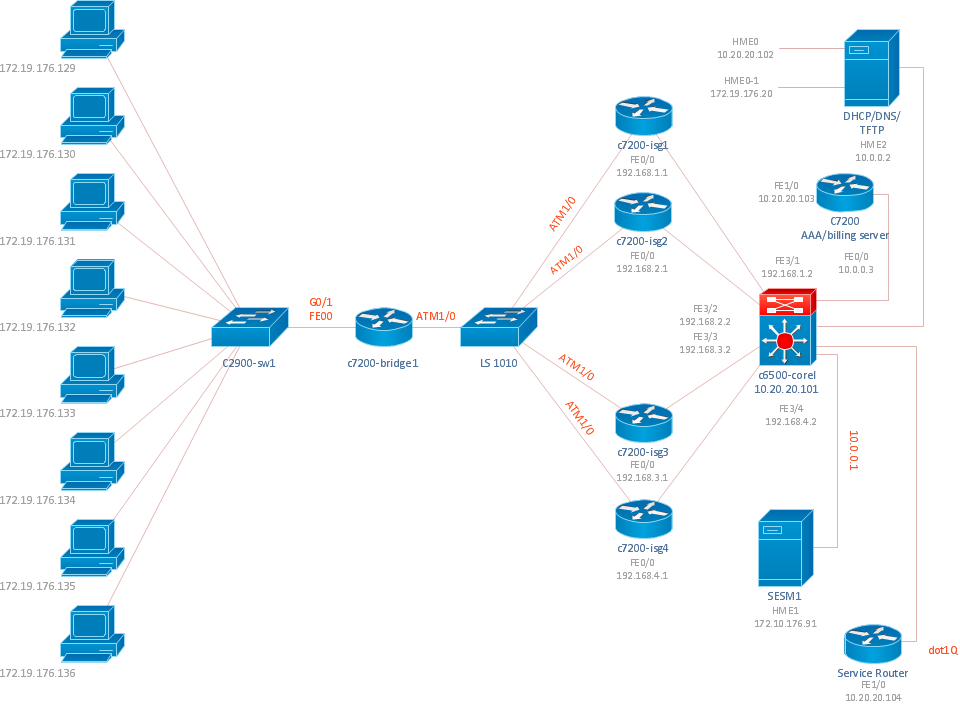
Network Diagrams are used to visually represent the network architecture, to illustrate the network structure, how the computers and other elements of the network are connected each other using a variety of network symbols, clipart and connection lines. They are incredibly useful on the stages of projecting computer network, of its construction and exploitation. Professionally designed and accurate Network Diagrams are equally convenient for computer engineers and users. You can construct them by hand on the paper or use special network diagramming software, such as ConceptDraw DIAGRAM. Having at disposal the powerful network diagramming tools of Computer Network Diagrams solution included to ConceptDraw Solution Park, you can succeed in drawing various types of Computer Network Diagrams, among them Network Communication Plans, Logical Network Diagrams, Network Topology Diagrams, LAN and WAN Diagrams, Network Floor Plan Layouts, Computer Network System Diagrams, Web-based Network Diagrams, Wireless Network Diagrams, Cisco Network Diagram, and others.
 Electrical Engineering
This solution extends ConceptDraw DIAGRAM.9.5 (or later) with electrical engineering samples, electrical schematic symbols, electrical diagram symbols, templates and libraries of design elements, to help you design electrical schematics, digital and analog
 Fault Tree Analysis Diagrams
This solution extends ConceptDraw DIAGRAM.5 or later with templates, fault tree analysis example, samples and a library of vector design elements for drawing FTA diagrams (or negative analytical trees), cause and effect diagrams and fault tree diagrams.
 ConceptDraw Solution Park
ConceptDraw Solution Park collects graphic extensions, examples and learning materials
 Seven Basic Tools of Quality
Manage quality control in the workplace, using fishbone diagrams, flowcharts, Pareto charts and histograms, provided by the Seven Basic Tools of Quality solution.
 Mechanical Engineering
This solution extends ConceptDraw DIAGRAM.9 mechanical drawing software (or later) with samples of mechanical drawing symbols, templates and libraries of design elements, for help when drafting mechanical engineering drawings, or parts, assembly, pneumatic,
Diagramming Tool Mac
The best Entity Relationship Diagram tool for Mac - ConceptDraw DIAGRAM , extebded with the professional ERD drawing solution. The vector graphic diagrams can be drawn by everybody.Fault Tree Analysis Example
Designing the Fault Tree Analysis (FTA) Diagrams first of all it is important to have a powerful software. ConceptDraw DIAGRAM diagramming and vector drawing software extended with Fault Tree Analysis Diagrams Solution from the Industrial Engineering Area is exactly what you need. It is also convenient to have professional looking Fault Tree Analysis example before the eyes, and it is excellent that this solution includes large collection of such examples.
 Chemical and Process Engineering
This chemical engineering solution extends ConceptDraw DIAGRAM.9.5 (or later) with process flow diagram symbols, samples, process diagrams templates and libraries of design elements for creating process and instrumentation diagrams, block flow diagrams (BFD
- Electrical Engineering | Electric and Telecom Plans | Fishbone ...
- Fishbone Diagram For Electrical Engineering
- Engineering Fishbone Diagram
- Fishbone Diagram | Workflow Diagram Examples | Fishbone ...
- Fishbone Diagram By Electric Exampls
- Fishbone Diagrams | Engineering | ConceptDraw Solution Park ...
- Fish Bone Diagram Electrical Related
- Fishbone Diagrams | ConceptDraw Solution Park | Electric and ...
- Fishbone Diagrams | Engineering | ConceptDraw Solution Park ...
- Fishbone Diagrams | Fishbone Diagram | Engineering | Fishbone ...
- Block Diagram Creator | Electrical Engineering | Security and ...
- SWOT and TOWS Matrix Diagrams | Engineering | Management ...
- Fishbone Diagrams | Engineering | Process Flowchart | Ishikawa ...
- Fishbone Diagrams | Engineering | Mechanical Engineering | Fish ...
- Troubleshooting in Wireless Connection | Use a Fishbone Diagram ...
- Manufacturing 8 Ms fishbone diagram - Template | Fishbone ...
- Engineering | SWOT and TOWS Matrix Diagrams | ConceptDraw ...
- Fishbone Diagram | Fishbone Diagrams | Network Diagram ...
- SWOT and TOWS Matrix Diagrams | Engineering | How to Create ...
- Cause and Effect Diagrams | Fishbone Diagram | How To Create a ...


