HelpDesk
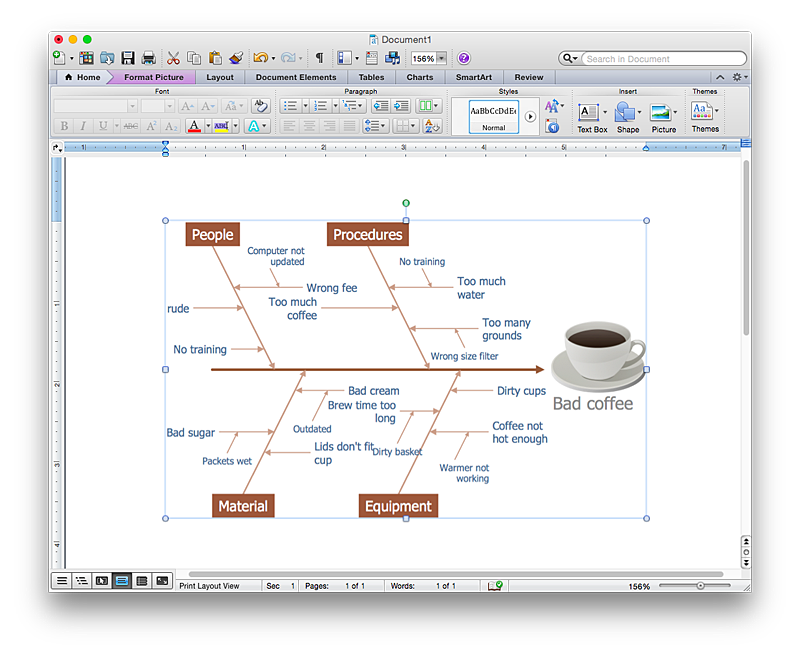
How to Add a Fishbone (Ishikawa) Diagram to a MS Word Document Using ConceptDraw PRO
The ability to create a fishbone (Ishikawa) Diagram is supported by the ConceptDraw Fishbone Diagram solution. ConceptDraw PRO allows you to easily create a fishbone diagrams and then insert them into a MS Word document."Causes in the diagram are often categorized, such as to the 6 M's ...
The 6 Ms (used in manufacturing industry):
(1) Machine (technology);
(2) Method (process);
(3) Material (Includes Raw Material, Consumables and Information.);
(4) Man Power (physical work)/ Mind Power (brain work): Kaizens, Suggestions;
(5) Measurement (Inspection);
(6) Milieu/ Mother Nature (Environment).
The original 6Ms used by the Toyota Production System have been expanded by some to include the following and are referred to as the 8Ms. However, this is not globally recognized. It has been suggested to return to the roots of the tools and to keep the teaching simple while recognizing the original intent; most programs do not address the 8Ms.
(7) Management/ Money Power;
(8) Maintenance." [Ishikawa diagram. Wikipedia]
This 8Ms Ishikawa diagram (manufacturing cause and effect diagram) template is included in the Fishbone Diagram solution from the Management area of ConceptDraw Solution Park.
 Word Exchange
This solution extends ConceptDraw MINDMAP software with the ability to quickly create the framework for a future article or book, fill the structure with ideas, and use it to produce an MS Word document with just a simple click of the mouse.
 Fishbone Diagrams
The Fishbone Diagrams solution extends ConceptDraw PRO v10 software with the ability to easily draw the Fishbone Diagrams (Ishikawa Diagrams) to clearly see the cause and effect analysis and also problem solving. The vector graphic diagrams produced using this solution can be used in whitepapers, presentations, datasheets, posters, and published technical material.
 IDEF0 Diagrams
IDEF0 Diagrams visualize system models using the Integration Definition for Function Modeling (IDEF) methodology. Use them for analysis, development and integration of information and software systems, and business process modelling.
 Fishbone Diagram
Fishbone Diagrams solution extends ConceptDraw PRO software with templates, samples and library of vector stencils for drawing the Ishikawa diagrams for cause and effect analysis.
 Venn Diagrams
Venn Diagrams are actively used to illustrate simple set relationships in set theory and probability theory, logic and statistics, mathematics and computer science, linguistics, sociology, and marketing. Venn Diagrams are also often used to visually summarize the status and future viability of a project.
 Fault Tree Analysis Diagrams
This solution extends ConceptDraw PRO v9.5 or later with templates, fault tree analysis example, samples and a library of vector design elements for drawing FTA diagrams (or negative analytical trees), cause and effect diagrams and fault tree diagrams.
 25 Typical Orgcharts
The 25 Typical Orgcharts solution contains powerful organizational structure and organizational management drawing tools, a variety of professionally designed organization chart and matrix organization structure samples, 25 templates based on various orga
 Audit Flowcharts
Audit flowcharts solution extends ConceptDraw PRO software with templates, samples and library of vector stencils for drawing the audit and fiscal flow charts.
 Sport Field Plans
Construction of sport complex, playgrounds, sport school, sport grounds and fields assumes creation clear plans, layouts, or sketches. In many cases you need represent on the plan multitude of details, including dimensions, placement of bleachers, lighting, considering important sport aspects and other special things.
- Fishbone Diagram | Value Stream Mapping Template | Bar Chart ...
- Fishbone Diagram | Ishikawa Word
- Free Fishbone Diagram Template Word Download
- How to Make SWOT Analysis in a Word Document | How to Make ...
- How to Add a Business Process Diagram to a MS Word Document ...
- Fishbone Diagram | Word Exchange | PM Docs | Fishbone Diagram ...
- Fishbone Diagram | Business Productivity Diagramming | Business ...
- How to Add a Telecommunication Network Diagram to a MS Word ...
- Fishbone Diagram | Management | ConceptDraw Solution Park ...
- Line Chart Template for Word | Venn Diagram Template for Word ...
- Cause And Effect Diagram Template Word
- Venn Diagram Template for Word | Line Chart Template for Word ...
- Business Productivity Diagramming | Fishbone Diagram | Cause ...
- Fault Tree Analysis Diagrams | Word Exchange | Process Flowchart ...
- Word Exchange | How to Export a Mind Map into MS Word ...
- PM Easy | Fishbone Diagram | Cross-Functional Flowchart | Mind ...
- How to Add a Flowchart to a MS Word Document Using ...
- Fishbone Diagrams | Fishbone Diagram | How to Create a Fishbone ...
- How to Add a Cross-Functional Flowchart to an MS Word Document ...
- Fishbone Diagram | SWOT Matrix Template | SWOT Template ...

