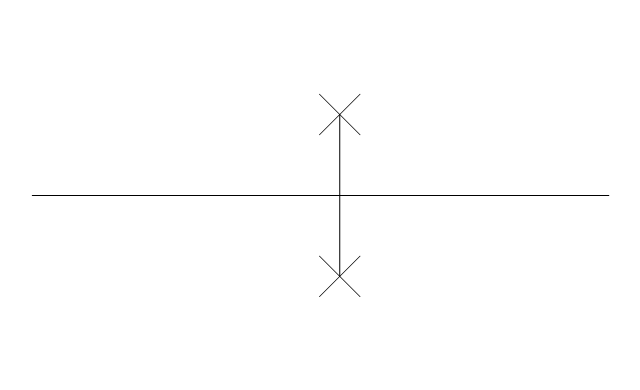
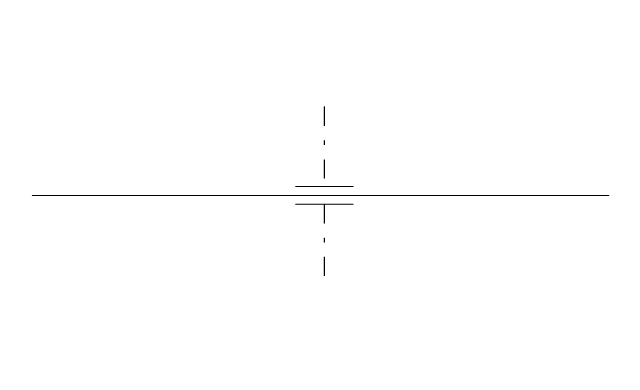
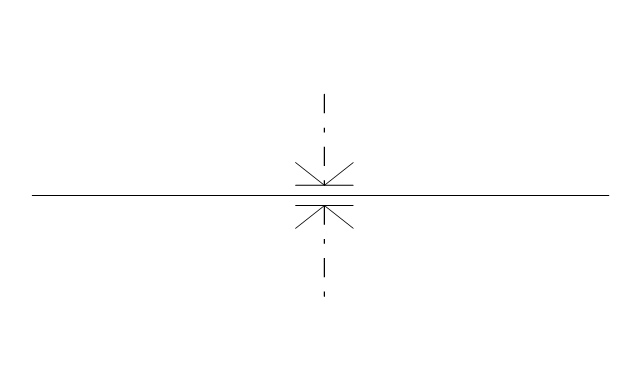
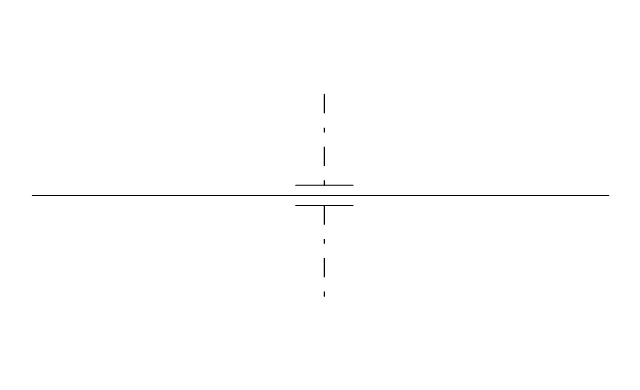
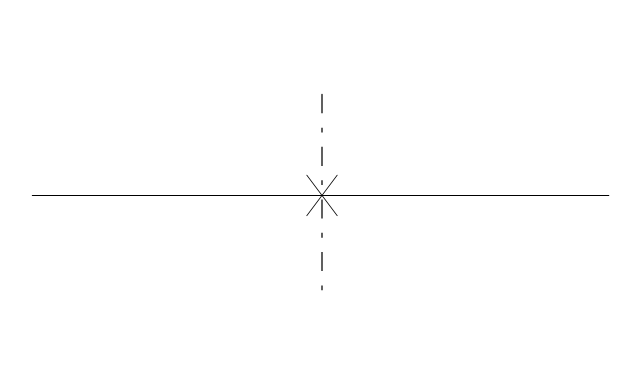
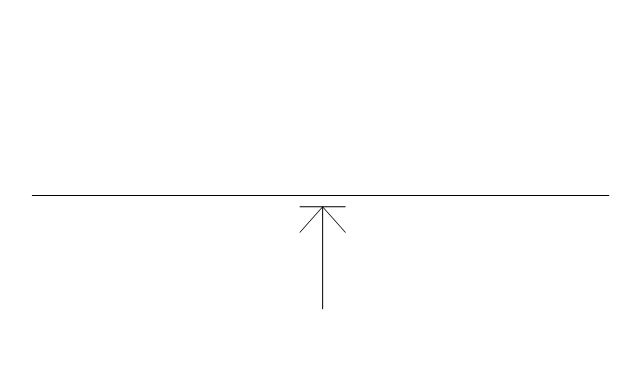
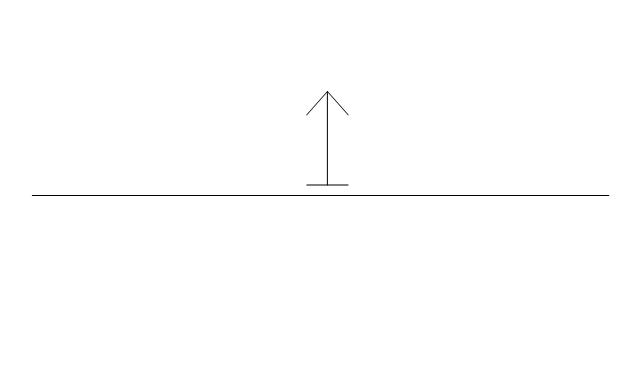
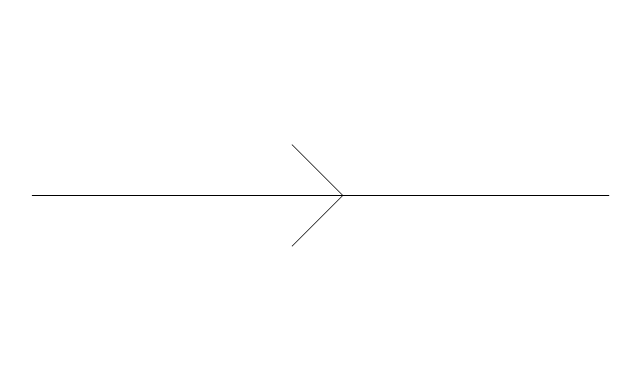
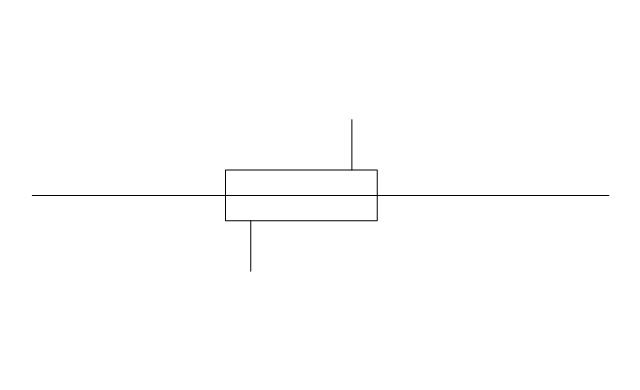
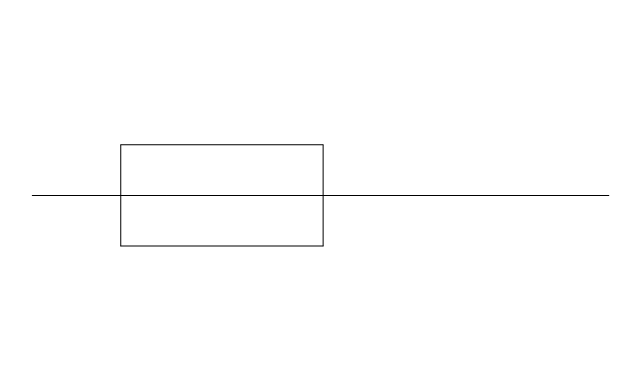
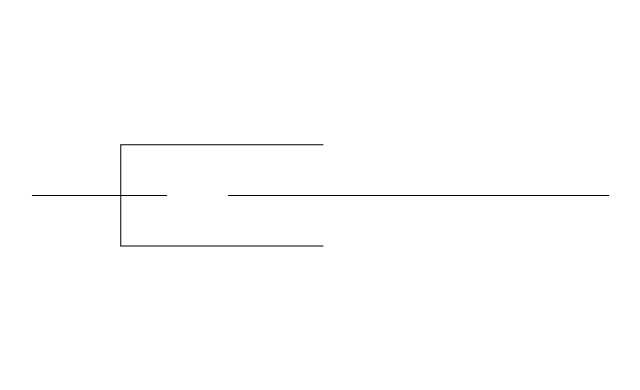
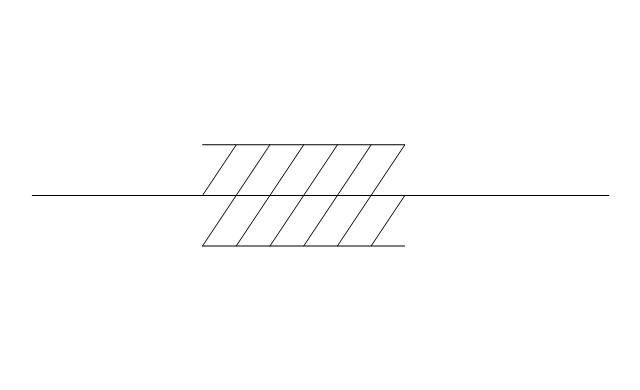
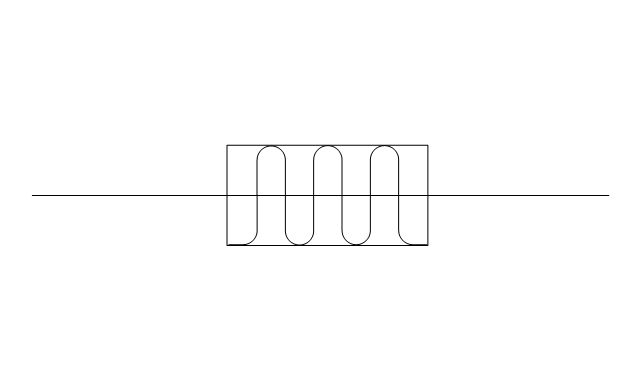
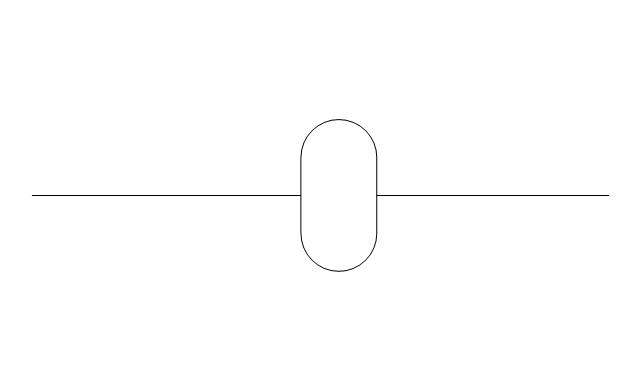
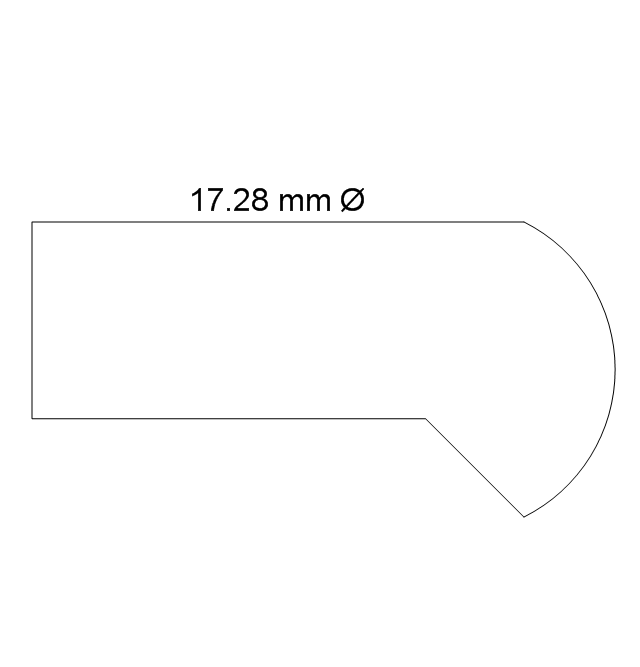
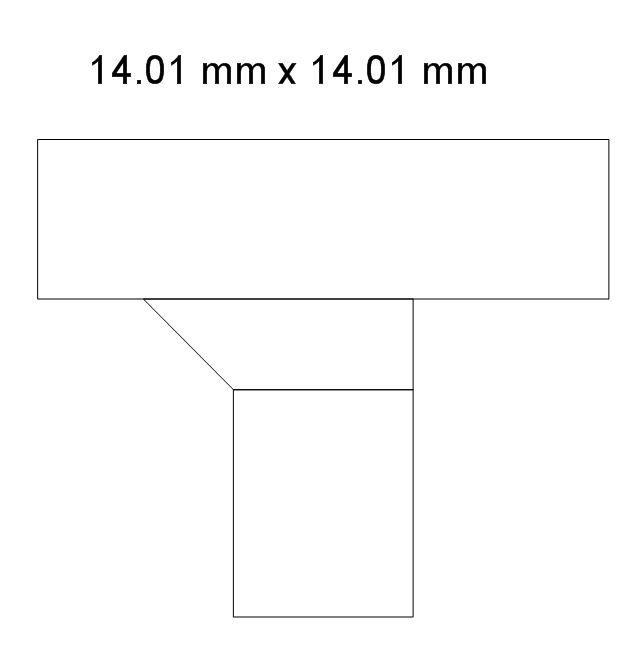
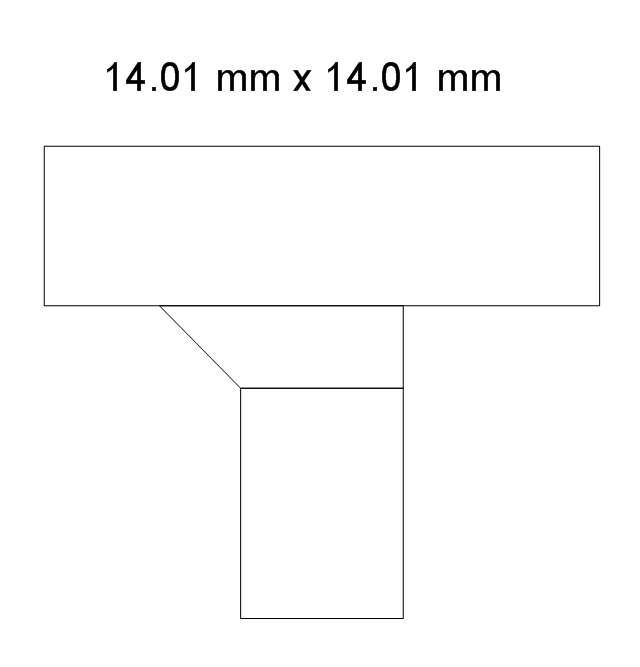
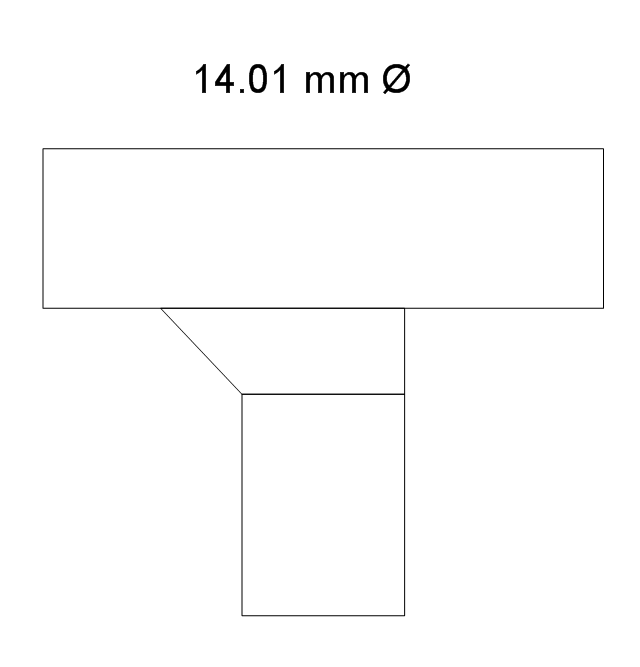
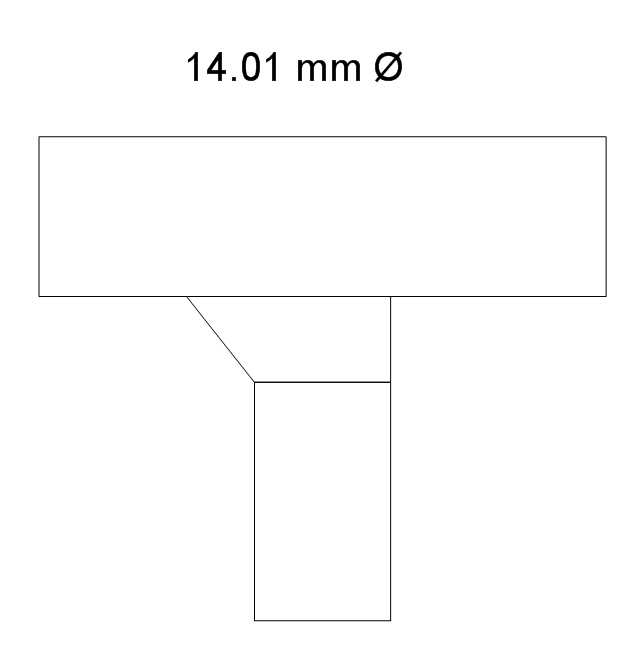
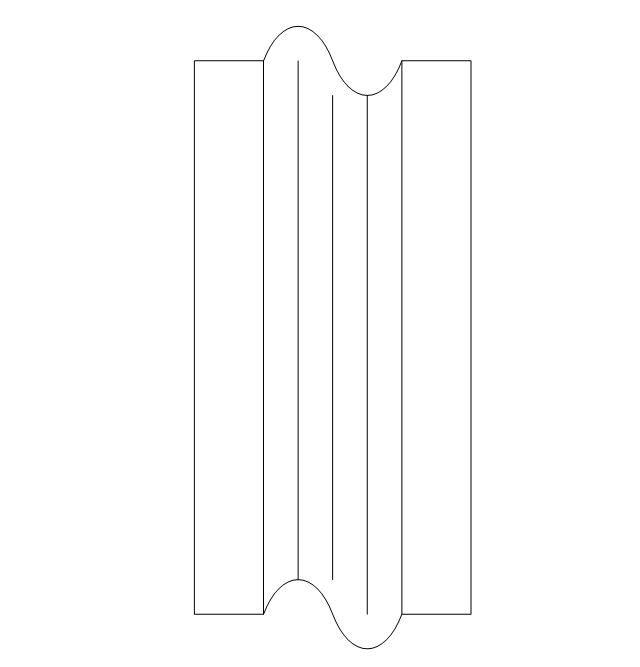
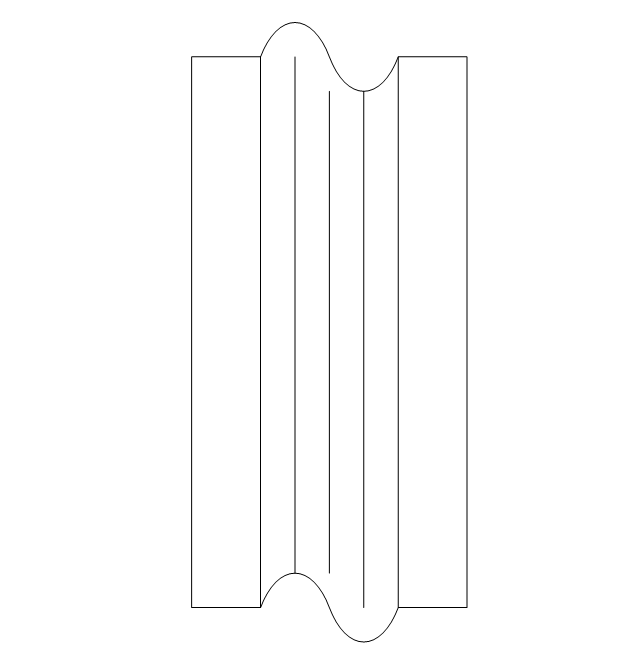
The vector stencils library "HVAC ductwork" contains 55 duct and vent symbols of HVAC mechanical components. Use it for drawing HVAC ductwork system diagrams, heating, ventilation, air conditioning, refrigeration, automated building control, and environmental control design in the ConceptDraw PRO diagramming and vector drawing software extended with the HVAC Plans solution from the Building Plans area of ConceptDraw Solution Park.
The vector stencils library "HVAC ductwork" contains 55 duct and vent symbols of HVAC mechanical components. Use it for drawing HVAC ductwork system diagrams, heating, ventilation, air conditioning, refrigeration, automated building control, and environmental control design in the ConceptDraw PRO diagramming and vector drawing software extended with the HVAC Plans solution from the Building Plans area of ConceptDraw Solution Park.
The vector stencils library "HR workflow" contains 60 HR workflow symbols.
Use this HR icon set to draw your HR flowcharts, workflow diagrams and process charts with the ConceptDraw PRO diagramming and vector drawing software.
The HR pictograms library "HR workflow" is included in the HR Flowcharts solution from the Management area of ConceptDraw Solution Park.
Use this HR icon set to draw your HR flowcharts, workflow diagrams and process charts with the ConceptDraw PRO diagramming and vector drawing software.
The HR pictograms library "HR workflow" is included in the HR Flowcharts solution from the Management area of ConceptDraw Solution Park.
The vector stencils library "Transport map" contains 96 pictograms for drawing transport maps.
Use it in your spatial infographics for visual representation of transport schemes and plans as metro maps in the ConceptDraw PRO diagramming and vector drawing software extended with the Spatial Infographics solution from the area "What is Infographics" of ConceptDraw Solution Park.
Use it in your spatial infographics for visual representation of transport schemes and plans as metro maps in the ConceptDraw PRO diagramming and vector drawing software extended with the Spatial Infographics solution from the area "What is Infographics" of ConceptDraw Solution Park.
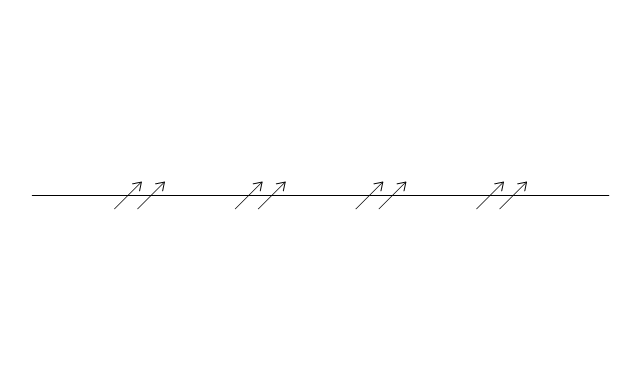
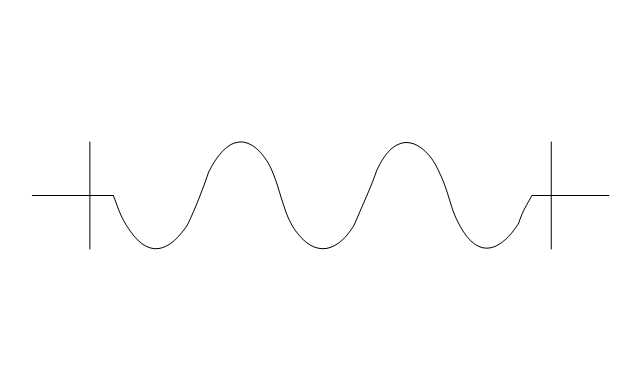
The vector stencils library "Pipes 2" contains 48 symbols of pipes. Use it for drawing plumbing and piping building plans, schematic diagrams, blueprints, or technical drawings of waste water disposal systems, hot and cold water supply systems in the ConceptDraw PRO diagramming and vector drawing software extended with the Plumbing and Piping Plans solution from the Building Plans area of ConceptDraw Solution Park.
The vector stencils library "HR workflow" contains 60 HR workflow symbols.
Use this HR icon set to draw your HR flowcharts, workflow diagrams and process charts with the ConceptDraw PRO diagramming and vector drawing software.
The HR pictograms library "HR workflow" is included in the HR Flowcharts solution from the Management area of ConceptDraw Solution Park.
Use this HR icon set to draw your HR flowcharts, workflow diagrams and process charts with the ConceptDraw PRO diagramming and vector drawing software.
The HR pictograms library "HR workflow" is included in the HR Flowcharts solution from the Management area of ConceptDraw Solution Park.
HelpDesk
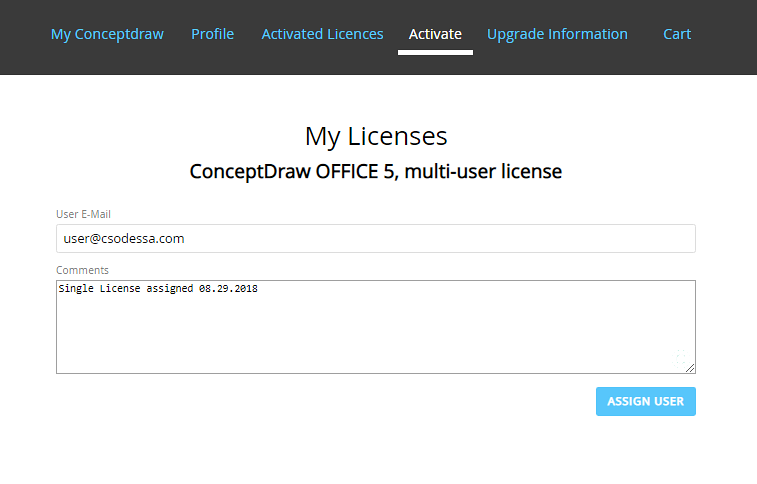
How to Manage ConceptDraw Multi-User License
Instructions on how to install and administrate ConceptDraw multi-user licenseConceptDraw DIAGRAM Database Modeling Software
ConceptDraw DIAGRAM is a very easy-to-use and intuitive database design tool which can save you hundreds of work hours. See database diagram samples created with ConceptDraw DIAGRAM database modeling database diagram software.Professional Diagram and Flowchart Software
ConceptDraw DIAGRAM is a Mac OS X and Windows platforms professional software to draw your own business process diagrams and flowcharts.Diagram Software - The Best Choice for Diagramming
For vector shapes and connector tools for quick and easy drawing diagrams for business, technology, science and education - The best choice for Diagramming is ConceptDraw DIAGRAM.Think and act effectively
Many people who use mind mapping software for personal organizing find ConceptDraw MINDMAP sufficiently useful mind mapping tool in their business and daily life. Especially many positive responses receive ConceptDraw MINDMAP as cross platform tool to mind maps for Macintosh and Windows.The vector stencils library "Composition charts" contains 6 templates: 2 pie charts, 2 divided bar charts and 2 double divided bar charts.
The vector stencils library "Composition indicators" contains 6 templates of visual indicators.
Use these design elements to visualize composition comparison of your data in your visual dashboard created using the ConceptDraw PRO diagramming and vector drawing software.
"A pie chart (or a circle graph) is a circular chart divided into sectors, illustrating numerical proportion. In a pie chart, the arc length of each sector (and consequently its central angle and area), is proportional to the quantity it represents. While it is named for its resemblance to a pie which has been sliced, there are variations on the way it can be presented. ...
An obvious flaw exhibited by pie charts is that they cannot show more than a few values without separating the visual encoding (the “slices”) from the data they represent (typically percentages). When slices become too small, pie charts have to rely on colors, textures or arrows so the reader can understand them. This makes them unsuitable for use with larger amounts of data. Pie charts also take up a larger amount of space on the page compared to the more flexible alternative of bar charts, which do not need to have separate legends, and can also display other values such as averages or targets at the same time. ...
Most subjects have difficulty ordering the slices in the pie chart by size; when the bar chart is used the comparison is much easier. Similarly, comparisons between data sets are easier using the bar chart. However, if the goal is to compare a given category (a slice of the pie) with the total (the whole pie) in a single chart and the multiple is close to 25 or 50 percent, then a pie chart can often be more effective than a bar graph." [Pie chart. Wikipedia]
The example "Design elements - Composition charts and indicators" is included in the Composition Dashboard solution from the area "What is a Dashboard" of ConceptDraw Solution Park.
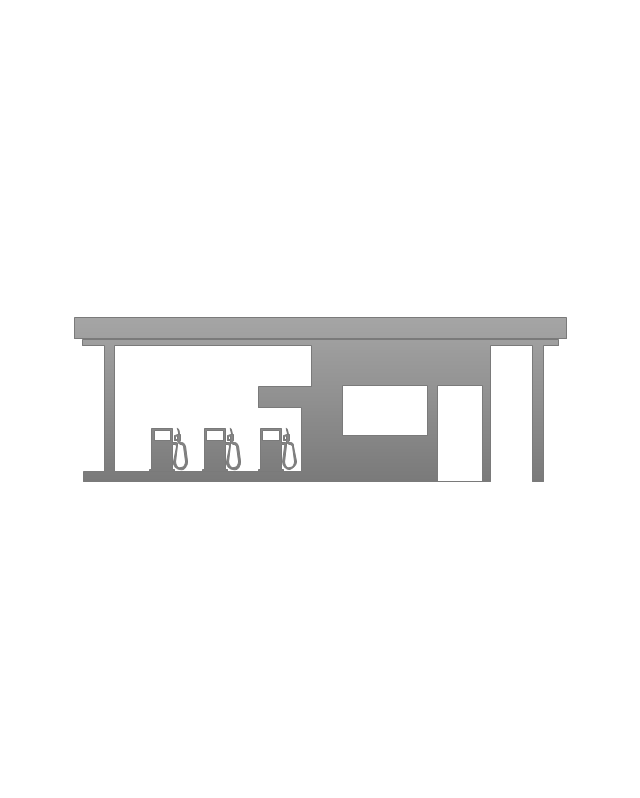
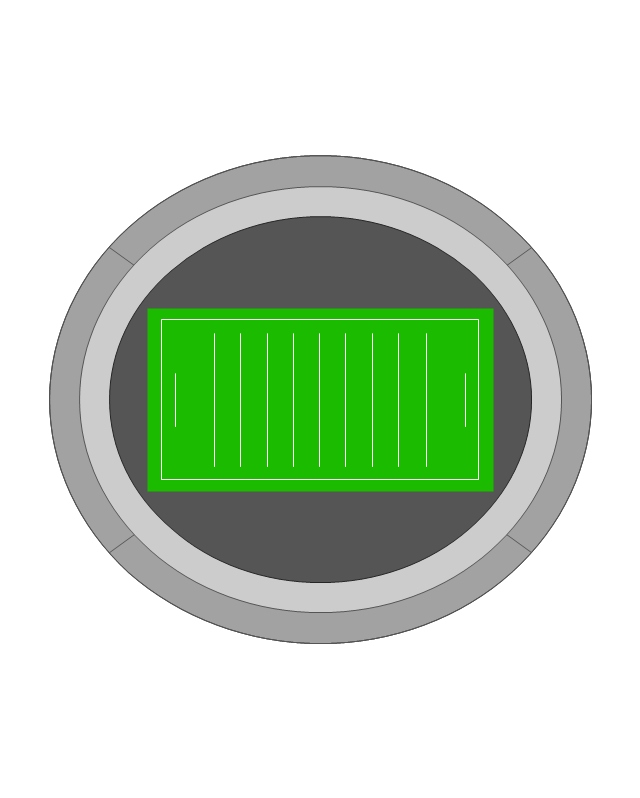
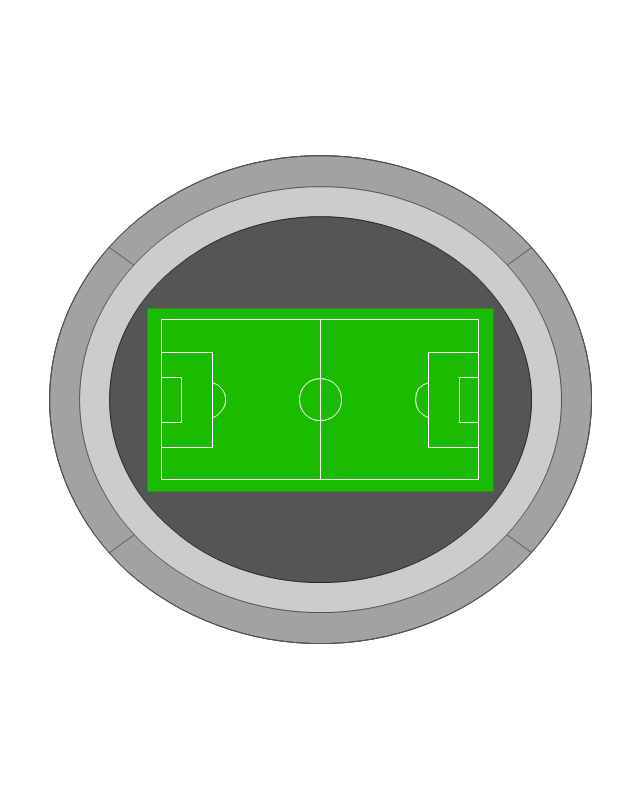
The vector stencils library "Landmarks" contains 69 landmark symbols of buildings, waterways, scale and directional indicators for labeling transportation and directional maps, road and route maps, street and transit maps, locator and tourist maps.
The pictograms example "Landmarks - Vector stencils library" was created using the ConceptDraw PRO diagramming and vector drawing software extended with the Directional Maps solution from the Maps area of ConceptDraw Solution Park.
The pictograms example "Landmarks - Vector stencils library" was created using the ConceptDraw PRO diagramming and vector drawing software extended with the Directional Maps solution from the Maps area of ConceptDraw Solution Park.
In searching of alternative to MS Visio for MAC and PC with ConceptDraw DIAGRAM
Undoubtedly MS Visio is a powerful and multifunctional tool, but however at times occur the instances, when it turns unable of meeting certain users' requirements. At this cases you may need to use an alternative program software, preferably it will be simple, convenient, and at the same time powerful and professional. In searching the alternative to MS Visio for MAC and PC we recommend you to pay attention for ConceptDraw DIAGRAM software, which was developed to satisfy all your drawing needs and requirements. It is a fully-functioned alternative product to MS Visio for both platforms. ConceptDraw DIAGRAM software has many advantages, the main among them are the cross-platform compatibility, a reasonable price, widespread ConceptDraw Solution Park with huge variety of different solutions that offer numerous libraries of specialized vector objects, useful examples, samples, and quick-start templates, extensive import / export capabilities, built-in script language, MS Visio support and certainly free technical support.- Flexible connection, rect. duct
- Flexible spending account
- Flexible River
- HVAC ductwork - Vector stencils library | Design elements - HVAC ...
- HVAC ductwork - Vector stencils library | Welding - Vector stencils ...
- Pie Charts | Pie Chart Software | Pie Chart Examples and Templates ...
- Leave Application Process Flowchart
- Duct Offset Diagrams
- Design elements - HVAC ductwork | HVAC ductwork - Vector ...
- HR workflow - Vector stencils library | Disciplinary Process Flowchart
- Design elements - HVAC ductwork | HVAC ductwork - Vector ...
- Area chart template
- Process Flowchart | Types of Flowchart - Overview | Garrett IA ...
- Critical Path Method in ConceptDraw PROJECT | How to Use ...
- Simple & Fast Diagram Software | Create Flow Chart on Mac | Easy ...
- Interior Design Piping Plan - Design Elements | Pipes 2 - Vector ...
- Design elements - Pipes (part 2)
- Onboarding Flow Chart Process
- Active Directory Domain Services
- Duct Drawing Symbols




































-hr-workflow---vector-stencils-library.png--diagram-flowchart-example.png)







-hr-workflow---vector-stencils-library.png--diagram-flowchart-example.png)


