Bubble diagrams in Landscape Design with ConceptDraw DIAGRAM
Bubble Diagrams are the charts with a bubble presentation of data with obligatory consideration of bubble's sizes. They are analogs of Mind Maps and find their application at many fields, and even in landscape design. At this case the bubbles are applied to illustrate the arrangement of different areas of future landscape design, such as lawns, flowerbeds, playgrounds, pools, recreation areas, etc. Bubble Diagram helps to see instantly the whole project, it is easy for design and quite informative, in most cases it reflects all needed information. Often Bubble Diagram is used as a draft for the future landscape project, on the first stage of its design, and in case of approval of chosen design concept is created advanced detailed landscape plan with specification of plants and used materials. Creation of Bubble Diagrams for landscape in ConceptDraw DIAGRAM software is an easy task thanks to the Bubble Diagrams solution from "Diagrams" area. You can use the ready scanned location plan as the base or create it easy using the special ConceptDraw libraries and templates.
 ConceptDraw Solution Park
ConceptDraw Solution Park collects graphic extensions, examples and learning materials
HelpDesk
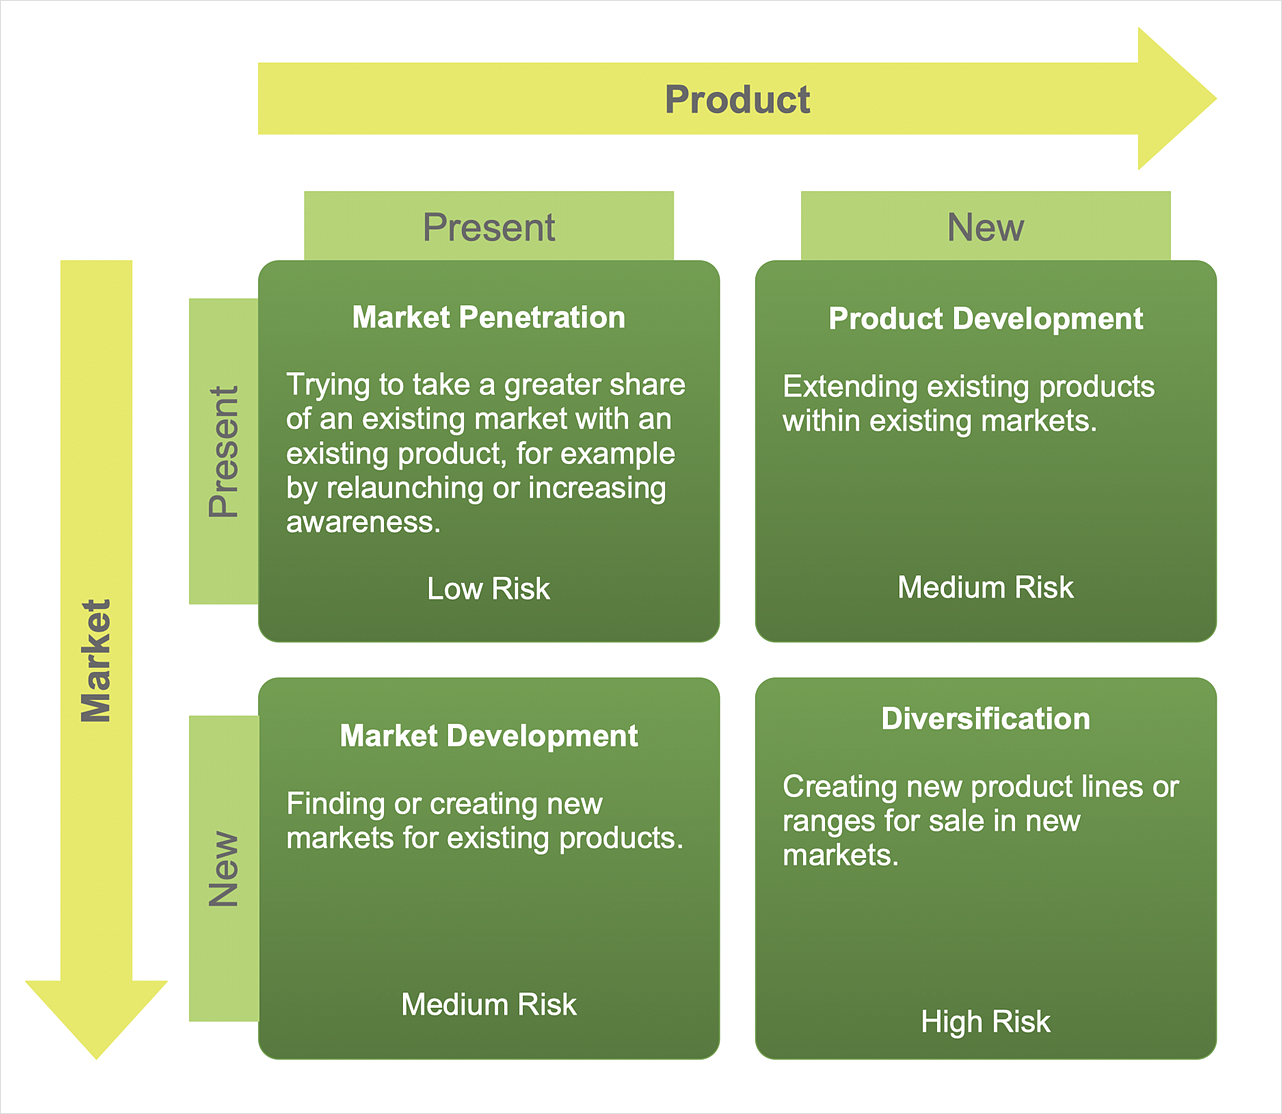
How to Make an Ansoff Matrix Template
Ansoff Matrix is a business strategic management tool that helps a business determine its product and market growth strategy. Ansoff matrix has four sections to show each impacting ways that businesses can grow. Using Ansoff Matrix enables determining the current position of any business in the industry and choose the direction of its growth, which would provide the most competitive position. While Ansoff Matrix is most commonly used as a business planning tool it can be used also for personal development. You can make Ansoff Matrix template for your organization using ConceptDraw DIAGRAM Matrices solution.HelpDesk
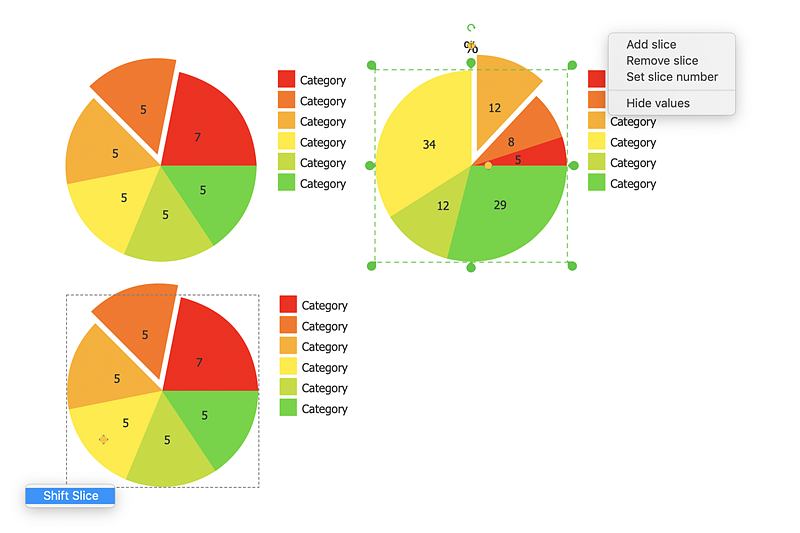
How to Draw the Different Types of Pie Charts
Using the Pie Chart, you can visually estimate the relative contribution that different data categories contribute to a whole value. The pie chart displays the statistics in a visual format. The main use of pie charts to show comparisons. The larger piece of the pie, the more the value of this value compared to the rest. Various applications of pie charts can be found in business and education. For business, pie charts can be used to compare the success or failure of the goods or services. They may also be used to display the business market share.HelpDesk
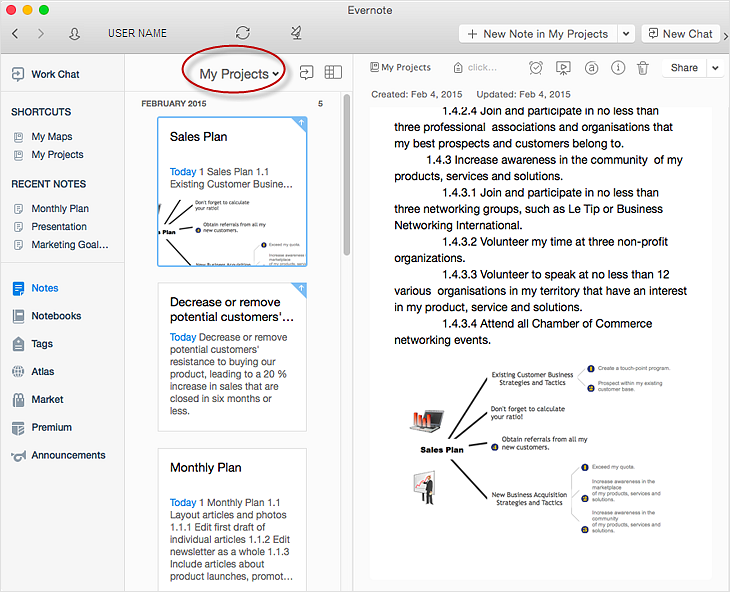
How to Add a Mind Map into a Given Notebook in Your Evernote Storage
The Note Exchange solution lets you to add a content, created with ConceptDraw MINDMAP to any of your Evernote's notebooks.HelpDesk
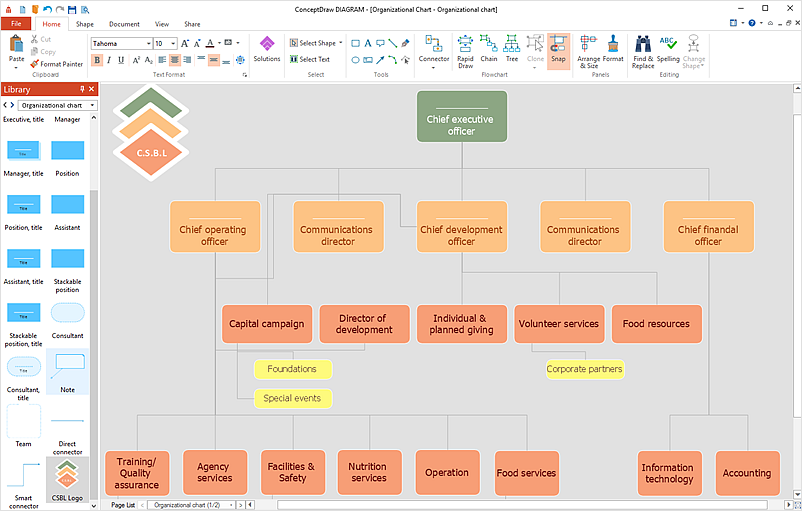
How to Add a Self-Drawn Object to a Library
One of the key elements of ConceptDraw DIAGRAM solutions are the libraries, containing a set of associated objects. Using these collections of business oriented vector objects, you can quickly get started making the diagram in the theme you need. The library collection can be supplemented by creating new or editing existing objects. You can create your own unique library just by dragging objects with the mouse. Library objects can be customized and saved for later use. You can change the scaling, color, line weight, label, and even the fill pattern of an object to use in custom drawings and diagrams. Your custom objects even can be searched for the next time you need to use them.
 Floor Plans
Construction, repair and remodeling of the home, flat, office, or any other building or premise begins with the development of detailed building plan and floor plans. Correct and quick visualization of the building ideas is important for further construction of any building.
HelpDesk
How to Create a Fishbone (Ishikawa) Diagram Quickly
A Fishbone (Ishikawa) diagram is also called cause-and-effect diagram. Fishbone diagram is often used in business to determine the cause of some problem. The diagram illustrates the main causes and sub-causes leading to an event. The main goal of the Fishbone diagram is to illustrate in a graphical way the relationship between a given outcome and all the factors that influence this outcome. The complete diagram resembles a fish skeleton as its name implies. The ability to create a Fishbone Diagram is supported by the Fishbone Diagram solution. Use ConceptDraw MINDMAP for structuring data and then ConceptDraw DIAGRAM for generating a Fishbone Diagram from mind map structure.HelpDesk
How to Make Soccer Position Diagram
The soccer field has the form of a large rectangle, covered with grass. Dimensions of soccer fields may vary slightly, depending on the level of the game, but all fields have some common characteristics. Soccer players may take different positions. Each soccer position has its own name and implies certain player functions. Every soccer position has a very specific name and task: Goalkeeper, Defenders, Midfielders and Forwards. During preparation for the game, coach met a challenge: how to explain each player's position and his role in the game. The difficulty is the fact that in the course of the game players will often move on the field and do not stay in one place. Football field diagram with dimensions and marking, and positions - it is an important tool for the coach. ConceptDraw DIAGRAM helps both coach and players to understand exactly their roles during the particular game. The ability to create Soccer diagrams is contained in the ConceptDraw Soccer solution. The solution provides- Flow Chart Symbols | USA Maps | Floor Plans | Draw 20 Flowchart ...
- Floor Plans | Symbols And Their Names For Living Room In ...
- How To use Furniture Symbols for Drawing Building Plan | Building ...
- Furniture Symbol Name Floor Plan
- How To use Furniture Symbols for Drawing Building Plan | Home ...
- Images Of Floor Plans Shows The Name Of Each Symbol
- Network Layout Floor Plans | Design elements - Network layout ...
- Building Electrical Drawing Symbols With Name
- What Is The Name Of The White Goods Floor Plan
- How To Create Restaurant Floor Plan in Minutes | ConceptDraw ...
- Electrical Drawing Software | How To use House Electrical Plan ...
- Symbol for Pool Table for Floor Plans | Interior Design Sport Fields ...
- Interior Designing Using Symbols For Construct A Plan For That
- Emergency Plan | Fire Exit Plan . Building Plan Examples | Fire and ...
- HVAC Plans
- Plant Layout Plans | Factory layout floor plan | Emergency Plan ...
- Visual Symbols And Their Names In Interior Design
- Pie Chart Insert Names
- Network Layout Floor Plans | Network Layout | Office wireless ...


