Pyramid Diagram and Pyramid Chart
Pyramid Diagram, Triangle Chart or Triangular Diagram is a convenient and useful type of diagrams, which lets represent the data hierarchical structure and to illustrate the foundation-based relationships between the hierarchy levels. Pyramid Diagrams are used to visualize effectively the hierarchical, as well as proportional and foundation-based relationships, the process steps, the interconnections of organizational layers or topics. ConceptDraw DIAGRAM software enhanced with Pyramid Diagrams solution from Marketing area of ConceptDraw Solution Park is a powerful business charting software, that includes all required tools for designing the multilevel Pyramid Diagrams as quickly as possible. The build-in vector stencils and templates are the great aid for designers, a variety of examples and samples is a good base and source of inspiration. Use attractive and vivid 2D and 3D Pyramid Diagrams and Triangle Charts designed in ConceptDraw DIAGRAM to illustrate your documents, presentations, infographics, articles, reports, websites, etc.HelpDesk
How to Draw a Pyramid Diagram
Pyramid diagram (triangle diagram) is used to represent data, which have hierarchy and basics. Due to the triangular form of the diagram, each pyramid section has a different width. The width of the segment shows the level of its hierarchy. Typically, the top of the pyramid is the data that are more important than the base data. A pyramid scheme can be used to show proportional and hierarchical relationships between some logically related items, such as departments within an organization, or successive elements of any process. This type of diagram is often used in marketing to display hierarchically related data, but it can be used in a variety of situations. ConceptDraw DIAGRAM allows you to make a pyramid diagram, quickly and easily using special libraries.Pyramid Chart Examples
Pyramid Charts and Triangle Diagrams are used to visually structure the topics and progressively order the quantitative data. They allow to illustrate hierarchical structure of the topics, proportional, interconnected and containment relations among the topics. The multilevel Pyramids and Triangle diagrams are constructed oriented up or down and divided into several horizontal slices. They are effectively used to represent marketing strategies, social strategies, information systems, market value, etc., to illustrate presentations, websites, documents, reports in business, finances, sales, management, marketing, media, training, consulting, and many other fields. To maximize the efficiency in drawing the Pyramid Charts, use the ConceptDraw DIAGRAM diagramming and vector drawing software extended with Pyramid Diagrams solution from Marketing area, which contains the set of Pyramid Chart examples, samples, templates and vector design elements of triangular diagrams and pyramids with different quantity of levels for various needs.Pyramid Diagram
A five level pyramid model of different types of Information Systems based on the information processing requirement of different levels in the organization. five level pyramid example is included in the Pyramid Diagrams solution from Marketing area of ConceptDraw Solution Park.How to Create a Pyramid Diagram
ConceptDraw Pyramid Diagram software allows drawing column charts using predesigned objects or drawing tools. In ConceptDraw Pyramid Diagram software you can find a complete set of column chart tools and objects.
 Pyramid Diagrams
Pyramid Diagrams solution extends ConceptDraw DIAGRAM software with templates, samples and library of vector stencils for drawing the marketing pyramid diagrams.
Bar Chart
ConceptDraw DIAGRAM extended with Bar Graphs solution from Graphs and Charts area of ConceptDraw Solution Park is ideal software for quick and simple drawing bar chart of any complexity graph.Bar Charts
ConceptDraw DIAGRAM diagramming and vector drawing software extended with Bar Graphs solution from the Graphs and Charts area of ConceptDraw Solution Park is ideal for drawing the Bar Charts fast and simply.Pictures of Graphs
ConceptDraw DIAGRAM diagramming and vector drawing software extended with Picture Graphs solution from the Graphs and Charts Area is the best choice for making professional looking pictures of graphs and colorful picture graphs.
 ConceptDraw Solution Park
ConceptDraw Solution Park collects graphic extensions, examples and learning materials
What Is a Picture Graph?
What is a Picture Graph? It's one of the most useful way which allows explain the information, statistical data in a visual form using the pictures. ConceptDraw DIAGRAM extended with Picture Graphs solution from the Graphs and Charts area offers you the easiest way of Picture Graphs drawing.Bar Chart Software
The best bar chart software ever is ConceptDraw. ConceptDraw bar chart software provides an interactive bar charting tool and complete set of predesigned bar chart objects.Bar Graph
You need to draw the Bar Graph? The automated tool can be useful for you. ConceptDraw DIAGRAM diagramming and vector drawing software extended with Bar Graphs solution from Graphs and Charts area of ConceptDraw Solution Park will help you create any Bar Graph.Histogram Chart
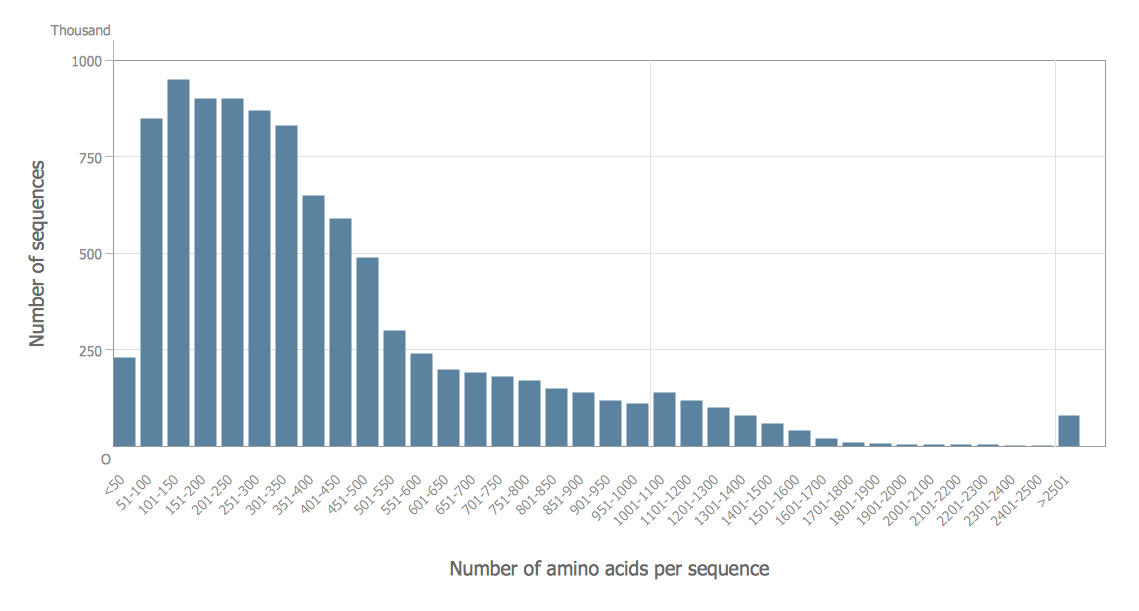
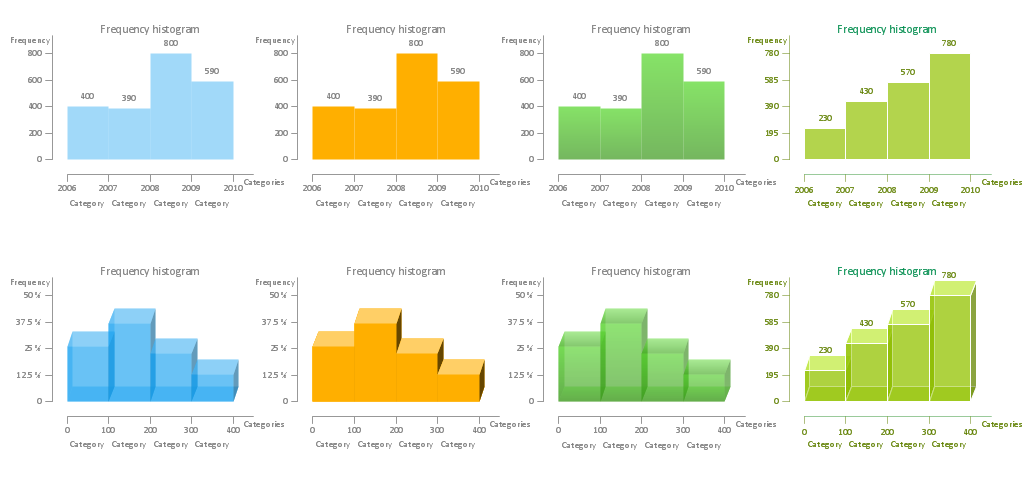
What is a Histogram Chart? It is a chart which visually displays a distribution of the data. ConceptDraw DIAGRAM extended with Histograms solution from the Graphs and Charts area of ConceptDraw Solution Park is the best software for fast and simple drawing professional looking Histogram Chart.Make a Histogram
ConceptDraw DIAGRAM extended with Histograms solution from the Graphs and Charts area of ConceptDraw Solution Park lets you make a Histogram of any complexity in minutes.
 Flowcharts
The Flowcharts solution for ConceptDraw DIAGRAM is a comprehensive set of examples and samples in several varied color themes for professionals that need to represent graphically a process. Solution value is added by the basic flow chart template and shapes' libraries of flowchart notation. ConceptDraw DIAGRAM flow chart creator lets one depict the processes of any complexity and length, as well as design the Flowchart either vertically or horizontally.
How Do You Make a Histogram?
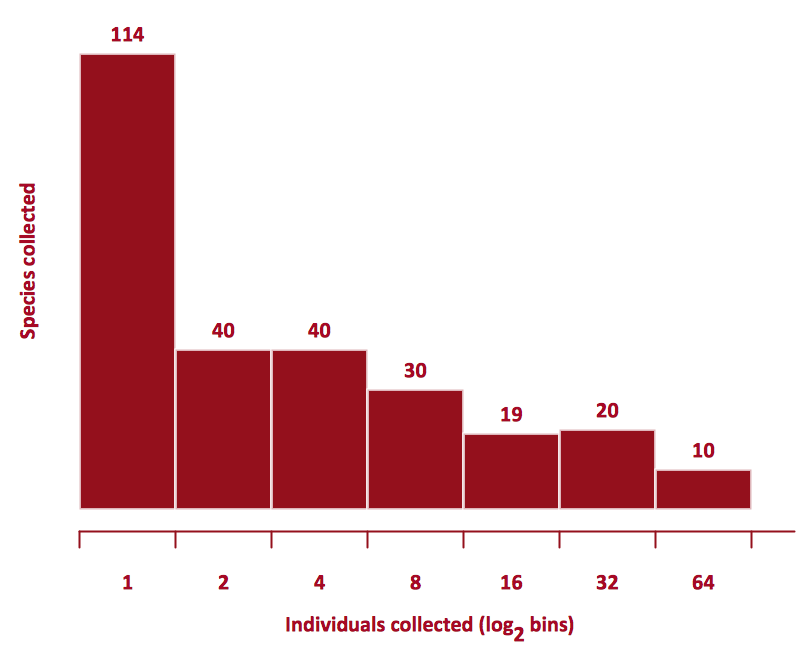
How do you make a histogram usually? Drawing of histogram is quite complex and lengthy process. Usually you have a set of data and you draw free-hand your diagram according to these data. But now thanks to the ConceptDraw DIAGRAM diagramming and vector drawing software extended with Histograms solution from the Graphs and Charts Area of ConceptDraw Solution Park this process became simple and fast.How To Make Histogram in ConceptDraw DIAGRAM ?
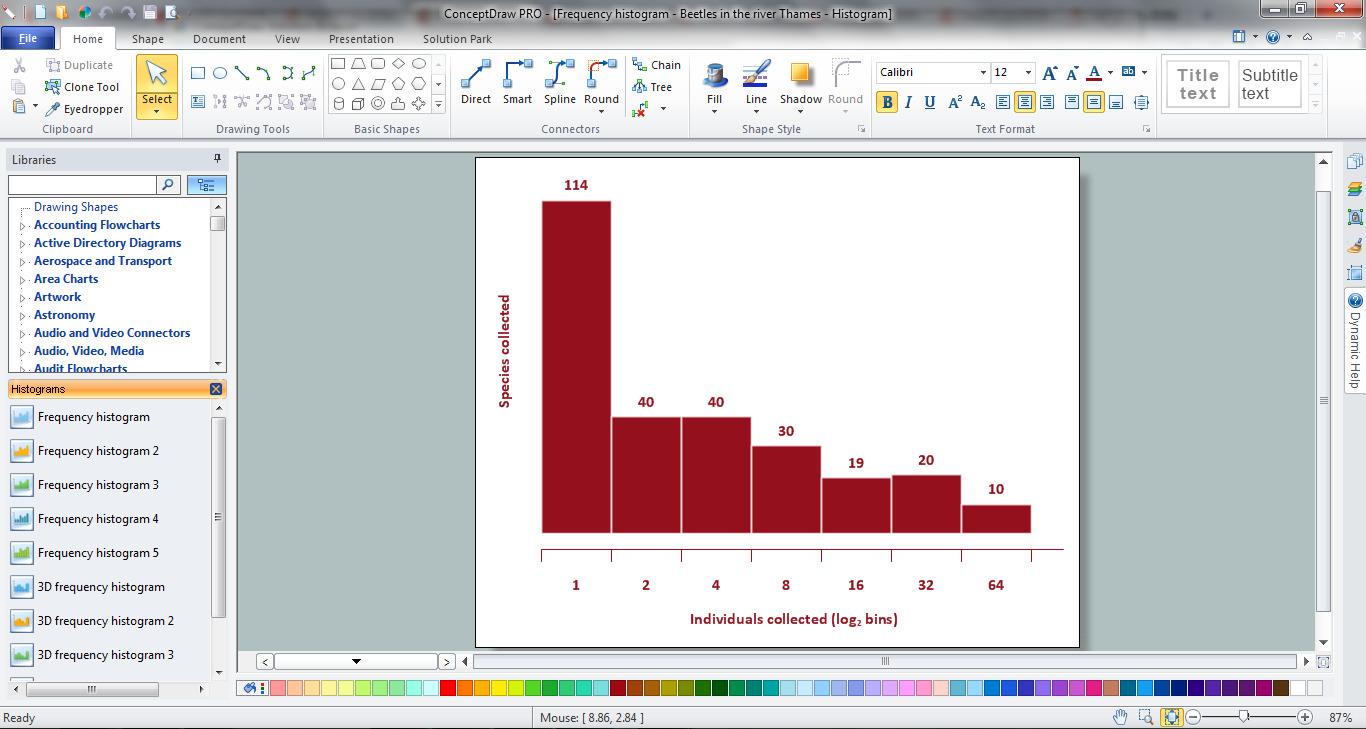
How to make histogram in ConceptDraw DIAGRAM ? ConceptDraw DIAGRAM diagramming and vector drawing software is the best choice for making professional looking Histograms. ConceptDraw DIAGRAM provides Histograms solution from the Graphs and Charts Area of ConceptDraw Solution Park.Histogram
ConceptDraw DIAGRAM diagramming and vector drawing software offers the Histograms solution from the Graphs and Charts area of ConceptDraw Solution Park with powerful tools to help you draw a Histogram of any complexity quick and easy.
 Interactive Voice Response Diagrams
Interactive Voice Response Diagrams solution extends ConceptDraw DIAGRAM software with samples, templates and libraries of ready-to-use vector stencils that help create Interactive Voice Response (IVR) diagrams illustrating in details a work of interactive voice response system, the IVR system’s logical and physical structure, Voice-over-Internet Protocol (VoIP) diagrams, and Action VoIP diagrams with representing voice actions on them, to visualize how the computers interact with callers through voice recognition and dual-tone multi-frequency signaling (DTMF) keypad inputs.
- Pyramid Diagram | Audit Flowcharts | Top 5 Android Flow Chart ...
- 5 level pyramid model diagram of information systems types | 4 level ...
- Pyramid Diagram | Pyramid Diagram | 4 Level pyramid model ...
- Pyramid Diagram | 5 level pyramid model diagram of information ...
- Pyramid Diagram
- Pyramid Diagram
- Pyramid Diagram | Account Flowchart Stockbridge System ...
- Types of Flowchart - Overview | Process Flowchart | Pyramid ...
- Pyramid Diagram
- Types of Flowchart - Overview | Basic Flowchart Symbols | Pyramid ...
- 3 level pyramid model diagram of information systems types | 5 level ...
- Entity-Relationship Diagram (ERD) | Pyramid Diagrams | Types of ...
- Pyramid Diagram
- Process Flowchart | 5 Level pyramid model diagram - Information ...
- Flowchart Process Example | Pyramid Chart Examples | Business ...
- 4 Level pyramid model diagram - Information systems types | 5 Level ...
- 3 level pyramid model diagram of information systems types | 5 level ...
- 5 Level pyramid model diagram - Information systems types | 4 Level ...
- Pyramid Diagram and Pyramid Chart | Looking at ConceptDraw ...
- Pyramid Chart Examples | Marketing Diagrams | Fishbone Diagram ...


