Basic Flowchart Symbols and Meaning


Mechanical Drawing Symbols

The vector stencils library "Sales flowchart" contains 62 sales process flow chart symbols.
Use these flow chart icon set to draw your sales flowcharts, workflow diagrams and process charts with the ConceptDraw PRO diagramming and vector drawing software.
The sales process flowchart symbols library "Sales flowchart" is included in the Sales Flowcharts solution from the Marketing area of ConceptDraw Solution Park.
Annotation

Card

Check / audit (diamond)
-sales-flowchart---vector-stencils-library.png--diagram-flowchart-example.png)
Check / audit (square)
-sales-flowchart---vector-stencils-library.png--diagram-flowchart-example.png)
Collate

Comment / note symbol (brace)
-sales-flowchart---vector-stencils-library.png--diagram-flowchart-example.png)
Communication link

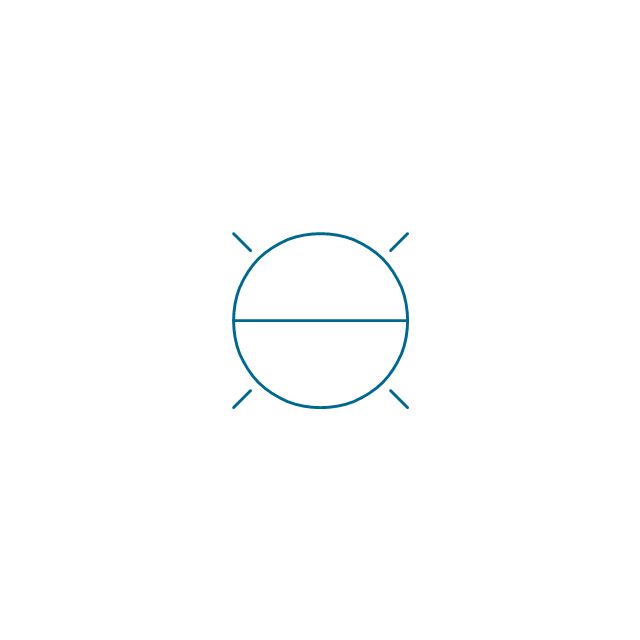
Compare (diamond)
-sales-flowchart---vector-stencils-library.png--diagram-flowchart-example.png)
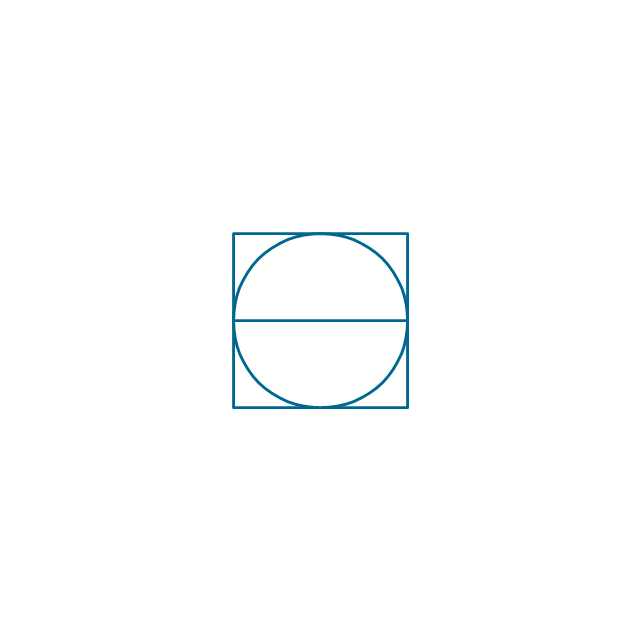
Compare (square)
-sales-flowchart---vector-stencils-library.png--diagram-flowchart-example.png)
Completed form

Concurrency symbol (fork / join)
-sales-flowchart---vector-stencils-library.png--diagram-flowchart-example.png)
Conditional selector

Control transfer

Database

Data input / output

Decision

Decision indicator - No

Decision indicator - Yes

Delay

Direct access storage

Disk storage

Display

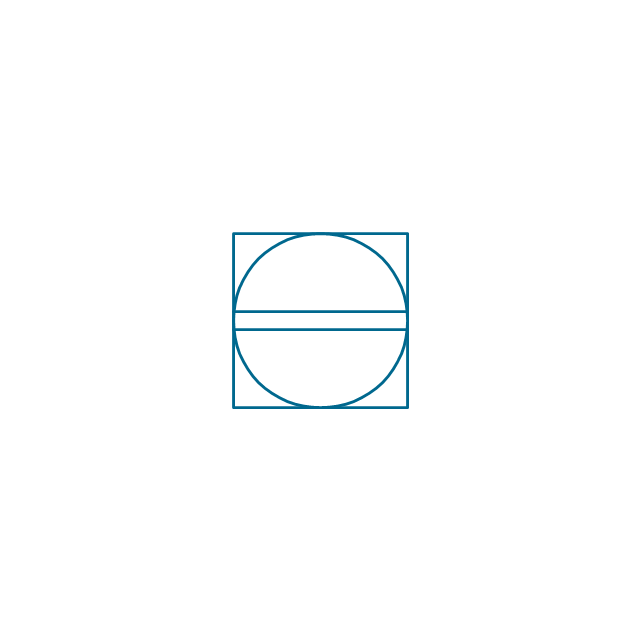
Divided process (table view)
-sales-flowchart---vector-stencils-library.png--diagram-flowchart-example.png)
Document

Entity (rounded)
-sales-flowchart---vector-stencils-library.png--diagram-flowchart-example.png)
Event

Extract

Flow line

Internal storage

Junction symbol

Lined document

Lined / shaded process

Loop limit

Manual file

Manual input

Manual operation

Merge

Multi document

Multi process

Off-page reference - arrow
Off-page reference - incoming

Off-page reference - outgoing

On-page reference/ Inspection point

Or

Page

Paper tape

Predefined process

Prepare conditional

Process step

Reference point

Sequential access storage

Sort

Start (circle)
-sales-flowchart---vector-stencils-library.png--diagram-flowchart-example.png)
Start (ellipse)
-sales-flowchart---vector-stencils-library.png--diagram-flowchart-example.png)
Stickman pictogram

Stored data

Summary

Tagged document

Tagged process

Terminal point

Title block

Torso pictogram

The vector stencils library "HR flowchart" contains 62 flowchart symbols.
Use it to draw your HR flowcharts, workflow diagrams and process charts with the ConceptDraw PRO diagramming and vector drawing software.
The flow chart symbols library "HR flowchart" is included in the HR Flowcharts solution from the Management area of ConceptDraw Solution Park.
Use it to draw your HR flowcharts, workflow diagrams and process charts with the ConceptDraw PRO diagramming and vector drawing software.
The flow chart symbols library "HR flowchart" is included in the HR Flowcharts solution from the Management area of ConceptDraw Solution Park.
Annotation

Card

Check / audit (diamond)
-hr-flowchart---vector-stencils-library.png--diagram-flowchart-example.png)
Check / audit (square)
-hr-flowchart---vector-stencils-library.png--diagram-flowchart-example.png)
Collate

Comment / note symbol (brace)
-hr-flowchart---vector-stencils-library.png--diagram-flowchart-example.png)
Communication link

Compare (diamond)
-hr-flowchart---vector-stencils-library.png--diagram-flowchart-example.png)
Compare (square)
-hr-flowchart---vector-stencils-library.png--diagram-flowchart-example.png)
Completed form

Concurrency symbol (fork / join)
-hr-flowchart---vector-stencils-library.png--diagram-flowchart-example.png)
Conditional selector

Control transfer

Data input / output

Database

Decision

Decision indicator - No

Decision indicator - Yes

Delay

Direct access storage

Disk storage

Display

Divided process (table view)
-hr-flowchart---vector-stencils-library.png--diagram-flowchart-example.png)
Document

Entity (rounded)
-hr-flowchart---vector-stencils-library.png--diagram-flowchart-example.png)
Event

Extract

Flow line

Internal storage

Junction symbol

Lined document

Lined / shaded process

Loop limit

Manual file

Manual input

Manual operation

Merge

Multi document

Multi process

Off-page reference - arrow
Off-page reference - incoming

Off-page reference - outgoing

On-page reference/ Inspection point

Or

Page

Paper tape

Predefined process

Prepare conditional

Process step

Reference point

Sequential access storage

Sort

Start (circle)
-hr-flowchart---vector-stencils-library.png--diagram-flowchart-example.png)
Start (ellipse)
-hr-flowchart---vector-stencils-library.png--diagram-flowchart-example.png)
Stickman pictogram

Stored data

Summary

Tagged document

Tagged process

Terminal point

Title block

Torso pictogram

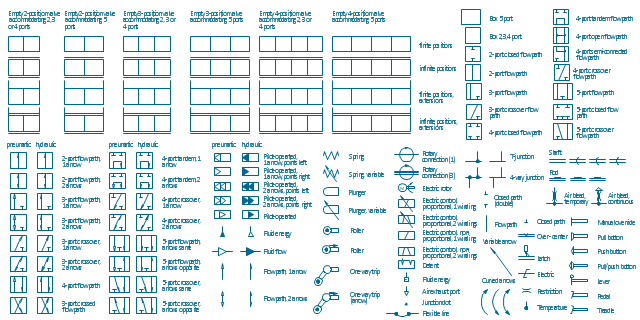
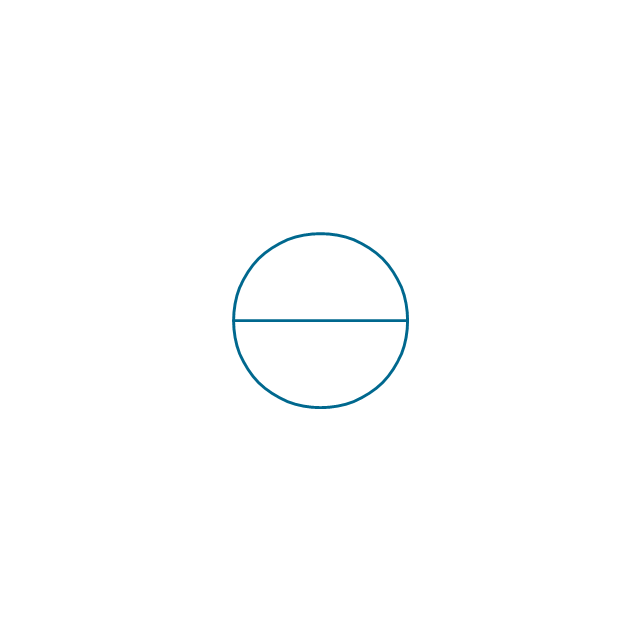
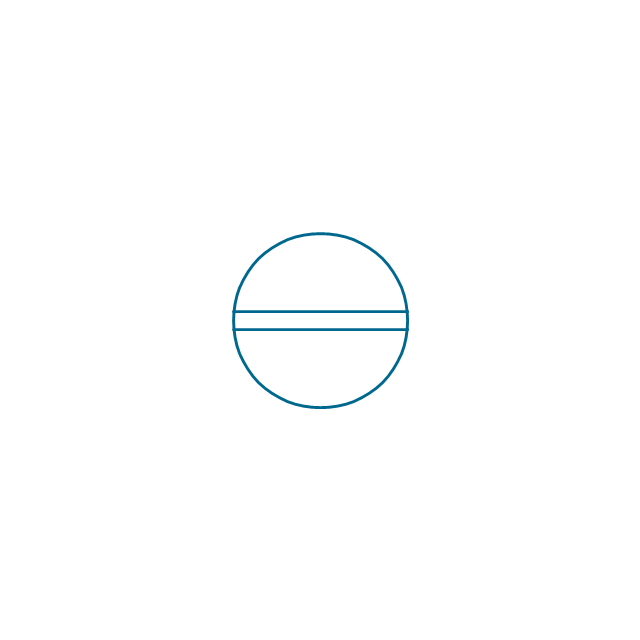
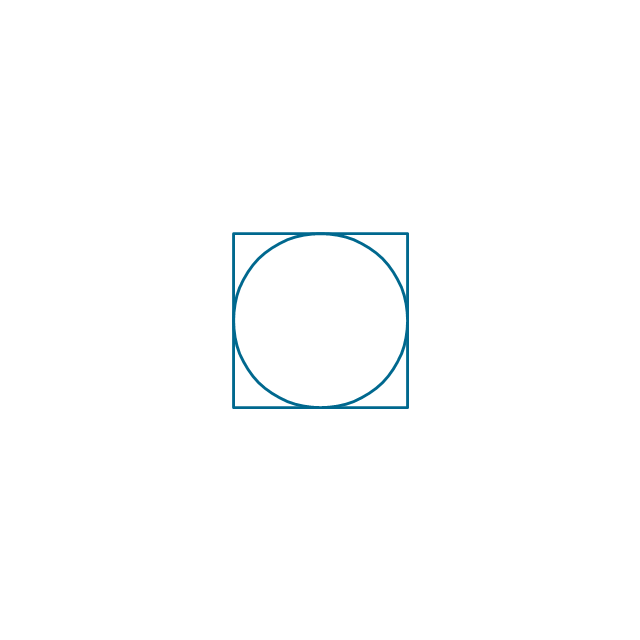
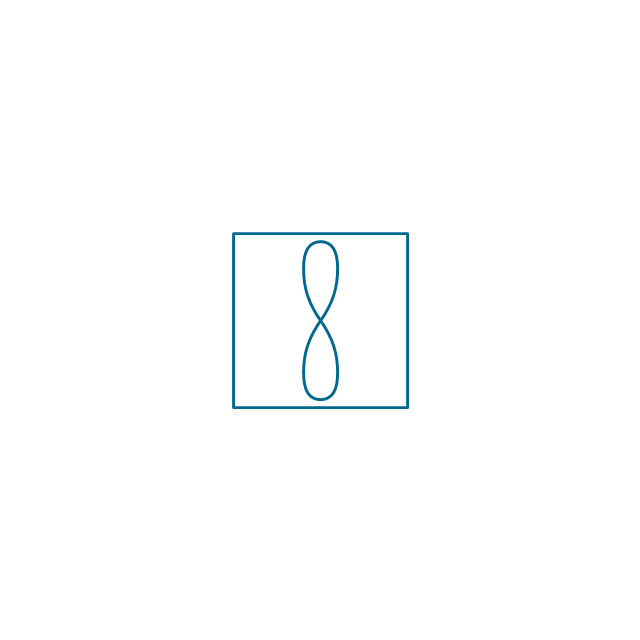
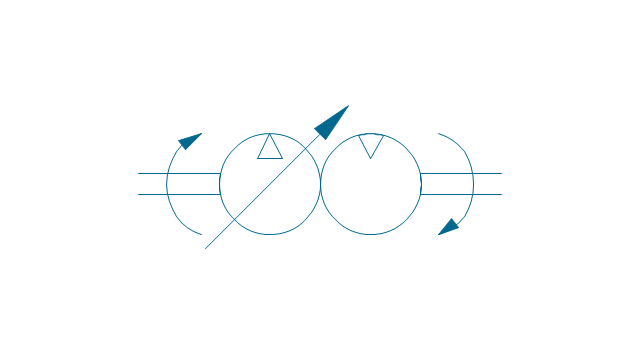
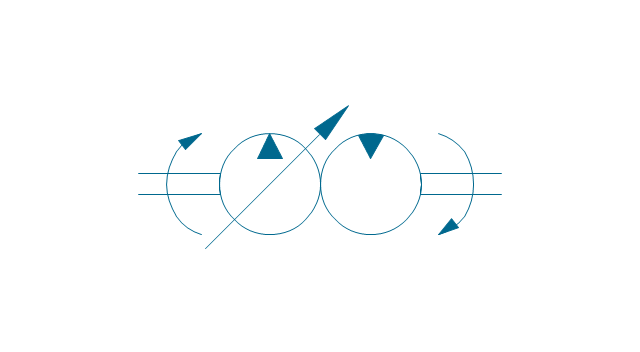
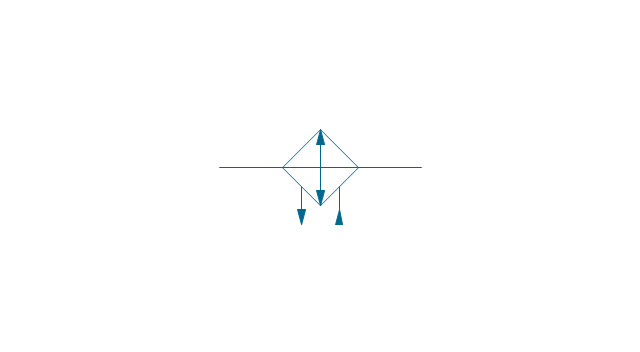
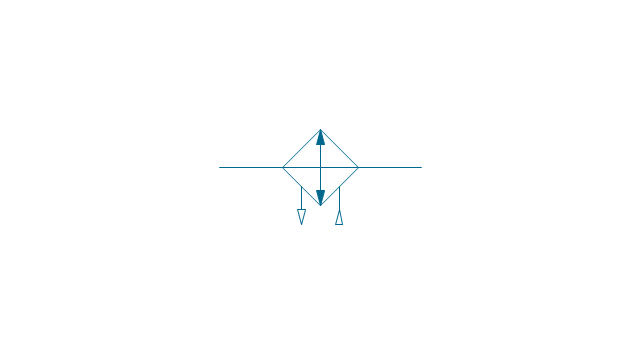
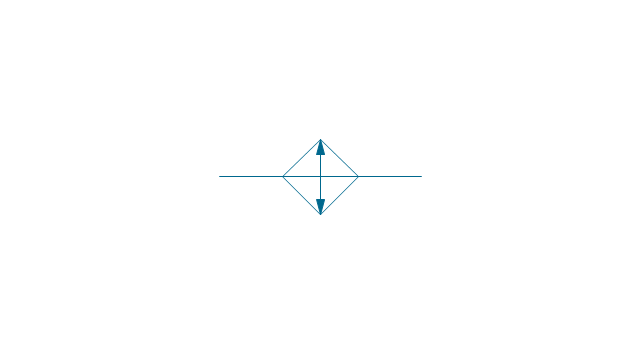
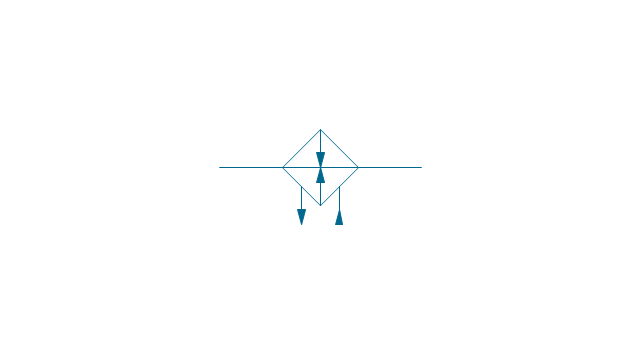
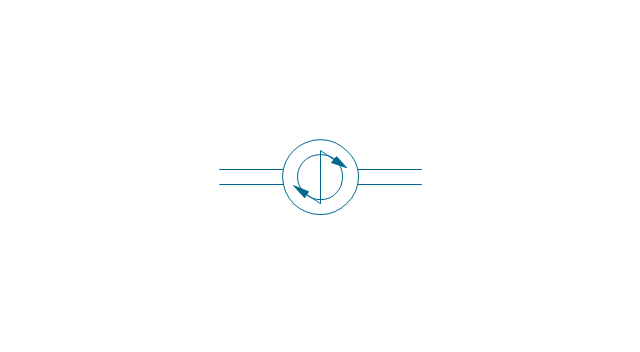
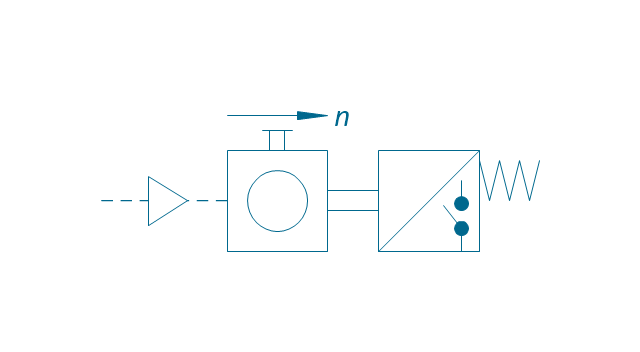
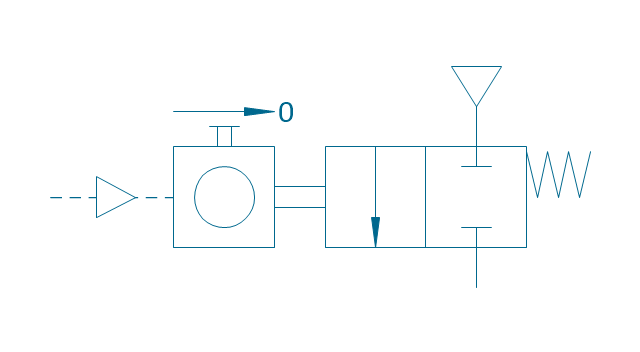
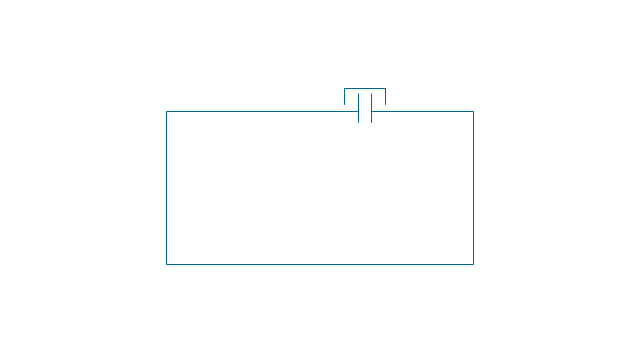
The vector stencils library "Valve assembly" contains 141 symbols of pressure and flow regulators, flow direction indicators, controls, and symbols to design flow paths of control valves.
Use these valve assembly shapes to design the engineering drawings of hydraulic and pneumatic valve assemblies in fluid power systems.
"Control valves are valves used to control conditions such as flow, pressure, temperature, and liquid level by fully or partially opening or closing in response to signals received from controllers that compare a "setpoint" to a "process variable" whose value is provided by sensors that monitor changes in such conditions.
The opening or closing of control valves is usually done automatically by electrical, hydraulic or pneumatic actuators. Positioners are used to control the opening or closing of the actuator based on electric, or pneumatic signals.
A control valve consists of three main parts in which each part exist in several types and designs: Valve's actuator, Valve's positioner, Valve's body.
" [Control valves. Wikipedia]
The shapes example "" was created using the ConceptDraw PRO diagramming and vector drawing software extended with the Mechanical Engineering solution from the Engineering area of ConceptDraw Solution Park.
Valve assembly symbols
Types of Flowcharts


Dashboard

Probability Quality Control Tools

Quality Improvement

TQM Diagram — Professional Total Quality Management

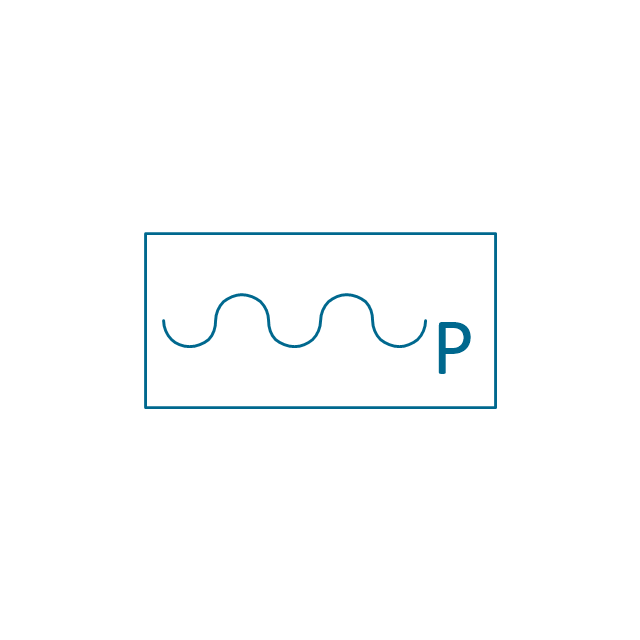
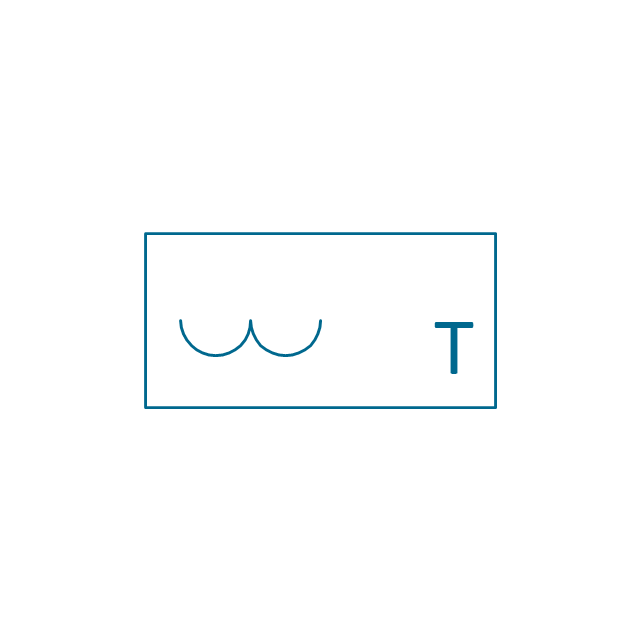
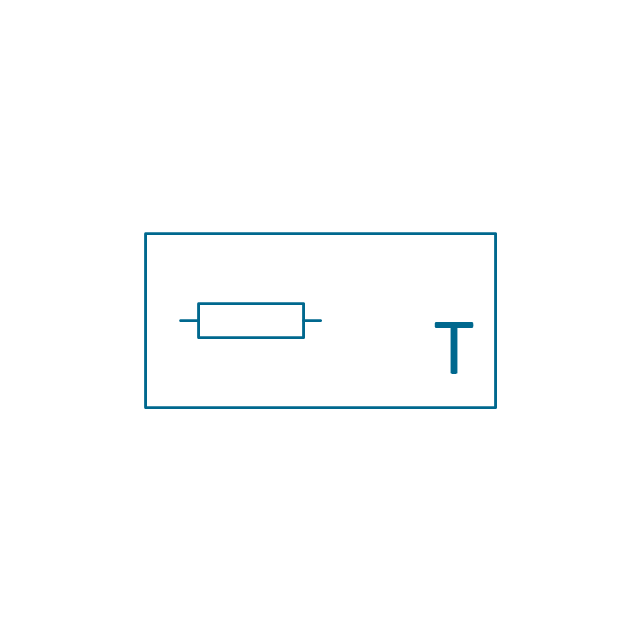
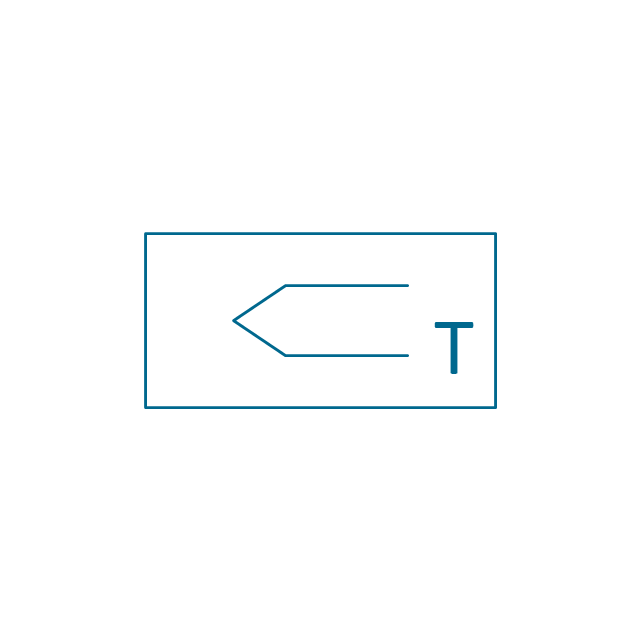
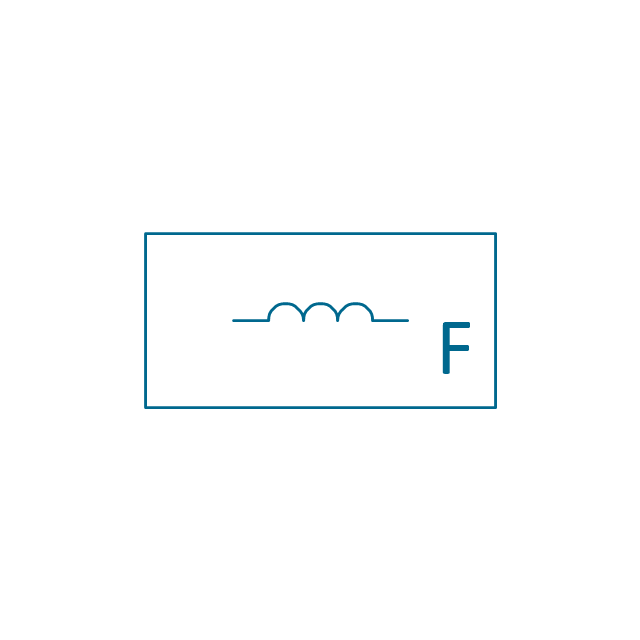
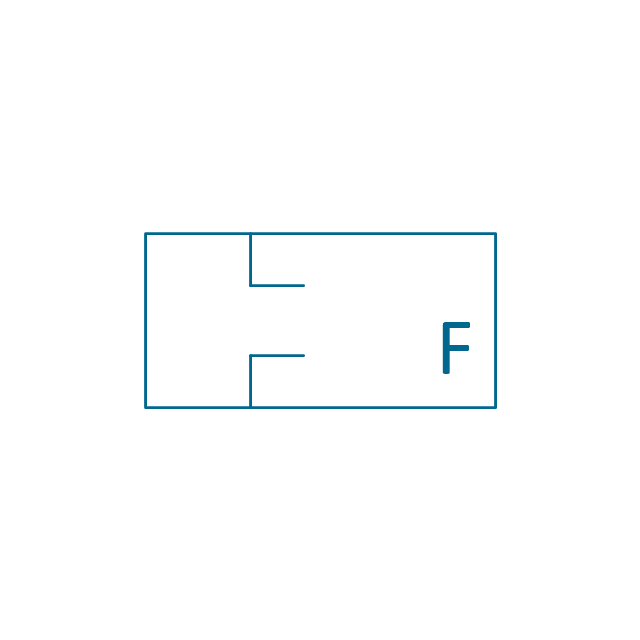
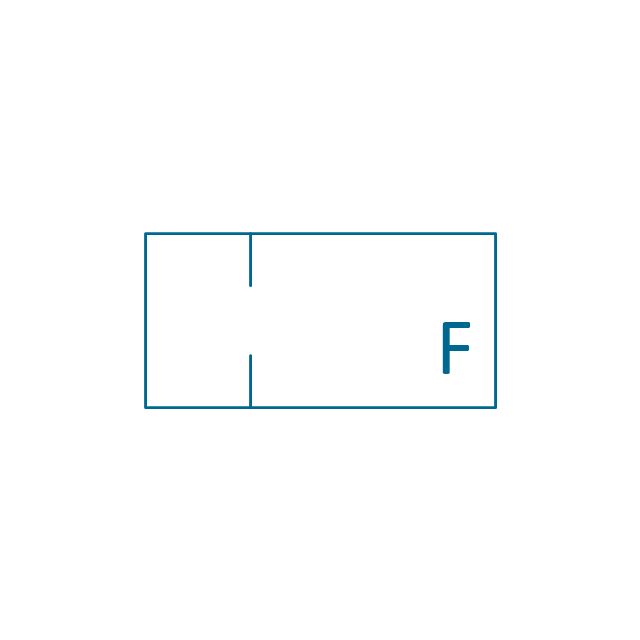
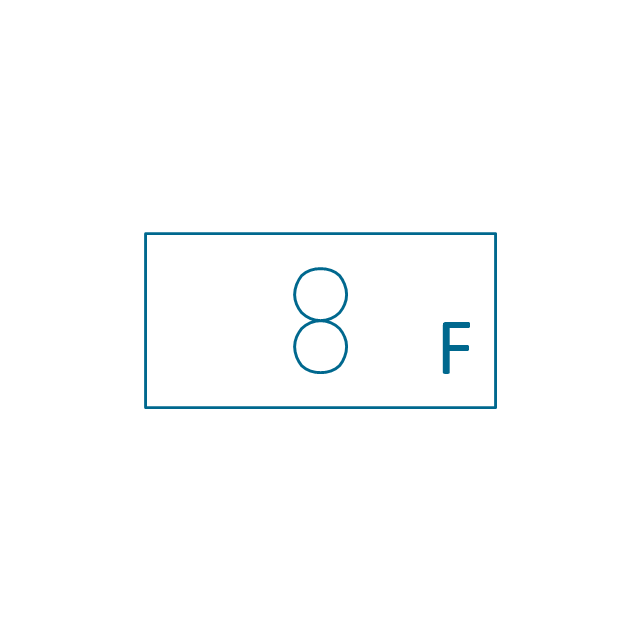
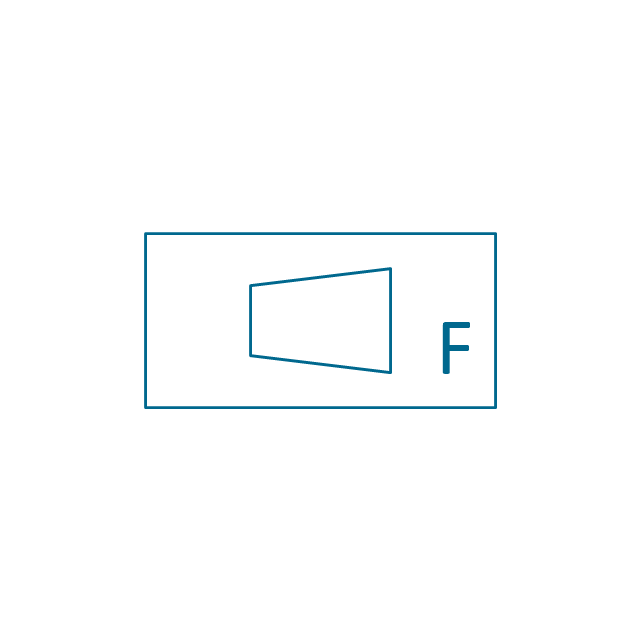
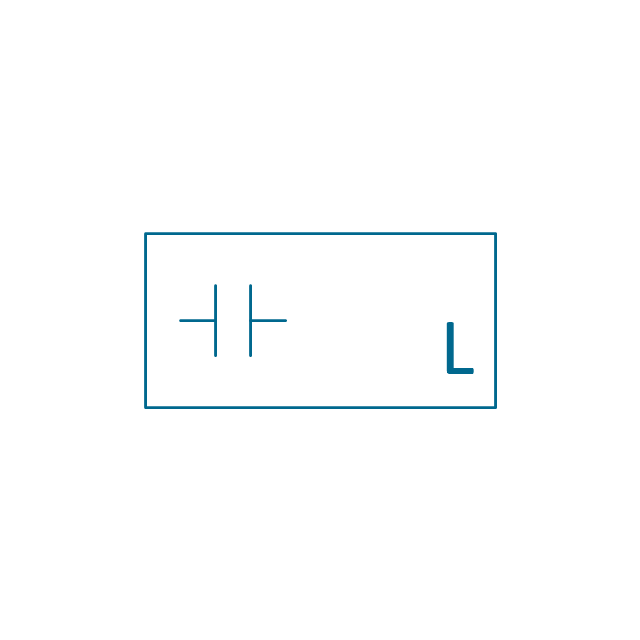
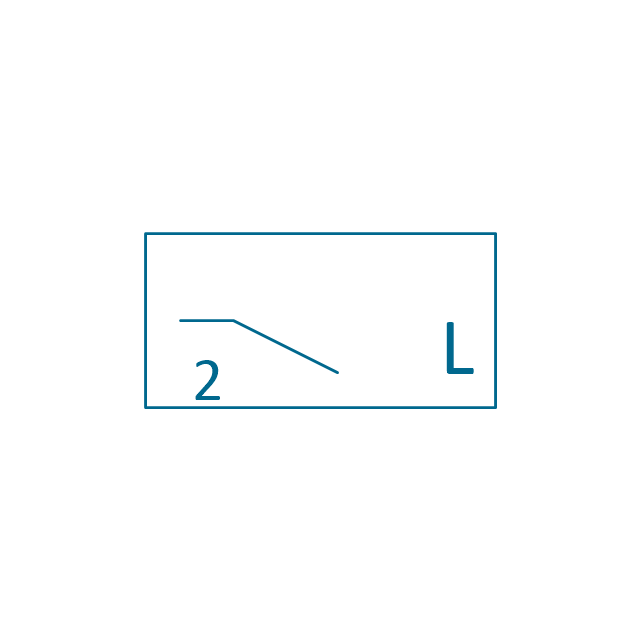
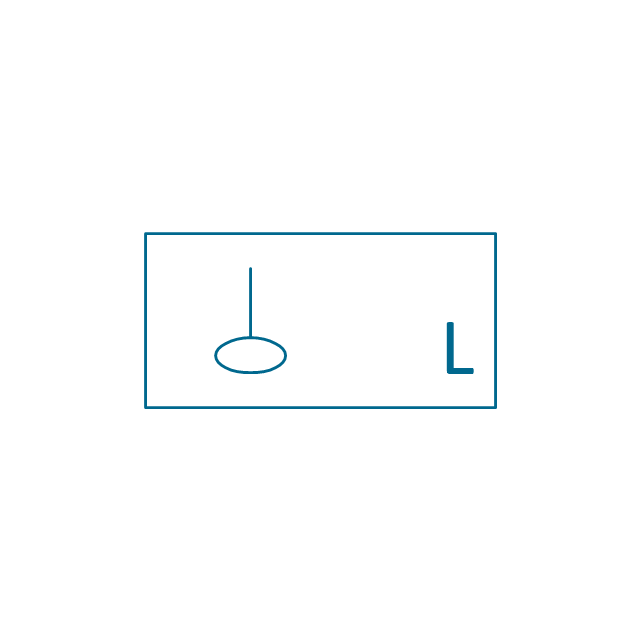
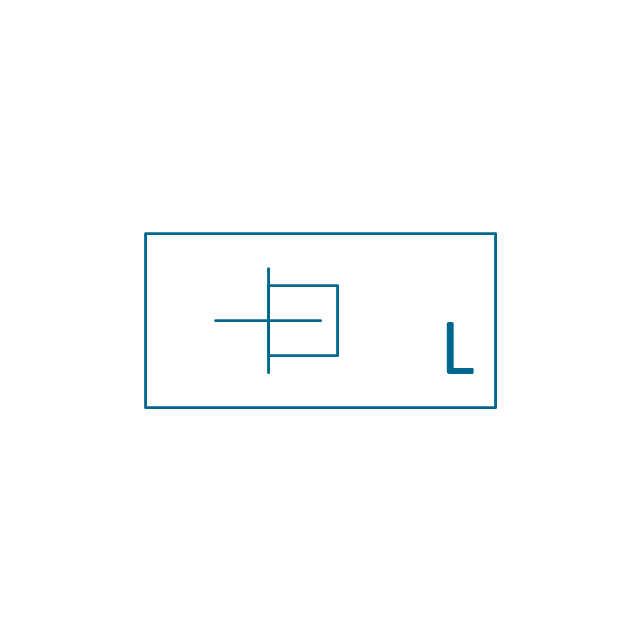
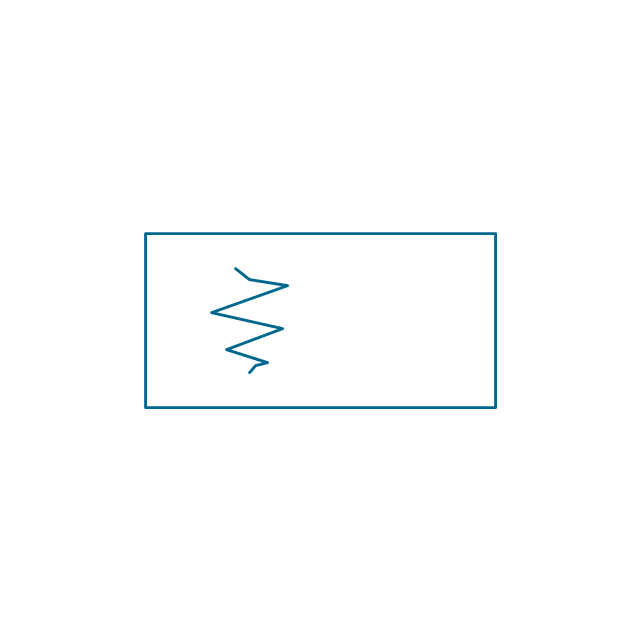
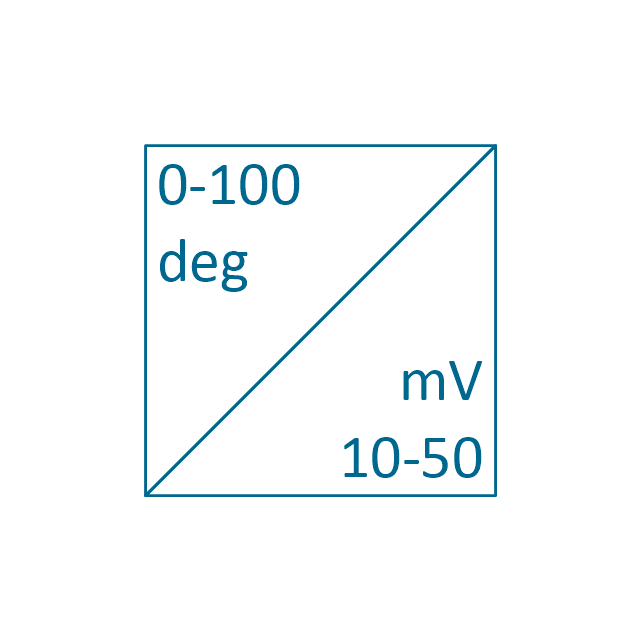
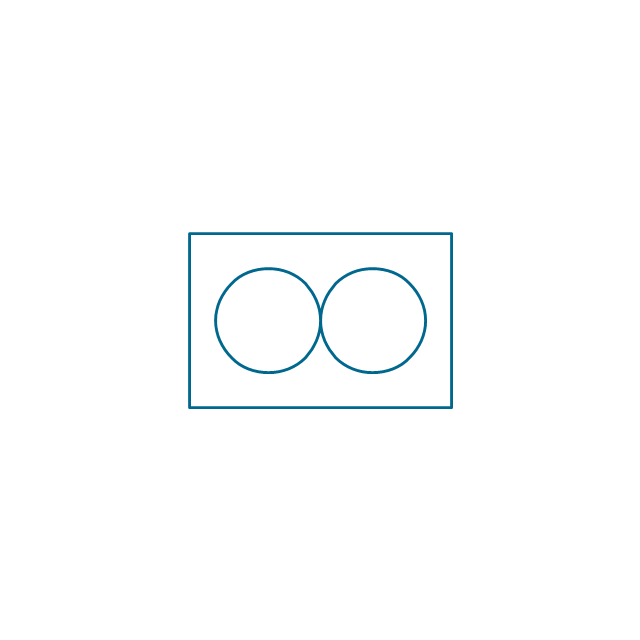
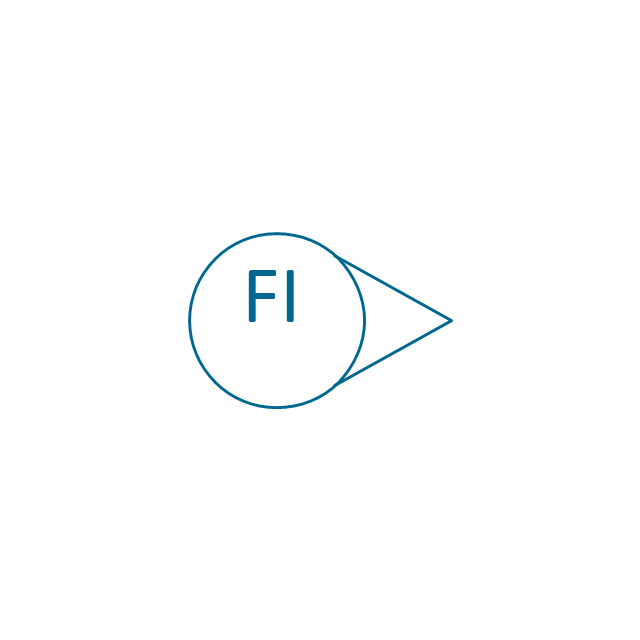
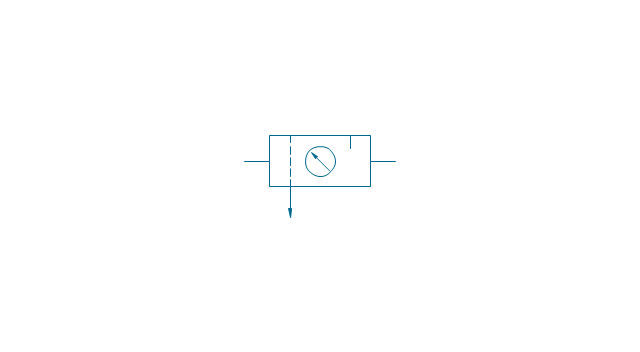
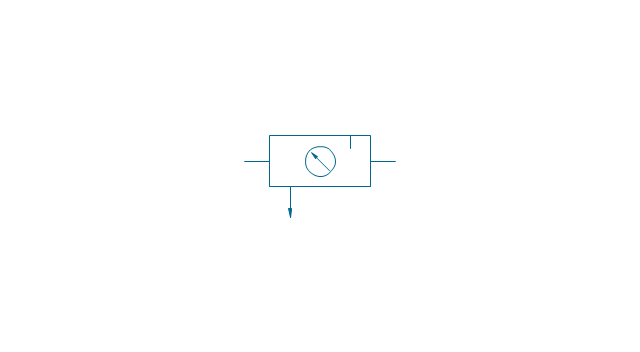
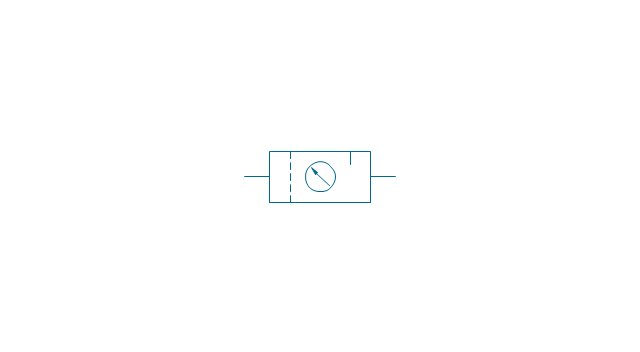
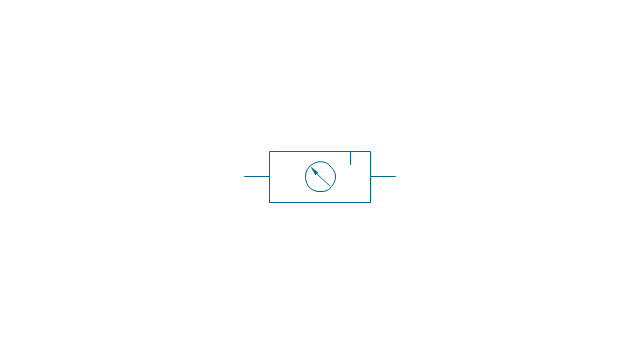
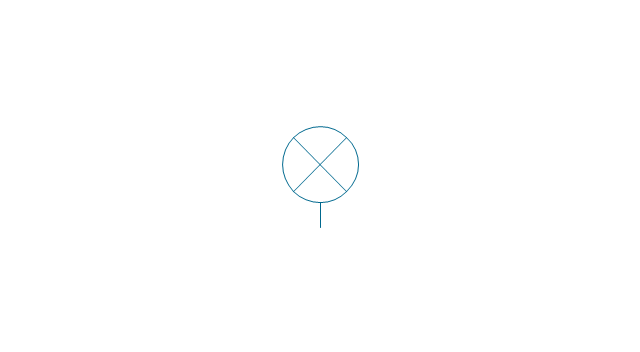
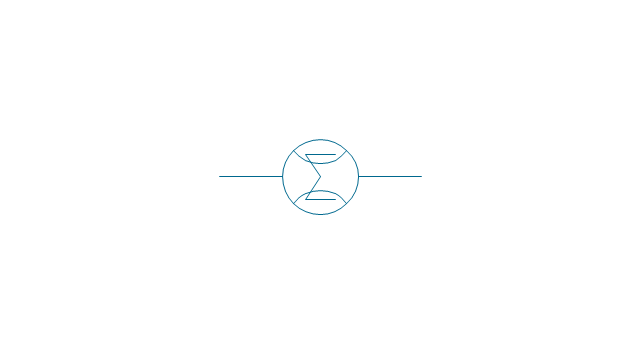
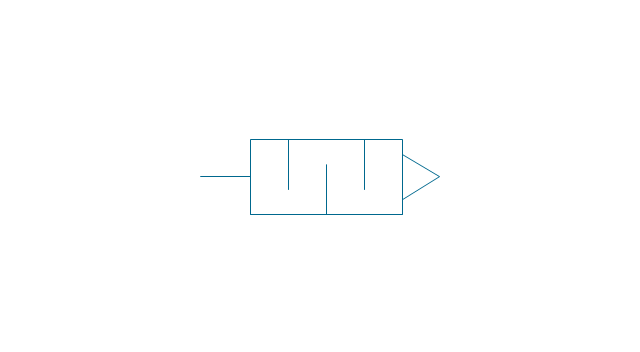
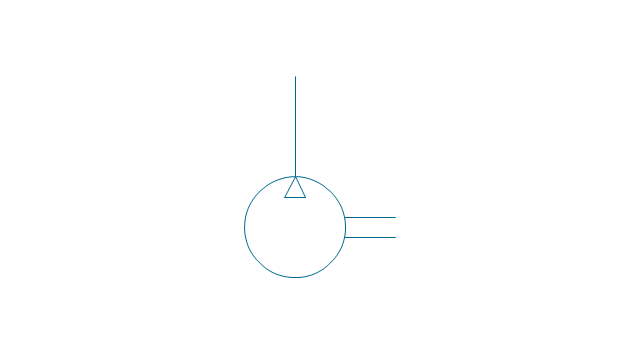
The vector stencils library "Instruments" contains 72 symbols of control instruments and measuring devices: meters and gauges, and callouts, text boxes, and inserts.
Use these shapes to create annotated process flow diagrams (PFD), flow control, manufacturing processes, and distribution system diagrams in the ConceptDraw PRO software extended with the Chemical and Process Engineering solution from the Chemical and Process Engineering area of ConceptDraw Solution Park.
www.conceptdraw.com/ solution-park/ engineering-chemical-process
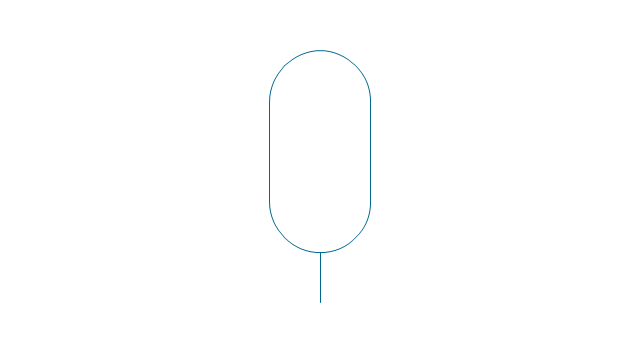
Indicator local

Indicator remote
Indicator auxiliary
CRT local
CRT remote
CRT auxiliary
PLC local

PLC auxiliary

PLC remote

Computer local

Computer auxiliary

Computer remote

Light local

Light remote
Light auxiliary
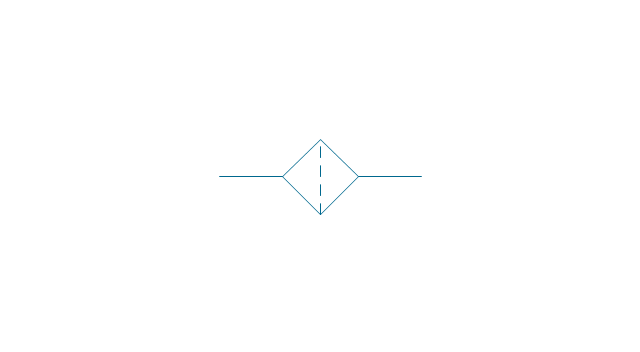
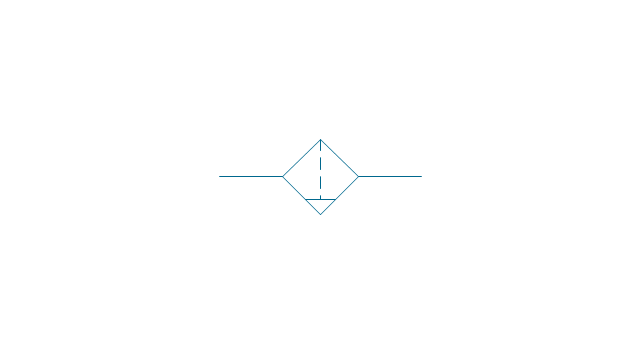
Indicator auxiliary (dashed)
-instruments---vector-stencils-library.png--diagram-flowchart-example.png)
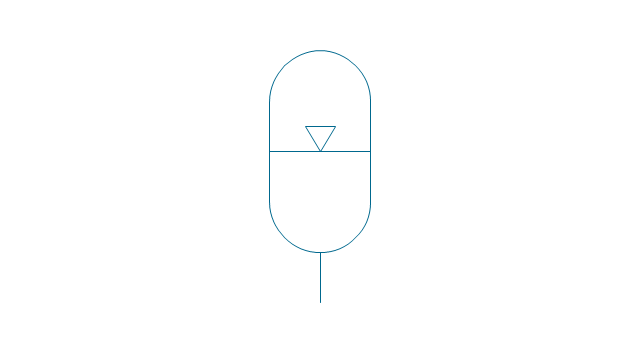
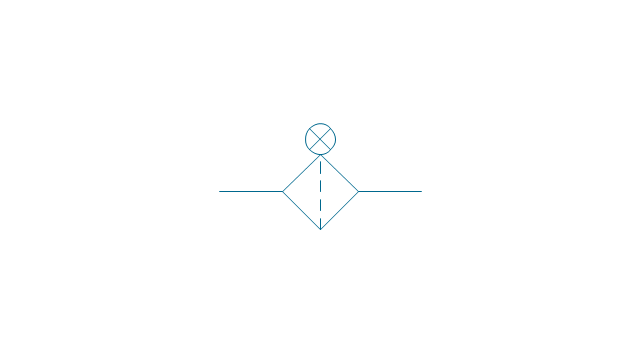
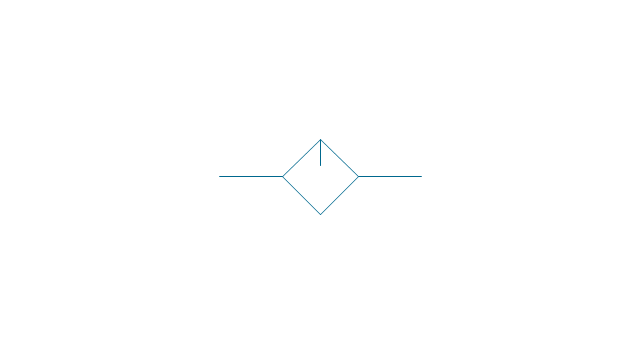
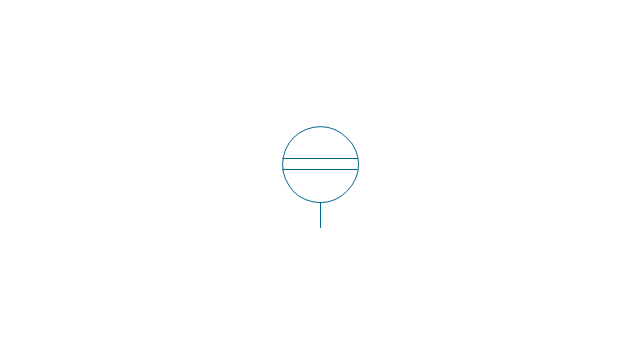
Indicator remote (dashed)
-instruments---vector-stencils-library.png--diagram-flowchart-example.png)
Steam traced auxiliary

Steam traced remote

Steam traced local

Level meter auxiliary
Level meter remote
Level meter local
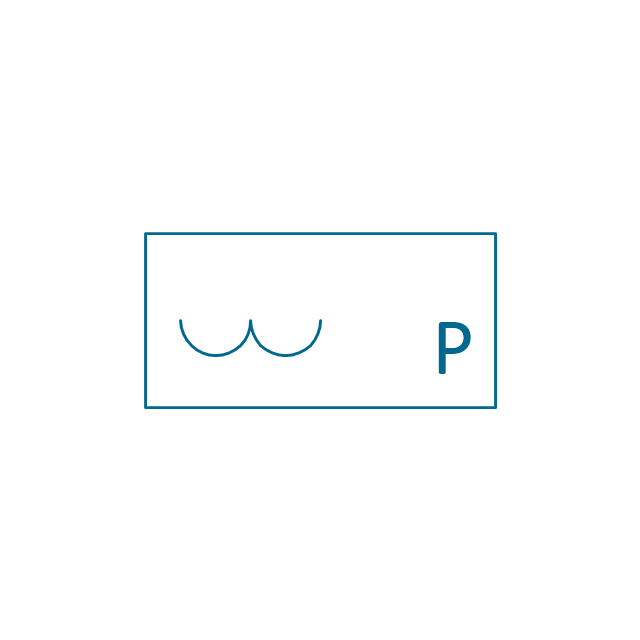
Pressure gauge diaphragm
Pressure gauge
Pressure gauge liquid filled
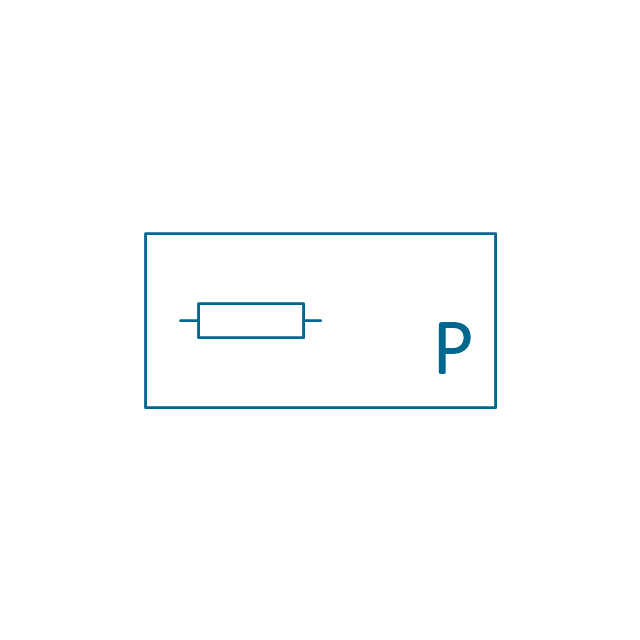
Strain gauge
Thermometer bi-metallic

Thermometer gas
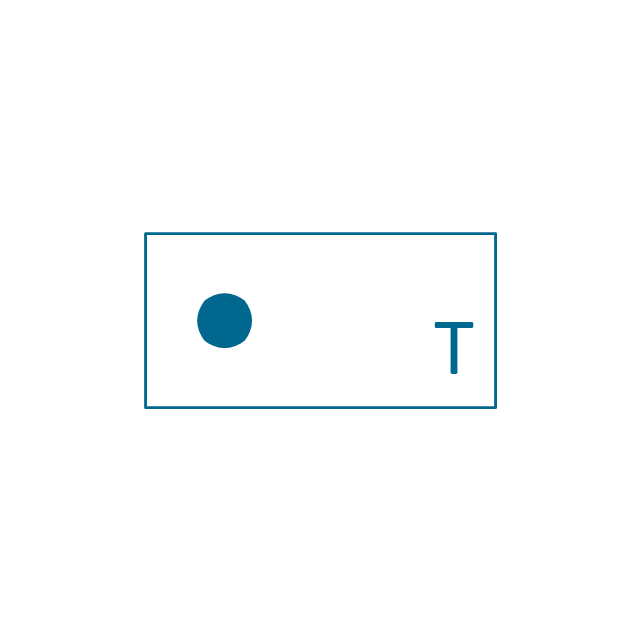
Thermometer general

Thermometer glass

Thermometer liquid
Thermometer resistance
Thermometer thermocouple
Flowmeter electromagnetic
Flowmeter general

Flowmeter nozzle
Flowmeter orifice
Flowmeter positive displacement
Flowmeter turbine

Flowmeter variable area
Flowmeter Venturi

Level meter capacitive
Level meter conductive
Level meter displacer

Level meter float
Level meter general

Level meter sonic
Indicator analoque
Indicator digital
Indicator general

Recorder analoque
Recorder digital
Recorder general
Converter
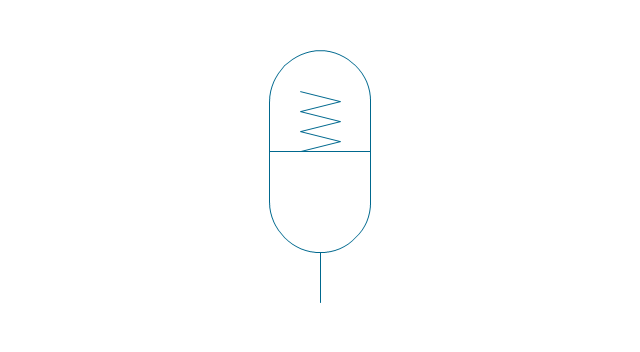
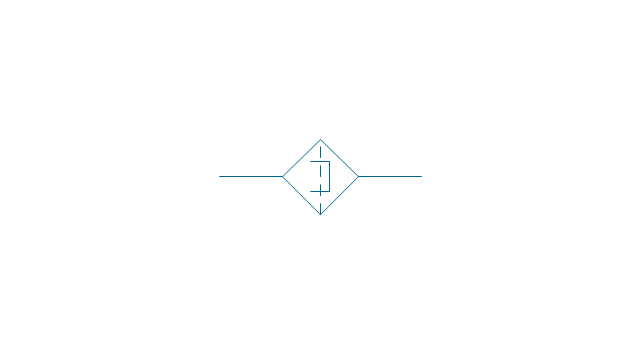
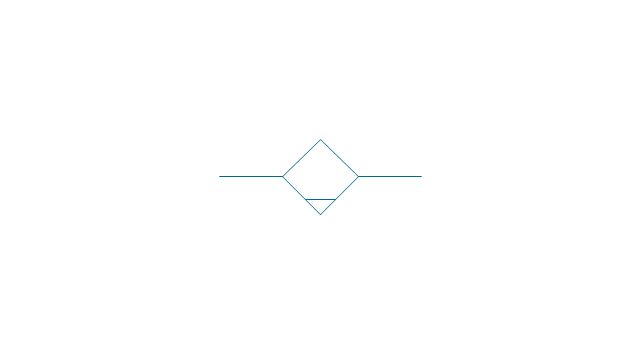
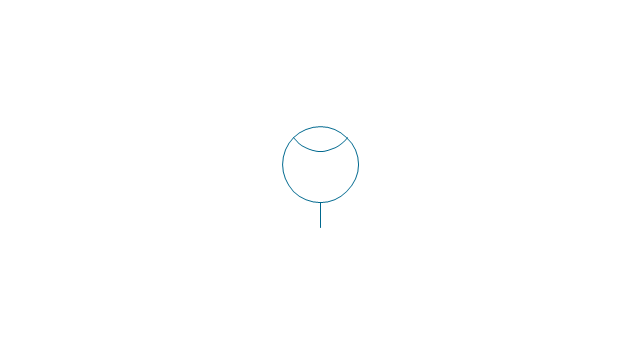
Converter 2 (1st half filled)
-instruments---vector-stencils-library.png--diagram-flowchart-example.png)
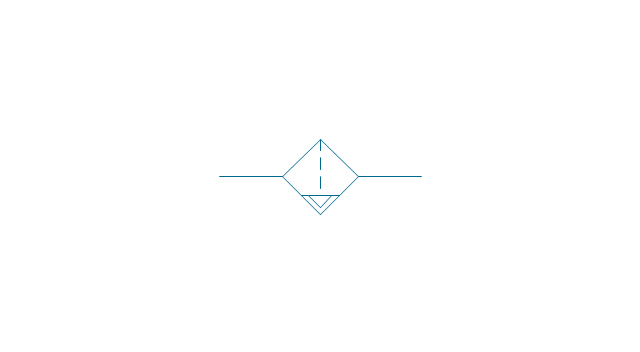
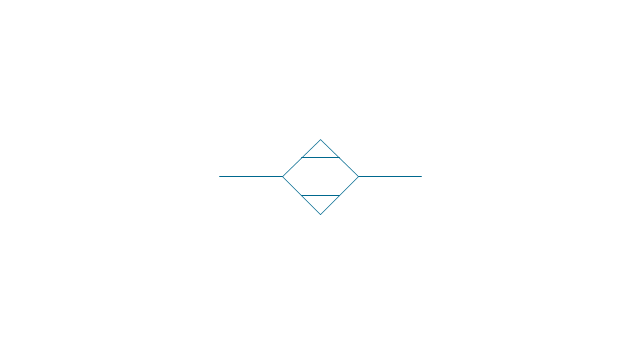
Converter 3 (2nd half filled)
-instruments---vector-stencils-library.png--diagram-flowchart-example.png)
Venturi

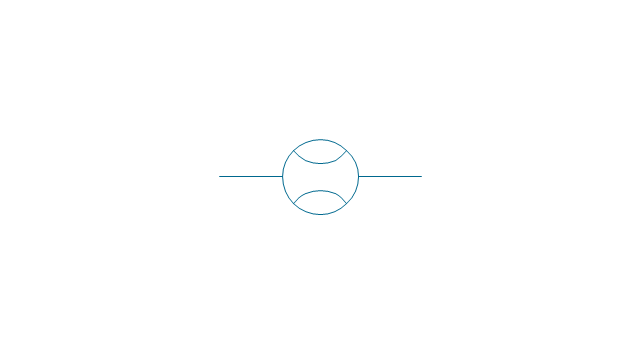
Venturi (pressure taps)
-instruments---vector-stencils-library.png--diagram-flowchart-example.png)
Flowmeter
Rotameter
Vortex sensor

Propeller meter
Generic utility

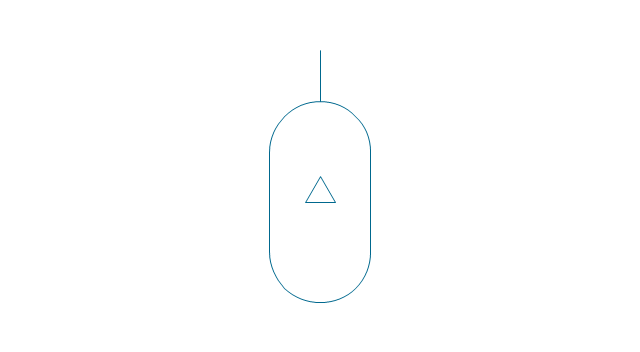
Operator box

Operator box 2 (1st half filled)
-instruments---vector-stencils-library.png--diagram-flowchart-example.png)
Operator box 3 (2nd half filled)
-instruments---vector-stencils-library.png--diagram-flowchart-example.png)
AND gate

OR gate

NOT gate

Correcting element

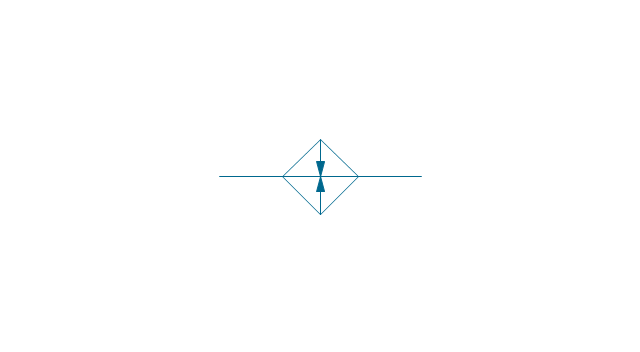
Diamond

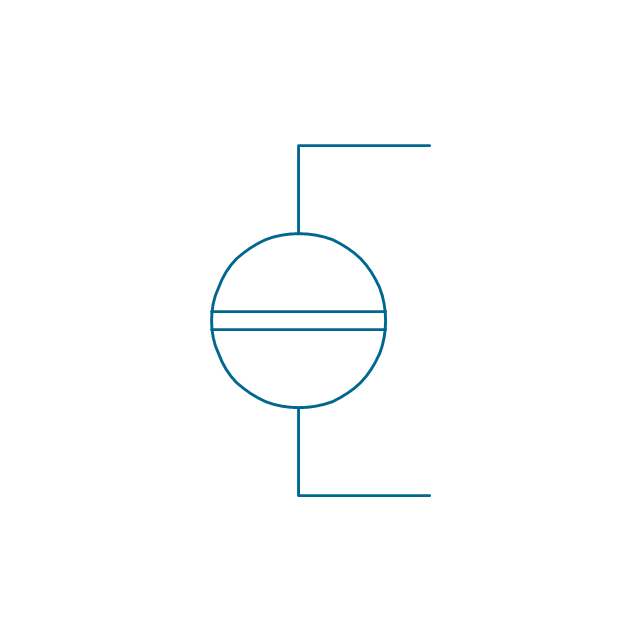
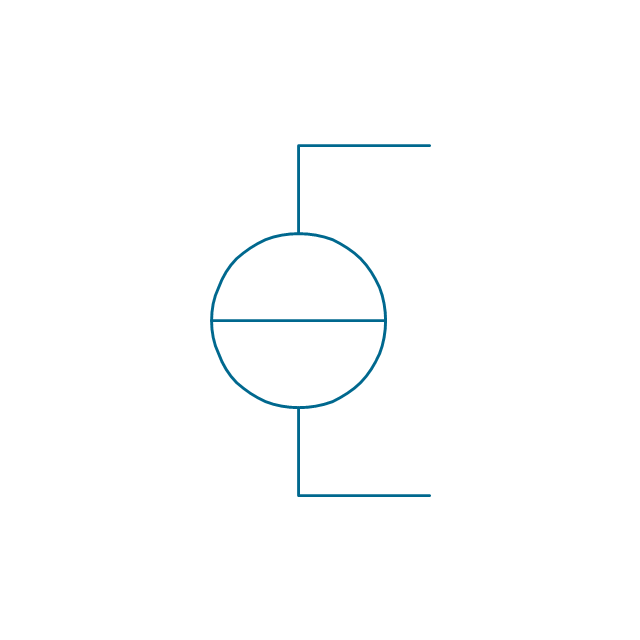
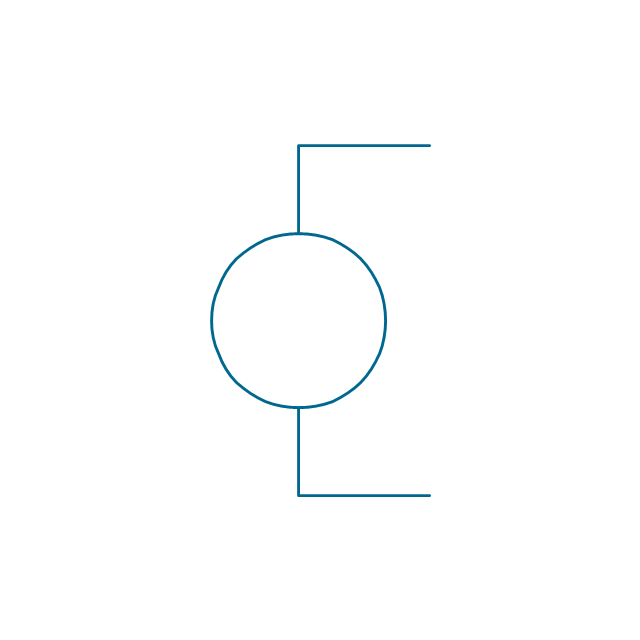
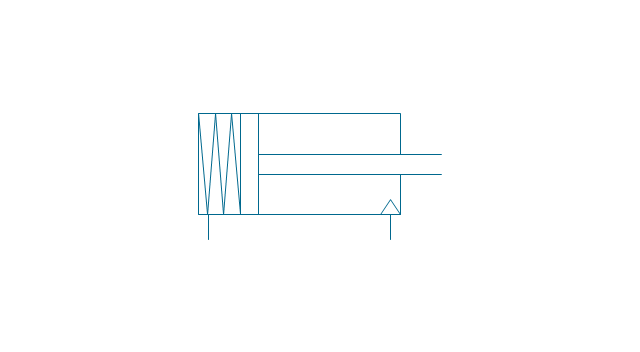
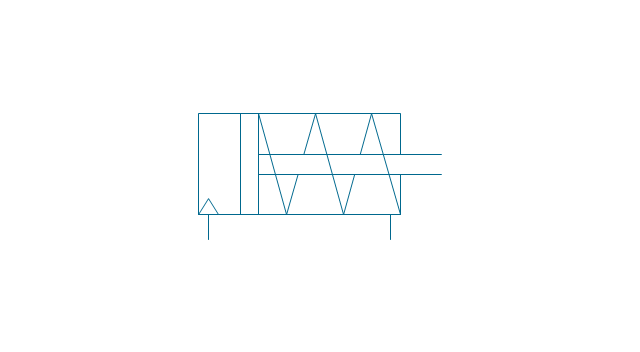
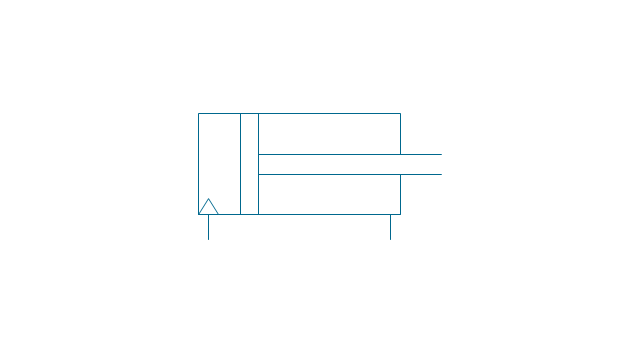
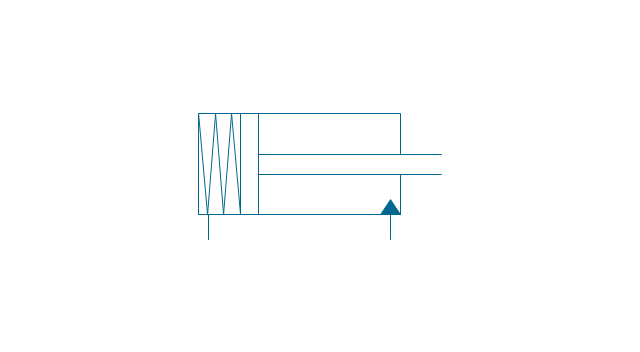
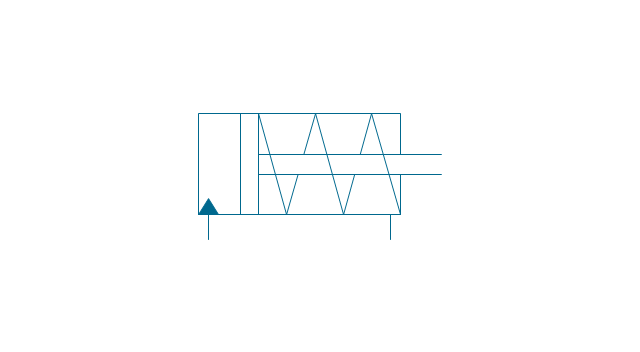
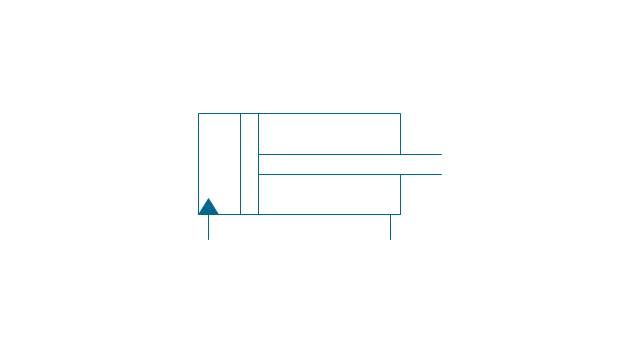
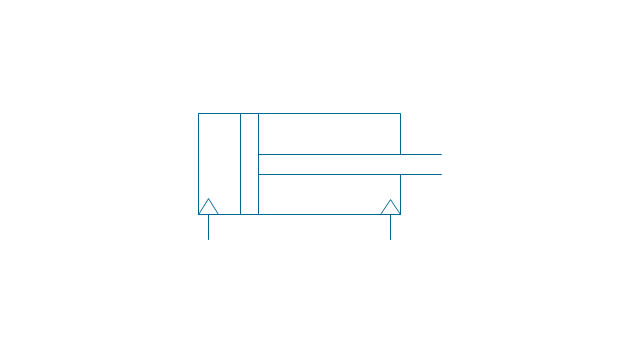
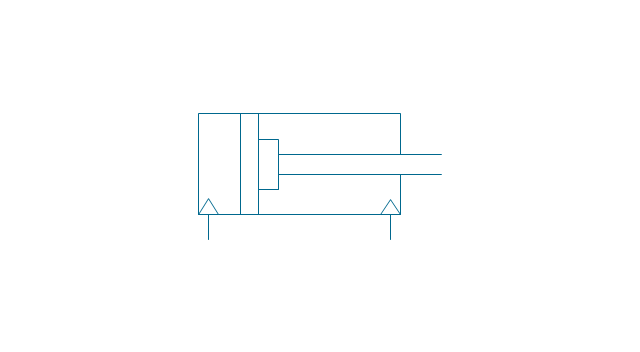
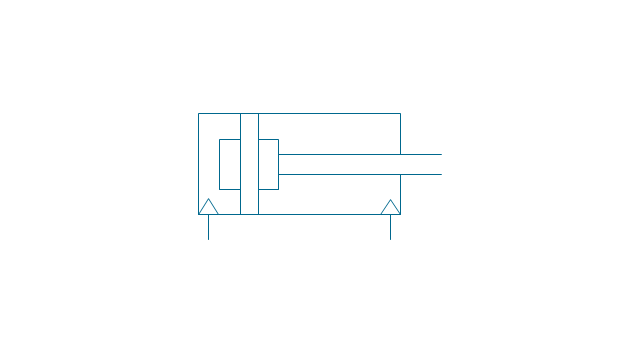
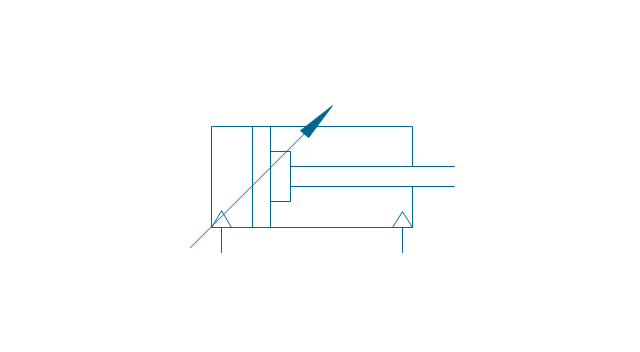
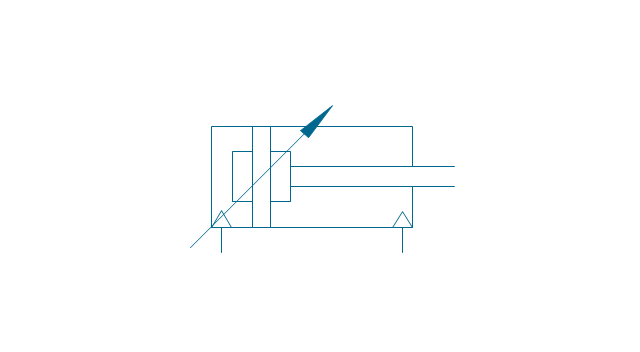
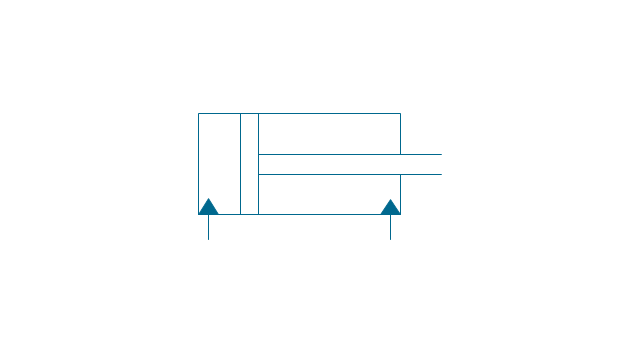
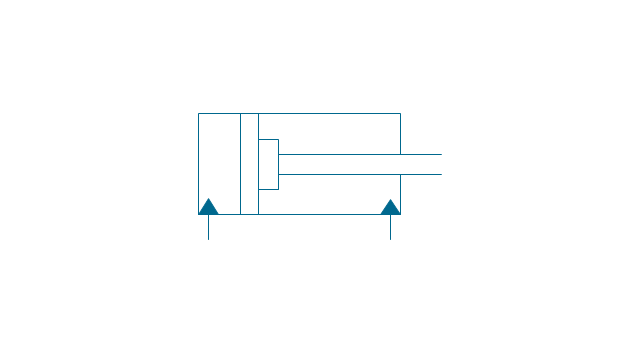
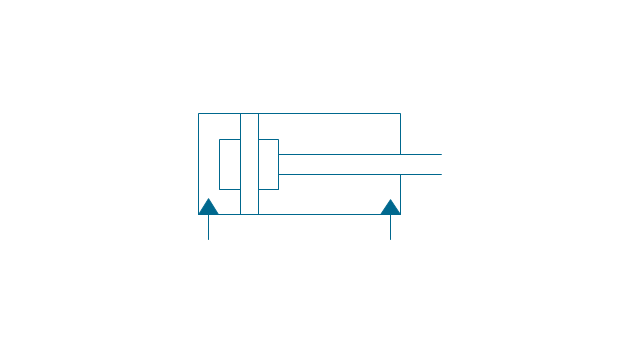
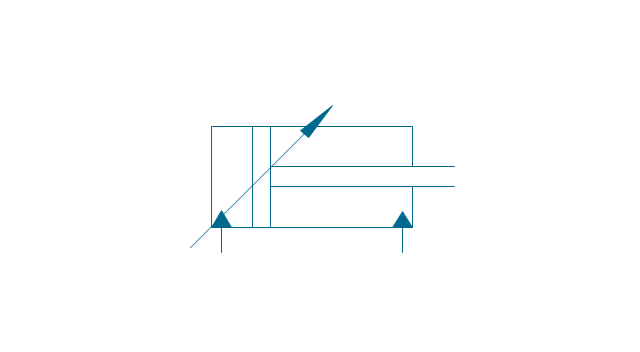
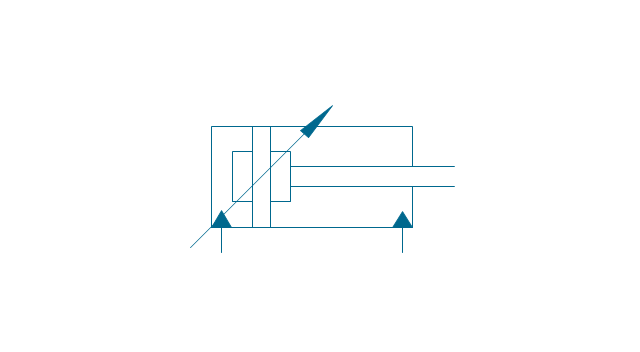
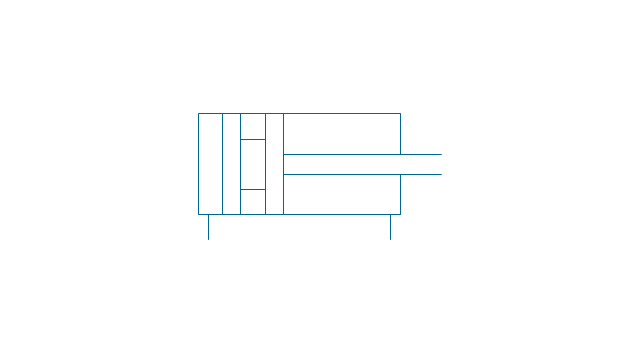
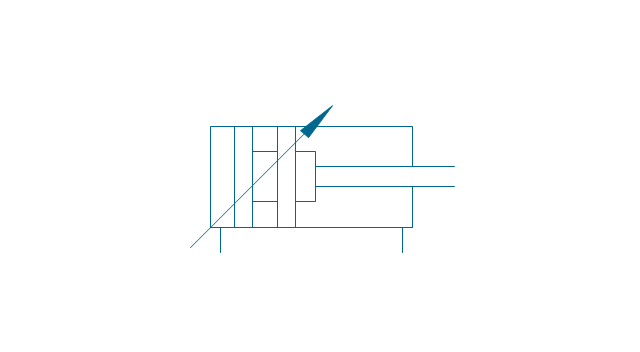
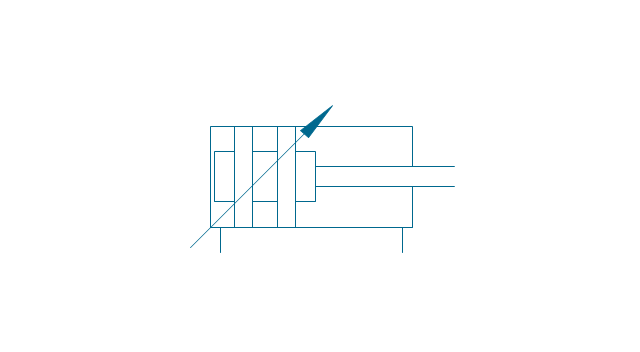
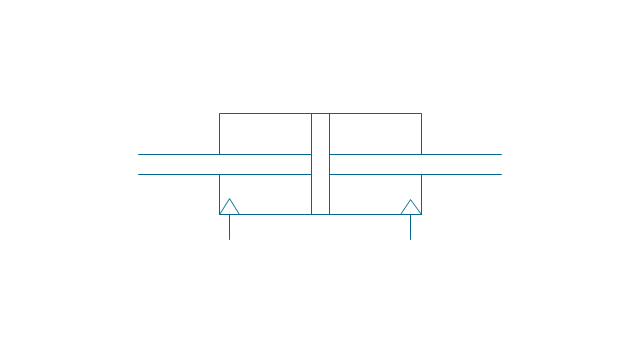
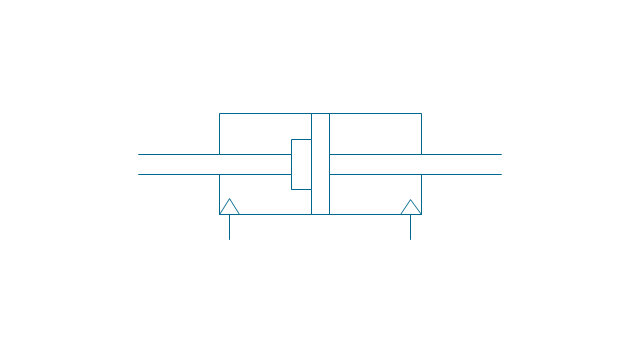
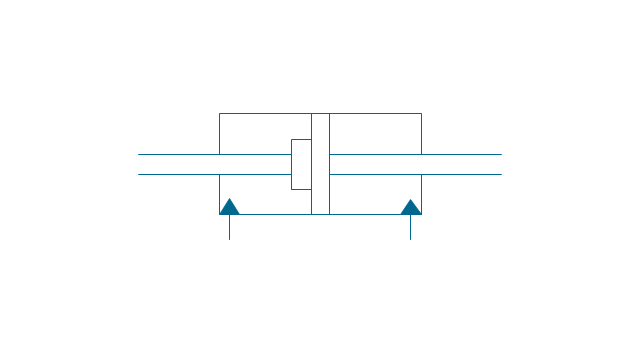
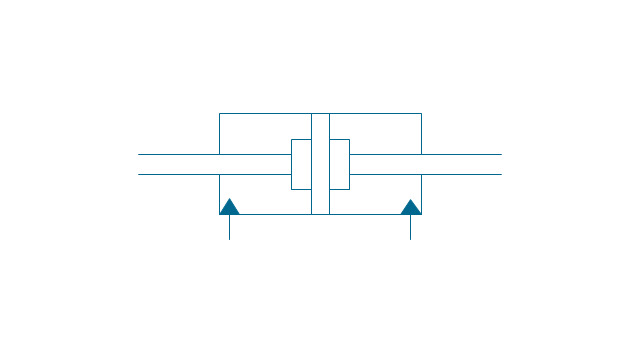
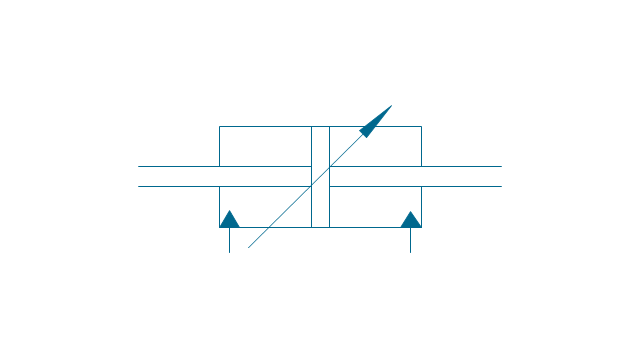
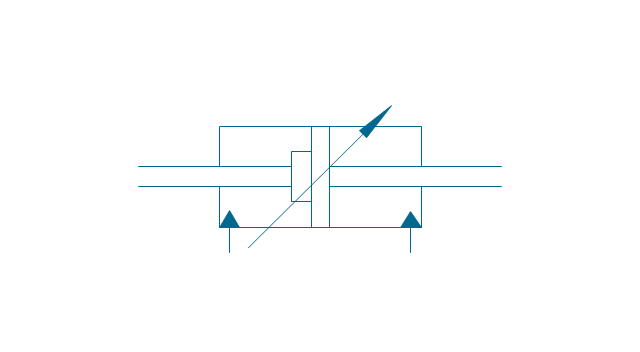
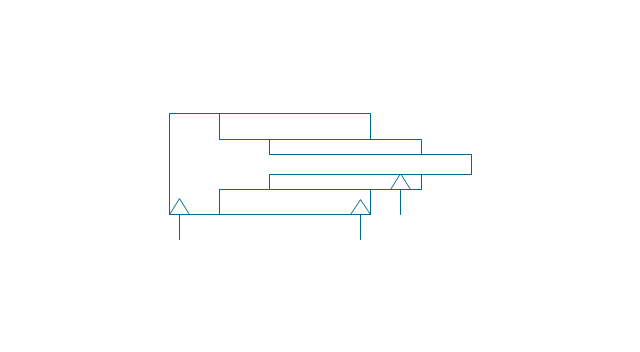
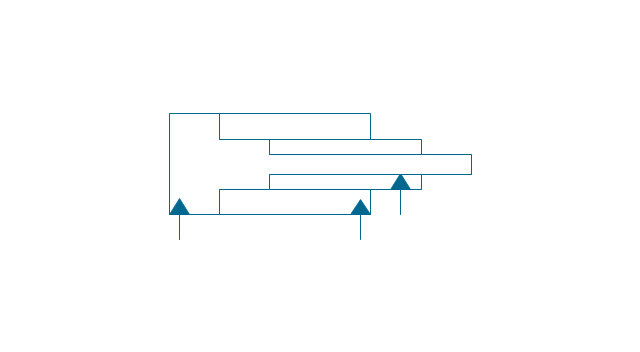
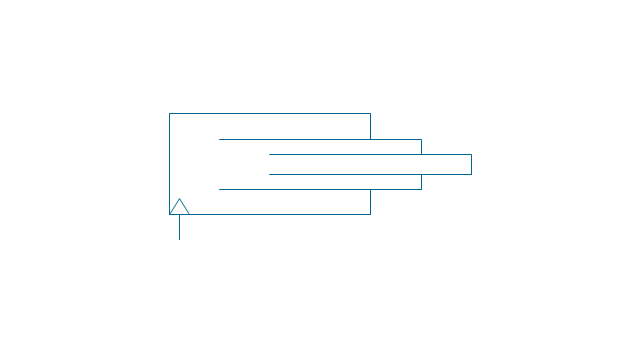
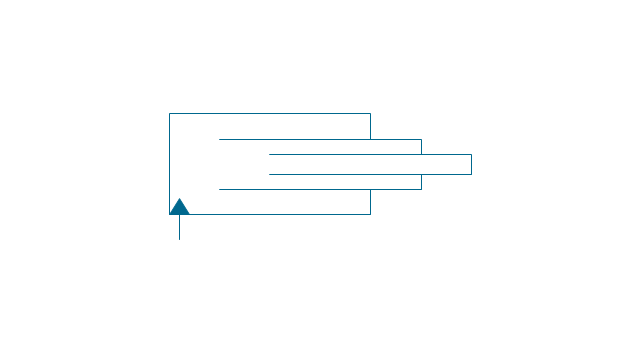
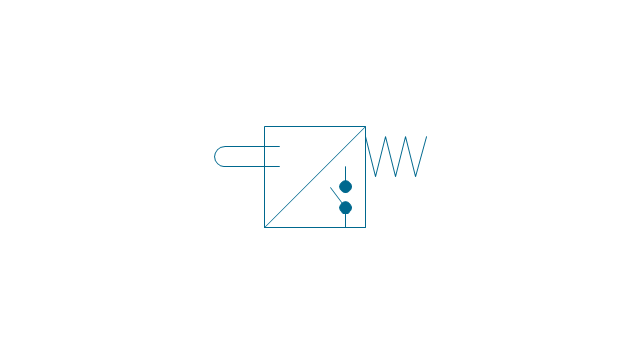
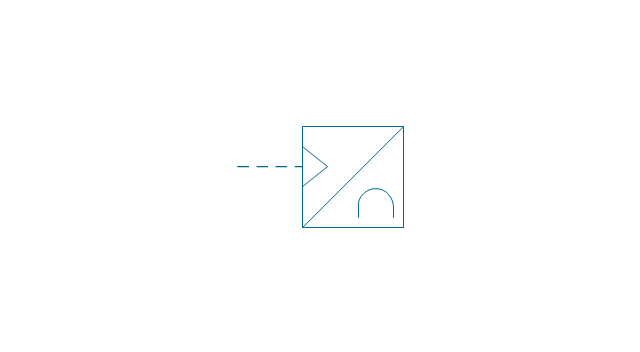
The vector stencils library "Fluid power equipment" contains 113 symbols of hydraulic and pneumatic equipment including pumps, motors, air compressors, cylinders, meters, gauges, and actuators.
Use it to design fluid power and hydraulic control systems in the ConceptDraw PRO diagramming and vector drawing software extended with the Mechanical Engineering solution from the Engineering area of ConceptDraw Solution Park.
www.conceptdraw.com/ solution-park/ engineering-mechanical
Use it to design fluid power and hydraulic control systems in the ConceptDraw PRO diagramming and vector drawing software extended with the Mechanical Engineering solution from the Engineering area of ConceptDraw Solution Park.
www.conceptdraw.com/ solution-park/ engineering-mechanical
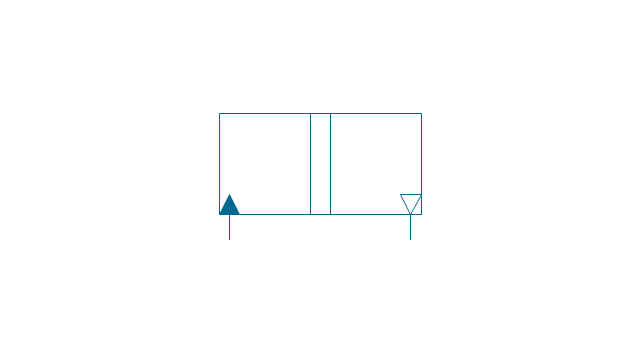
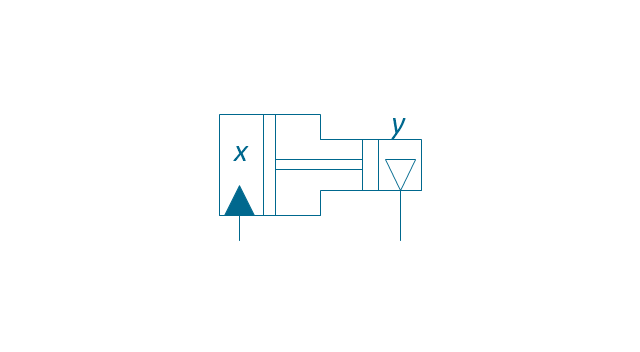
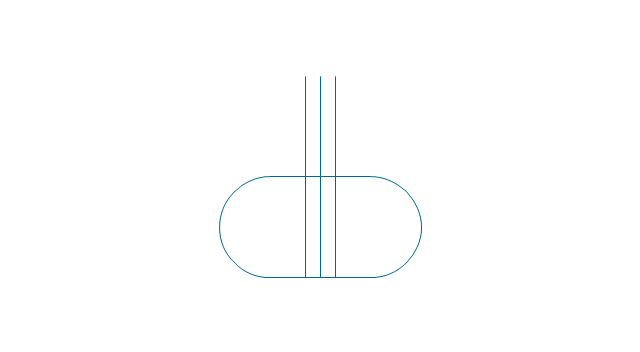
Actuator (semi-rotary), pneumatic
,-pneumatic-fluid-power-equipment---vector-stencils-library.png--diagram-flowchart-example.png)
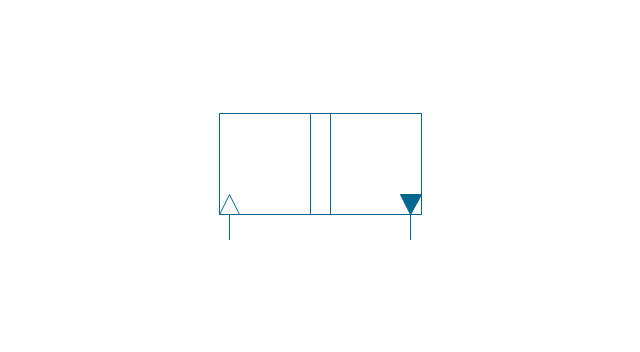
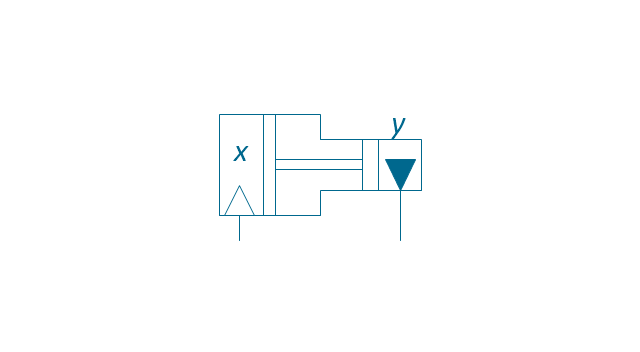
Actuator (semi-rotary), hydraulic
,-hydraulic-fluid-power-equipment---vector-stencils-library.png--diagram-flowchart-example.png)
Drive unit, pneumatic
Drive unit, hydraulic
Sgl-act. cylinder, pneum., left spring
Sgl-act. cylinder, pneum., right spring
Sgl-act. cylinder, pneumatic
Sgl-act. cylinder, hydr., left spring
Sgl-act. cylinder, hydr., right spring
Sgl-act. cylinder, hydraulic
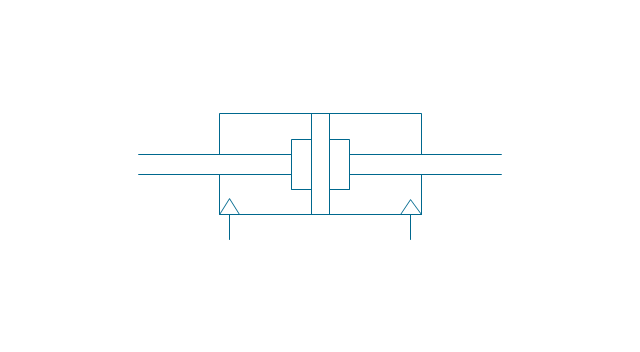
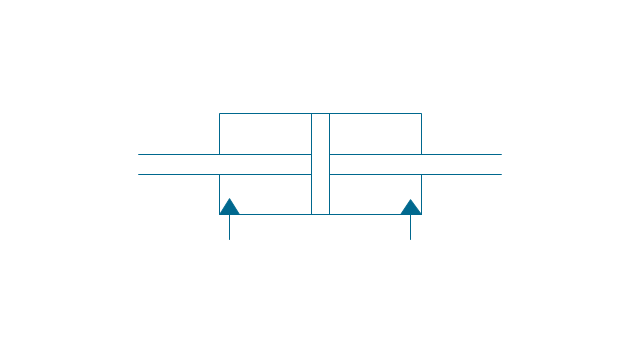
Dbl-act. cylinder, pneumatic
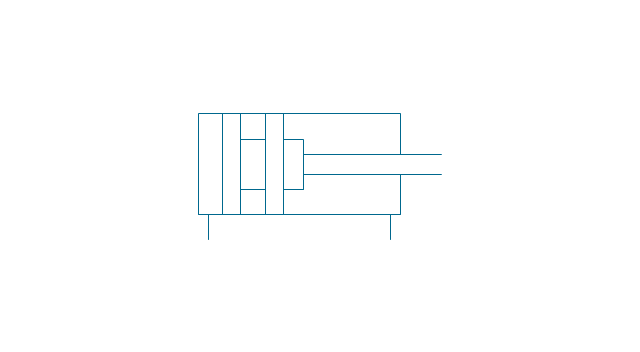
Dbl-act. cylinder, pneum., sgl cushion
Dbl-act. cylinder, pneum., dbl cushion
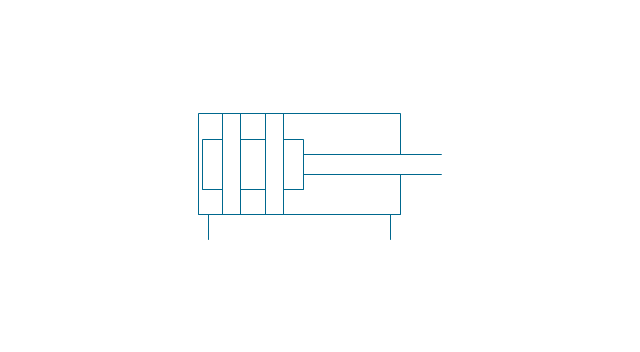
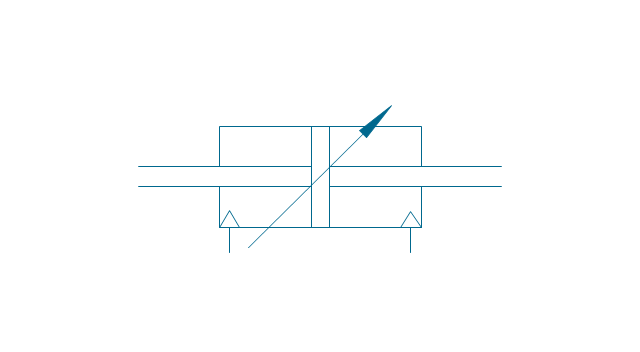
Dbl-act. cylinder, pneum., adjustable
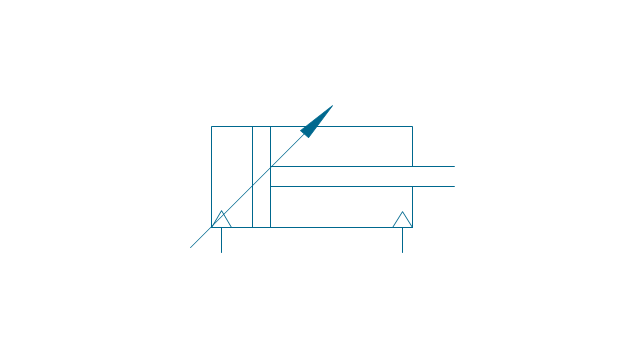
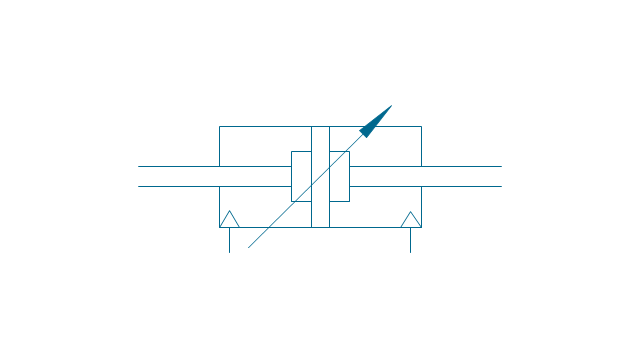
Dbl-act. cylinder, pneum., sgl cushion, adj.
Dbl-act. cylinder, pneum., dbl cushion, adj.
Dbl-act. cylinder, hydraulic
Dbl-act. cylinder, hydr., sgl cushion
Dbl-act. cylinder, hydr., dbl cushion
Dbl-act. cylinder, hydr., adjustable
Dbl-act. cylinder, hydr., sgl cushion, adj.

Dbl-act. cylinder, hydr., dbl cushion, adj.
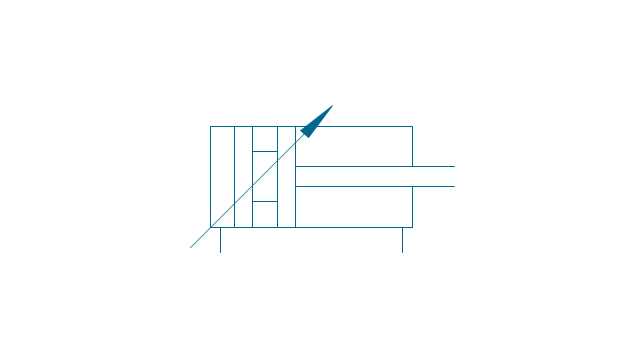
Dbl-act. cylinder, magnetic
Dbl-act. cylinder, magn., sgl cushion
Dbl-act. cylinder, magn., dbl cushion
Dbl-act. cylinder, magn., adjustable
Dbl-act. cylinder, magn., sgl cushion, adj.
Dbl-act. cylinder, magn., dbl cushion, adj.
Dbl-act. dbl-end. cylinder, pneumatic
Dbl-act. dbl-end. cylinder, pneum., sgl cushion
Dbl-act. dbl-end. cylinder, pneum., dbl cushion
Dbl-act. dbl-end. cylinder, pneum., adjustable
Dbl-act. dbl-end. cylinder, pneum., sgl cushion, adj.

Dbl-act. dbl-end. cylinder, pneum., dbl cushion, adj.
Dbl-act. dbl-end. cylinder, hydraulic
Dbl-act. dbl-end. cylinder, hydr., sgl cushion
Dbl-act. dbl-end. cylinder, hydr., dbl cushion
Dbl-act. dbl-end. cylinder, hydr., adjustable
Dbl-act. dbl-end. cylinder, hydr., sgl cushion, adj.
Dbl-act. dbl-end. cylinder, hydr., dbl cushion, adj.

Telescopic cylinder, pneum., dbl-act.
Telescopic cylinder, hydr., dbl-act.
Telescopic cylinder, pneum., sgl-act.
Telescopic cylinder, hydr., sgl-act.
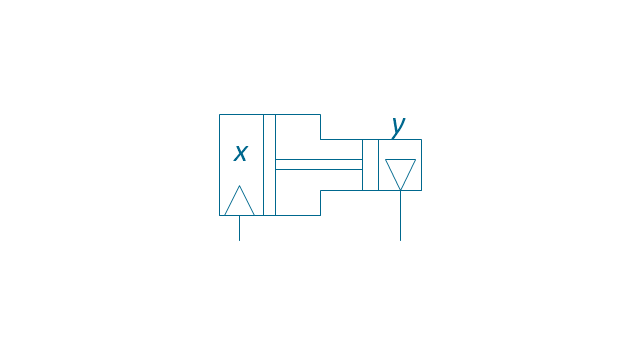
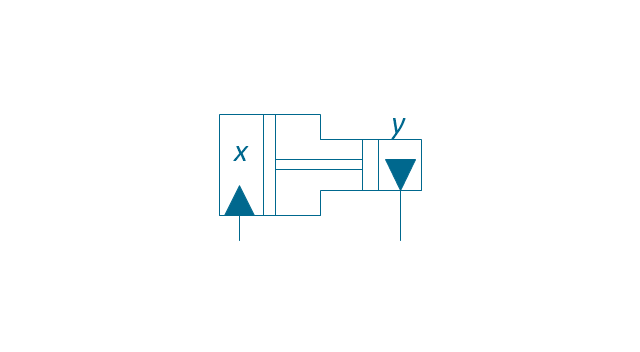
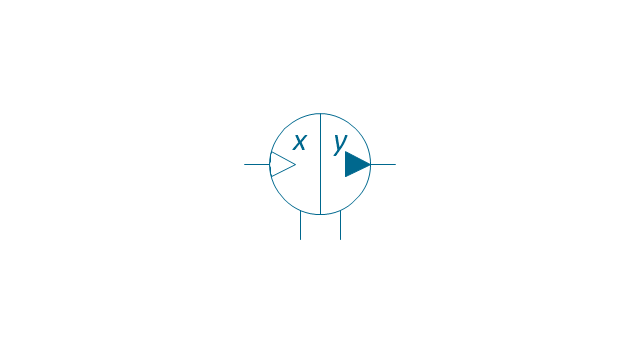
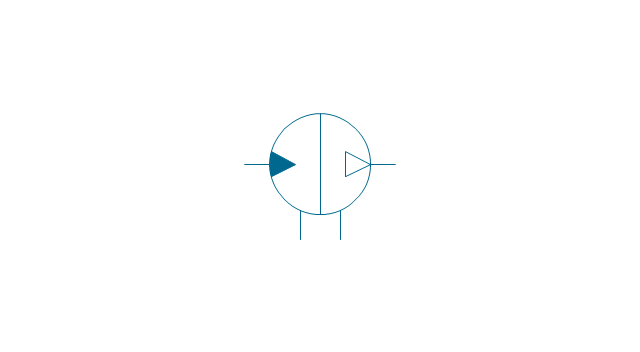
Actuator, hydraulic-pneumatic
Actuator, pneumatic-hydraulic
Intensifier, pneumatic
Intensifier, hydraulic
Intensifier, hydraulic-pneumatic
Intensifier, pneumatic-hydraulic
Intensifier, pneumatic-hydraulic
Intensifier, hydraulic-pneumatic

Actuator, pneumatic-hydraulic

Actuator, hydraulic-pneumatic
Accumulator
Accumulator, gas loaded
Accumulator, spring loaded
Accumulator, auxiliary gas bottle
Air receiver

Energy source, pneumatic

Energy source, hydraulic

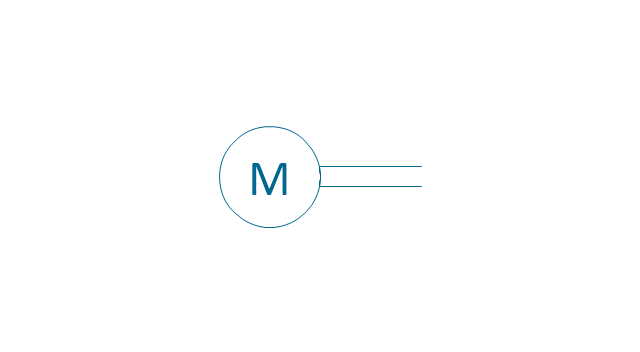
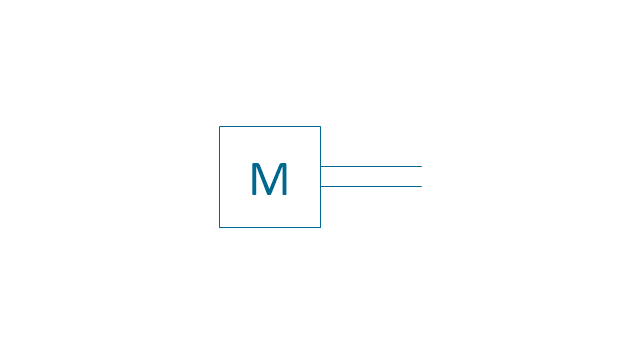
Energy source, electric motor
Energy source, non-electric prime mover
Vented reservoir
Sealed reservoir
Filter
Filter, magnetic element
Filter, contamination indicator
Automatic drain filter separator
Manual drain filter separator
Separator, automatic drain

Separator, manual drain
Air dryer
Lubricator
Air service unit, filter, separator
Air service unit, separator
Air service unit, filter
Air service unit
Liquid cooler
Gas cooler
Cooler
Liquid heater
Gas heater
Heater
Liquid temperature controller
Gas temperature controller
Temperature controller
Liquid temperature controller 2
Gas temperature controller 2
Temperature controller 2
Pressure indicator
Pressure gauge

Differential pressure gauge

Thermometer

Liquid level measuring instrument
Flow indicator
Flow meter
Integrating flow meter
Tachometer

Torque measurement equipment
Pressure switch

Limit switch
Transducer
Pulse counter
Pulse counter 2
Silencer
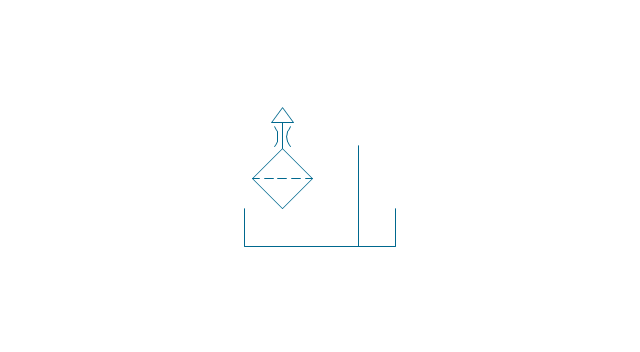
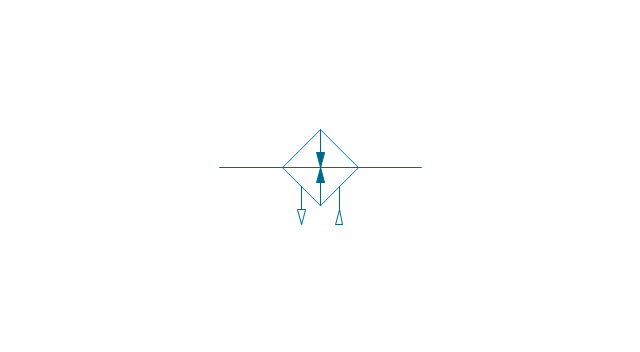
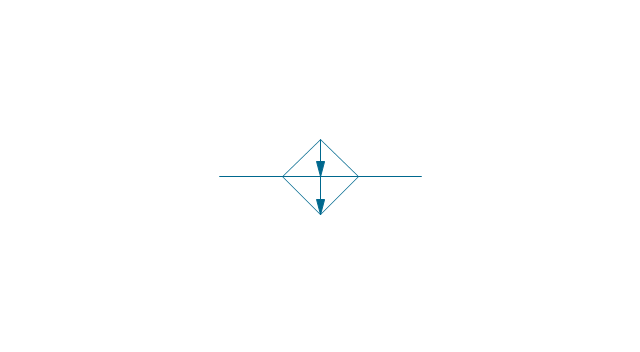
Drain (inlet below fluid, drain line)
-fluid-power-equipment---vector-stencils-library.png--diagram-flowchart-example.png)
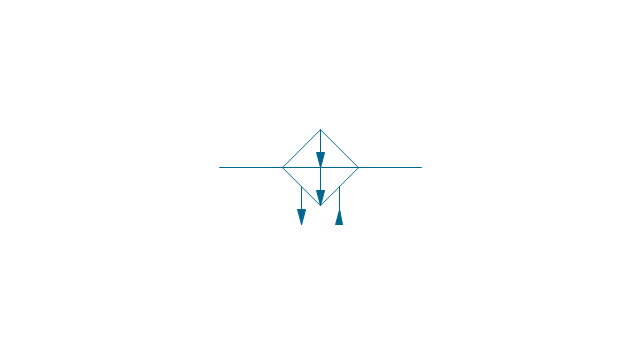
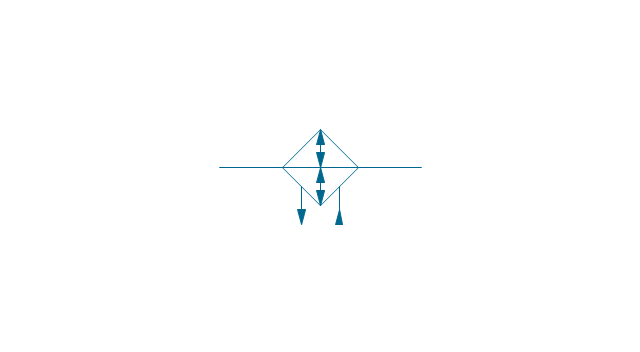
Drain (inlet below fluid, return line)
-fluid-power-equipment---vector-stencils-library.png--diagram-flowchart-example.png)
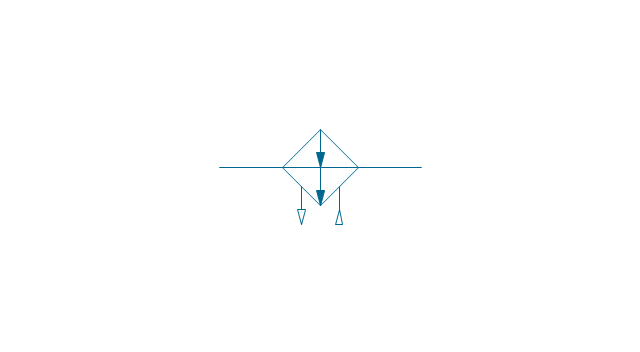
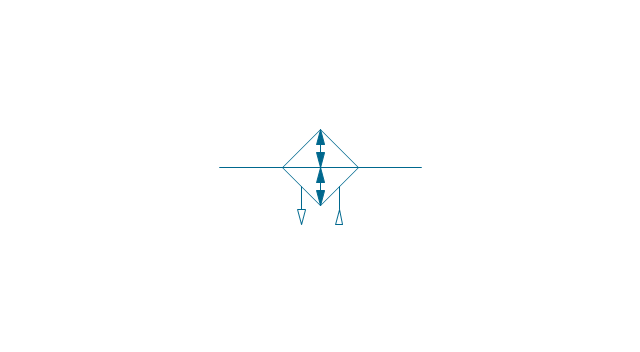
Drain (inlet above fluid, drain line)
-fluid-power-equipment---vector-stencils-library.png--diagram-flowchart-example.png)
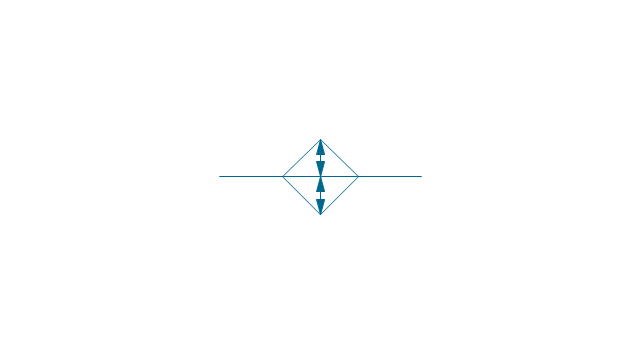
Drain (inlet above fluid, return line)
-fluid-power-equipment---vector-stencils-library.png--diagram-flowchart-example.png)
Oil tank
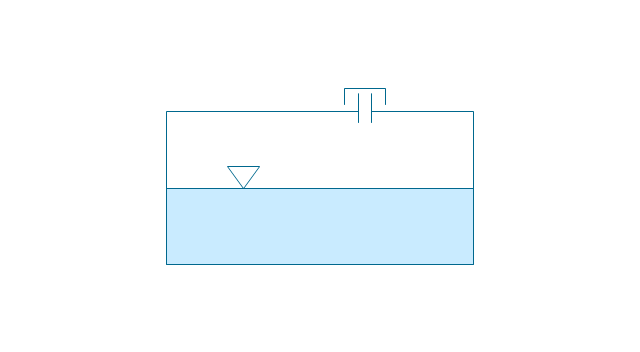
Oil tank, empty
Air compressor
Quality Management Teams

How To Create Project Report

HelpDesk
How to Create a Time Series Dashboard

- Symbol Of Venturi Meter
- Flow Transducer Schematic Symbol
- Flow Diagram Symbol For Rotary Filter
- Flowmeter Symbol
- Air Flow Equipment Symbol In Pneumatic System
- Mechanical Drawing Symbols | Design elements - Hydraulic pumps ...
- Pressure Level Temperature Flow Symbol
- Mechanical Drawing Symbols | Mechanical Engineering | Design ...
- Mechanical Drawing Symbols | Design elements - Valve assembly ...
- Basic Flowchart Symbols and Meaning | Flow Chart Symbols ...
- Mechanical Drawing Symbols | Mechanical Engineering | Pneumatic ...
- Mechanical Drawing Symbols | Pneumatic 5-ported 3-position valve ...
- Mechanical Drawing Symbols | Pneumatic 5-ported 3-position valve ...
- Measuring Meters Symbol
- Mechanical Engineering | Technical Drawing Software | Mechanical ...
- Mechanical Drawing Symbols | Pneumatic 5-ported 3-position valve ...
- Mechanical Drawing Symbols | Mechanical Drawing Software ...
- Symbol Of Non Return Valve With Flow Control System
- Unit Heater Symbol
- Symbols Differences Between Pneumatic And Hydraulic Systems