"In elementary algebra, a quadratic equation (from the Latin quadratus for "square") is any equation having the form
ax^2+bx+c=0
where x represents an unknown, and a, b, and c are constants with a not equal to 0. If a = 0, then the equation is linear, not quadratic. The constants a, b, and c are called, respectively, the quadratic coefficient, the linear coefficient and the constant or free term.
Because the quadratic equation involves only one unknown, it is called "univariate". The quadratic equation only contains powers of x that are non-negative integers, and therefore it is a polynomial equation, and in particular it is a second degree polynomial equation since the greatest power is two.
Quadratic equations can be solved by a process known in American English as factoring and in other varieties of English as factorising, by completing the square, by using the quadratic formula, or by graphing." [Quadratic equation. Wikipedia]
The flowchart example "Solving quadratic equation algorithm" was created using the ConceptDraw PRO diagramming and vector drawing software extended with the Mathematics solution from the Science and Education area of ConceptDraw Solution Park.
HelpDesk
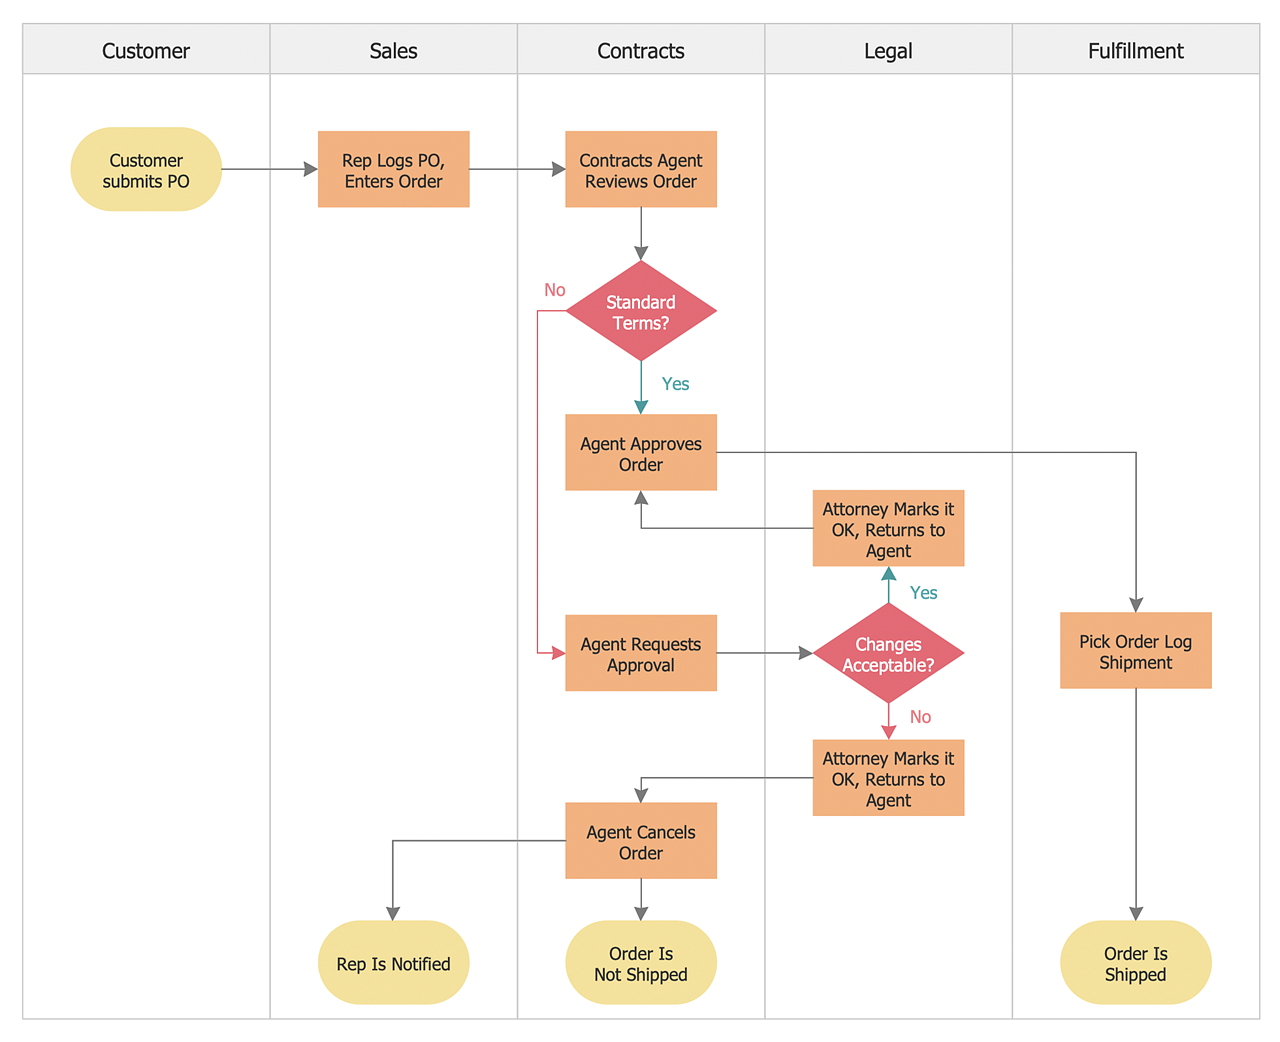
How to Create a Cross-Functional Flowchart
Cross-functional flowcharts are used to visualize cross-functional processes. A cross-functional process is a process that involves multiple divisions, each of which makes its part of the entire company workflow. For example product development, lead management, client orders processing – and other critical processes. All of them are important both for business and customers, but the workflow and responsibilities distribution within these processes are divided between multiple departments and services. Cross-functional processes cannot be depicted with simple workflow diagrams, because of the specific interactions between company departments. ConceptDraw DIAGRAM has released a specialized solution to create cross-functional diagrams. Cross-Functional Flowcharts solution includes a special set of templates and libraries to depict the cross-functional processes.HelpDesk
How to Create Flowchart Using Standard Flowchart Symbols
Flowcharts are used to display an algorithm for consistent execution of certain steps. Flowchart is probably the easiest way to make a graphical representation of any process. Flowcharts use the set of standard geometric symbols and arrows to define relationships. ConceptDraw DIAGRAM allows you to create professional flowchart quickly and easily. The ability to create flowcharts is contained in the Flowcharts solution. The solution provides a set of special tools for creating flowcharts.HelpDesk
How to Create a Sales Flowchart
A Sales flowchart is a specialized type of flowchart. With the help of a sales flowchart, you can visually describe tasks, documents, people responsible for execution at each stage of the sales process. For most commercial organizations, the sales process is inherent to its existence and ability to create profit. Although each company will achieve this aim in its own way, the core selling process remains similar throughout — a potential buyer or prospective customer exchanges money with an organization in return for goods or services. Despite this rather simplistic definition, there exists a huge scope as to which approach is taken. Indeed, it is not uncommon for the sales division to be the largest within a corporate structure, employing a team of salespeople, analysts, and the sales managers, who are in charge of sales division operations. The practical applications of sales process flowcharts are numerous and wide-ranging. At sales level, you might map the process of customer interact- Euclidean algorithm - Flowchart | Basic Flowchart Symbols and ...
- Organizational Structure | Process Flowchart
- Basic Audit Flowchart . Flowchart Examples | Audit Flowcharts | Audit ...
- How to Create an Audit Flowchart Using ConceptDraw PRO ...
- Process Flowchart | Cross-Functional Flowchart (Swim Lanes) | Best ...
- Basic Flowchart Symbols and Meaning | Cross-Functional ...
- Flowchart Software | Basic Flowchart Symbols and Meaning | Create ...
- Process Flowchart | Flowchart Software | Network Diagramming with ...
- Basic Flowchart Symbols and Meaning | Audit Flowchart Symbols ...
- Basic Flowchart Symbols and Meaning | Solving quadratic equation ...
- Data Flow Diagrams (DFD) | Process Flowchart | ConceptDraw ...
- Best Flowchart Software and Flowchart Symbols | Professional ...
- Basic Flowchart Symbols and Meaning | Process Flowchart ...
- Flowchart | Best Flowchart Software and Flowchart Symbols | An ...
- Network Visualization with ConceptDraw PRO | Product Overview ...
- Network Visualization with ConceptDraw PRO | ConceptDraw ...
- Accounting Flowcharts | How to Create Flowcharts for an Accounting ...
- Basic Flowchart Symbols and Meaning | Pyramid Diagram | Best ...
- Best Flowchart Software and Flowchart Symbols | Swim Lane ...


