HelpDesk
Software for Flowchart Diagrams
There are many types of flowcharts among them are workflow diagram, data flow diagram, business flow diagram, and other very complex flowcharts. Thus to draw flowchart it is better to use a computer program – a software for flowchart diagrams creation. The best flowchart software is ConceptDraw DIAGRAM. With the help of visual solutions, you can quickly and effortlessly portray even the most complex business process flow. The Flowcharts solution delivers a special set of vector stencils that contains all standard symbols of flowchart notation, and a large number of special symbols intended for business-oriented flowcharts.Example Process Flow
A flowchart is a picture of the separate steps of a process in sequential order. ConceptDraw DIAGRAM is a Process Flowcharts software. This software includes basic package of process flow examples. The software contains object libraries with vector stencils that allows you use RapidDraw technology. By clicking on direction arrows you can add a new object to the flowchart.Activity Network (PERT) Chart
Activity Network and Project Evaluation and Review Technique, or PERT, charts are a way of documenting and analyzing the tasks in a project. This diagram is constructed as part of the process in creating a schedule of corrective actions. The Activity Network Chart (PERT) shows the logical connections and consequence of tasks to be performed. It displays the time period for problem solving and the implementation of all activities through the critical path.Quick Project Start
The rapid project startup and creation of initial project plan is possible and easy using effective and flexible mind mapping technique, which lets to gather requirements from your team and then plan activities in a visual mind mapping format. Using this technique you can establish time lines, delineate tasks, assign resources, and organize the overall project structure in a form of Mind Map. The ConceptDraw MINDMAP software, PM Easy solution and other offered PM solutions help in project management and support many project methodologies, including Agile and Scrum. ConceptDraw Toolbox solutions help to deal easy with common project situations, they are helpful for planning projects, tracking the milestones, events and resource usage, and for many other functions typical for project management. ConceptDraw MINDMAP software helps project managers effectively create the plan for high level tasks and milestones, set the tasks relations and dependencies, represent the project plan as a Mind Map, successfully start and realize the project of any size, and track the tasks using the ConceptDraw Project.Critical Tasks
All project tasks are important, but only some of them are critical. A task that cannot be delayed without affecting the project end date is a critical task. In other words it is a task, which directly affects the project finish date and at the delay of its implementation the project's finish date will be postponed. Conversely, to move the project end date to an earlier date, you must reschedule the dates of tasks of critical path. During the life of a real project often happens that the critical path changes the time to time, because the tasks may be completed sooner or later than they were planned. A task stops to be critical when it is executed, since more it does not affect the execution of subsequent tasks and on the project finish date. The critical path lets easy to see the project was ended on time or not, and to determine the location of dangerous points on it. ConceptDraw Office applications and PM solutions offered by ConceptDraw Solution Park support the project managers and senior managers with perfect abilities of easy planning and managing projects, tracking the project statuses and critical tasks, with tools for creation Gantt Charts, depiction the critical path and easy generation wide range of project reports.Understanding the Audit Process: A Comprehensive Guide. Audit Process Flowchart
Audit Process Flowchart, Audit Flowchart - Audit Flowcharts solution for ConceptDraw DIAGRAM Solution Park provides the Audit Flowcharts library with wide variety of predesigned audit flowchart symbols, and also the set of templates and samples allowing you design your own audit flowchart or audit process flowchart in one moment. Simply use any of offered samples and change it for your needs, or fill the desired template.Simple Flow Chart
ConceptDraw DIAGRAM diagramming and vector drawing software extended with Flowcharts Solution from the 'Diagrams' area of ConceptDraw Solution Park is a powerful tool for drawing Flow Charts of any complexity you need. Irrespective of whether you want to draw a Simple Flow Chart or large complex Flow Diagram, you estimate to do it without efforts thanks to the extensive drawing tools of Flowcharts solution, there are professional flowchart symbols and basic flowchart symbols. This sample shows the Gravitational Search Algorithm (GSA) that is the optimization algorithm.Task Board
Scrum is a widely used Agile framework for completing the complex projects. Originally invented for software development teams, it is now successfully applied for any innovative scope of work and any business industry. The Task board is an integral part and the most popular tool of the Scrum method. It is a simple, but powerful tool that is usually represented as a table consisting of rows and columns. The Task board contains the columns To Do, Work In Process, To Verify, Done and the set of tasks, each task starts at the To Do column. So, each team participant can see at a glance on a Task board which tasks are currently in work and which are already completed. The Task board reflects the current status of the project and moreover lets detect the problem situations, and then take promptly the needed measures. ConceptDraw MINDMAP software offers the powerful tools to depict the Task board in a form of Mind Map, to visualize Agile management methodologies Scrum and Kanban, and their hybrid Scrum-ban.Sprint Planning Meeting Agenda
Scrum is a framework that allows to solve the radically different tasks, from the development of complex IT products to the creation a reasonable to-do list. The sprint is a basic concept in Scrum, it is an iteration during which is created the functional growth of software. The duration of each sprint is defined by the scrum team individually, based on the tasks, objectives, requirements and composition, which gives to the development process the predictability and flexibility, usually it takes from one to six weeks. The Sprint planning meeting occurs at the beginning of each new sprint, with the participation of the product owners, the scrum master and the entire scrum team. During the Sprint planning meeting is determined the amount of work, the list of tasks, the tasks are broken into the subtasks and their implementation is discussed, at this the tasks are estimated in man-hours. The Mind Map visualizing the Sprint planning meeting agenda was created in ConceptDraw MINDMAP software with help of PM solutions included to ConceptDraw Solution Park.Affinity Diagram
The Affinity Diagram, also known as a KJ diagram, is a business tool invented for organization the large quantity of ideas and data. It is a part of Seven Management and Planning Tools, it is usually used right after brainstorming to sort large numbers of ideas into the corresponding groups. The Affinity Diagram helps to represent in a better way the structure of large and complex factors which influence on a problem, divides these factors into the smaller and simpler structures, and helps team members to see the patterns and identify possible solutions to problems they have. The diagrams of this type don't show the causal relationships between the factors, but they are designed to prepare the data for holding further analysis of the cause-effect relationships. Another area of Affinity Diagram usage is contextual inquiry as a way to sort observations and notes from field interviews, support call logs, open-ended survey responses organizing, etc. ConceptDraw MINDMAP software offers you the tools for easy holding brainstorming, generation ideas and creation MINDMAP Affinity Diagram.Affinity Diagram
The Affinity Diagram, also known as a KJ diagram, is a business tool invented for organization the large quantity of ideas and data. It is a part of Seven Management and Planning Tools, it is usually used right after brainstorming to sort large numbers of ideas into the corresponding groups. The Affinity Diagram helps to represent in a better way the structure of large and complex factors which influence on a problem, divides these factors into the smaller and simpler structures, and helps team members to see the patterns and identify possible solutions to problems they have. The diagrams of this type don't show the causal relationships between the factors, but they are designed to prepare the data for holding further analysis of the cause-effect relationships. Another area of Affinity Diagram usage is contextual inquiry as a way to sort observations and notes from field interviews, support call logs, open-ended survey responses organizing, etc. ConceptDraw MINDMAP software offers you the tools for easy holding brainstorming, generation ideas and creation MINDMAP Affinity Diagram. Flowchart Design Flowchart Symbols, Shapes, Stencils and Icons
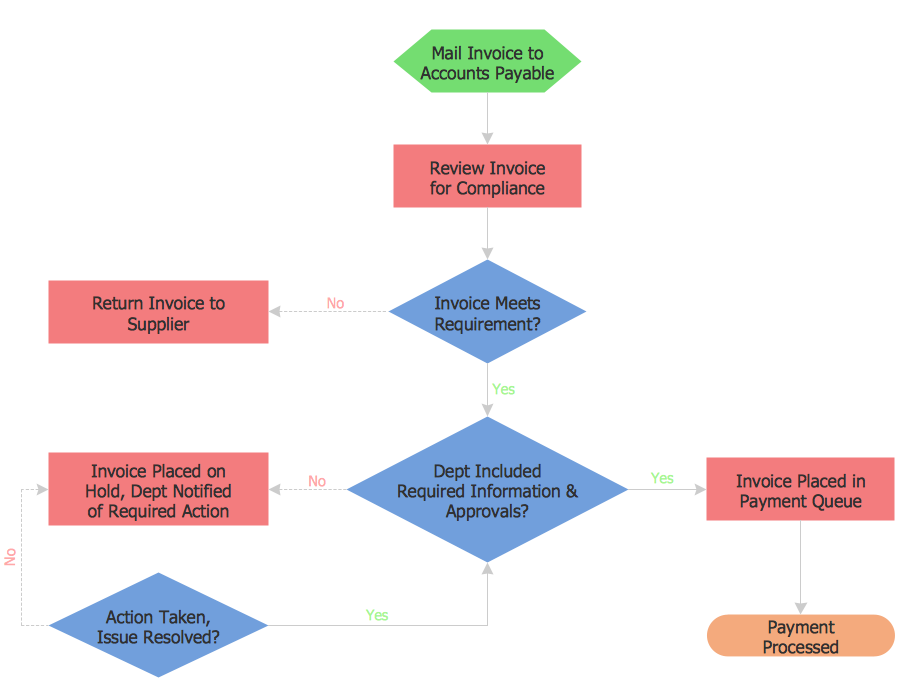
A flowchart is a type of diagram which represents an algorithm, process or workflow, displays the steps as boxes of various kinds and depicts their order by connecting them with arrows. Any business graphic document will be more colorful and understandable if will use professional-looking and visual diagrams and flowcharts. Flowchart design gives versatile presenting and explaining of the process.
ConceptDraw DIAGRAM flowchart software enhanced with Flowcharts solution helps effectively make Flowchart Design. Use of predesigned flowchart symbols and bright color palette offers a fresh view and favorably distinguishes the flowcharts designed in ConceptDraw DIAGRAM from the black and white flowcharts on a paper. Preferably to use no more than three or four colors and apply identical for the same shape types. The best flowchart design can be achieved by starting with Flowchart template, or any of suitable ready examples or samples offered in ConceptDraw STORE, open one of them and enter the proper text into each Flowchart shape.
Each symbol of the flowchart has a definition that can't be changed. This means that all flowcharts shapes can be grouped in according to their meaning. Users with ConceptDraw DIAGRAM flowchart software can style groups of symbols with close definitions by color sets chosen from complementary palette.
Almost all workflows can be depicted as a flowchart. Colored diagrams are more light for perception of the certain information, this is part of flowchart design. Bright colors need to be used in the key points of Decision symbols, to focus attention on their importance for whole process flow.
Comparing ConceptDraw DIAGRAM to Omnigraffle
Comparing ConceptDraw DIAGRAM to Omnigraffle you can see a lot of benefits of ConceptDraw products. First, the main, ConceptDraw applications are cross-platform and available in two independent and concurrent versions for Macintosh (macOS) and PC (Windows). ConceptDraw gives you the per named license, that you can use simultaneously for your both Macintosh and PC, at work and at home. Free access to the ConceptDraw Solution Park offers you the great number of solutions with hundreds of templates and samples, and thousands of ready-to-use vector objects for quick and easy creation diagrams, drawings, illustrations and Mind Maps. Besides, thanks to Ingyre Technology is provided the integration with Microsoft Office applications and capabilities of limitless exchange the information. The ConceptDraw Live Objects technology lets you design the visual dynamically-updated dashboards, the Rapid Draw technology allows creating the diagrams in minutes. The extensive presentation capabilities help you create lush and beautiful presentation slideshows from your ConceptDraw documents.What is a Cross Functional Flow Chart?
For those who want to know what is a cross functional flowchart and how to draw it, we preared a special library and professional looking templates. Take all the advantage of your drawing software to learn and create such a well-designed flowcharts. Watch the HowTo video to learn more.Business Process Modeling
ConceptDraw RapidDraw DIAGRAM helps create visually document and communicate Business Process (BPMN 2.0) information.TQM Diagram Example
The Total Quality Management Diagram solution helps you and your organization visualize business and industrial processes. Create Total Quality Management diagrams for business process with ConceptDraw software.Cross-Functional Flowchart
Use of Cross-Functional Flowchart is a clear way of showing each team member’s responsibilities and how processes get shared or transferred between different responsible people, teams and departments. Use the best flowchart maker ConceptDraw DIAGRAM with a range of standardized cross-functional flowchart symbols to create the Cross-Functional Flowcharts simply and to visualize the relationship between a business process and the functional units responsible for that process. To draw the most quickly Cross-Functional Flowcharts, Cross Functional Process Maps, or Cross Functional Process Flow Diagrams, start with a Cross-functional flowchart samples and templates from ConceptDraw Solution Park. The ConceptDraw Arrows10 and RapidDraw technologies will be also useful for you in drawing. ConceptDraw DIAGRAM supports designing both types - horizontal and vertical Cross-functional flowcharts. A vertical layout makes the accents mainly on the functional units while a horizontal layout - on the process. If you need a Visio alternative in Mac OS X, try ConceptDraw DIAGRAM. Its interface is very intuitive and it’s actually much easier to use than Visio, yet somehow it’s just as powerful if not more so. ConceptDraw DIAGRAM performs professional quality work and seamless Visio interaction.Flowchart Software
A Flowchart visualizes a process or algorithm of a program as step blocks composed of shapes, connected with arrows that show the process flow direction. The Flowcharts give users the ability to represent structural data in a visual form and are widely used to visualize the business and technical processes, as well as software algorithms. ConceptDraw DIAGRAM is a powerful Mac OS X and Windows technical diagramming, business diagramming and flowchart drawing software. Numerous vector stencils, built-in templates and samples created by professional designers are included at the basic package. ConceptDraw DIAGRAM is a classic flowchart maker, which exactly follows the industry standards and provides ready-to-use flowchart symbols gathered at the solutions of ConceptDraw Solution Park. Use the free trial versions of ConceptDraw DIAGRAM software for Mac and PC to experience the powerful possibilities of ConceptDraw DIAGRAM in designing the Flowcharts, Flow Diagrams, Business Flow Charts of different types, styles, and degree of complexity.Pyramid Diagram
At the base of the identity of an organisational is its organizational culture. Flow chart ExampleWarehouse Flowchart
Warehouse Flowcharts are various diagrams that describe the warehousing and inventory management processes on the warehouses. Typical purposes of Warehouse Flowcharts are evaluating warehouse performance, measuring efficiency of customer service and organizational performance. This type of Workflow diagrams can be used for identifying any disconnection between business activities and business objectives. They are effectively used by warehouse-related people and organizations, manufacturers, wholesalers, exporters, importers, transporters, and others.
Standard Warehousing process flow diagram and standard Workflow diagram are used for process identification for further evaluating effectiveness and profitability of overall business process. Use the ConceptDraw DIAGRAM ector graphic software extended with Flowcharts solution to design your own professional-looking Workflow diagrams and Flowcharts of any types, including the Warehouse flowchart, Process flow diagrams which depict in details all steps of Warehouse packages flow.
Microsoft Visio, designed for Windows users, can’t be opened directly on Mac. But fortunately, there are several Visio alternatives for Mac which will help Mac users to work Visio files. With ConceptDraw DIAGRAM , you may open, edit and save files in Visio format.
- Cross-Functional Flowchart | How to Simplify Flow Charting — Cross ...
- Software for Flowchart Diagrams | Practice Algorithm Flowchart
- Cross-Functional Flowchart | Activity Network (PERT) Chart ...
- Amazon Web Services Diagrams diagramming tool for architecture ...
- Online store social media response flowchart | Stakeholder Onion ...
- Online store social media response flowchart
- Flowchart Example: Flow Chart of Marketing Analysis | Examples of ...
- Best Diagramming | Social strategy - Pyramid diagram | Marketing ...
- ConceptDraw Arrows10 Technology | Significant characteristics of ...