Business diagrams & Org Charts with ConceptDraw PRO
The business diagrams are in great demand, they describe the business processes, business tasks and activities which are executed to achieve specific organizational and business goals, increase productivity, reduce costs and errors. They let research and better understand the business processes. ConceptDraw PRO is a powerful professional cross-platform business graphics and business flowcharting tool which contains hundreds of built-in collections of task-specific vector stencils and templates. They will help you to visualize and structure information, create various Business flowcharts, maps and diagrams with minimal efforts, and add them to your documents and presentations to make them successful. Among them are Data flow diagrams, Organization charts, Business process workflow diagrams, Audit flowcharts, Cause and Effect diagrams, IDEF business process diagrams, Cross-functional flowcharts, PERT charts, Timeline diagrams, Calendars, Marketing diagrams, Pyramids, Target diagrams, Venn diagrams, Comparison charts, Analysis charts, Dashboards, and many more. Being a cross-platform application, ConceptDraw PRO is very secure, handy, free of bloatware and one of the best alternatives to Visio for Mac users.
 Fishbone Diagrams
The Fishbone Diagrams solution extends ConceptDraw PRO v10 software with the ability to easily draw the Fishbone Diagrams (Ishikawa Diagrams) to clearly see the cause and effect analysis and also problem solving. The vector graphic diagrams produced using this solution can be used in whitepapers, presentations, datasheets, posters, and published technical material.
Accounts Payable Flowchart
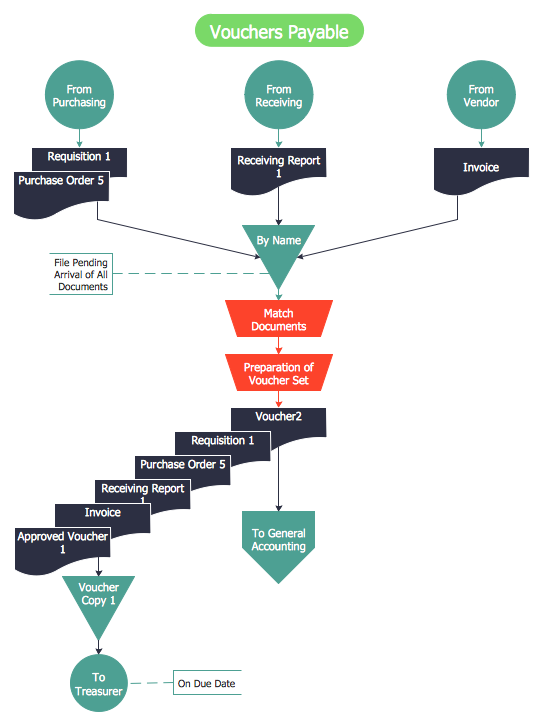
Accounts Payable Flowchart - There is nothing easier than do it in ConceptDraw PRO. ConceptDraw PRO diagramming and vector drawing software provides the Accounting Flowcharts Solution from the Finance and Accounting Area of ConceptDraw Solution Park. The Accounting Flowcharts Solution contains templates, samples and library of ready-to-use predesigned vector objects that will help you create: accounts payable flowchart, accounts payable process flow chart, accounting flowchart of any complexity quick and easy.Business Diagram Software
When managing the projects, people, or networks, there are daily designed and used different types of Business diagrams, so the powerful drawing software will be very useful for this. ConceptDraw PRO with large quantity of business solutions will meet your needs and will help you convey your ideas successful and rapidly, no matter are you professional or beginner. It is the best choice for business specialists and technical professionals who need quickly and easily explore, visualize, and communicate information. ConceptDraw PRO business diagram software is the most powerful business software and relational charting software. Create advanced, completely customizable Business Process Diagrams, Business Flow Charts, Work Flow Diagrams, Organizational Charts, Audit diagrams, Marketing diagrams, Value Stream Maps, TQM diagrams, ERD diagrams, EPC diagrams, Cause and Effect diagrams, Infographics, Dashboards, and other Relational business diagrams from your data using the powerful drawing tools of ConceptDraw Solution Park.
HelpDesk
How to Add a Block Diagram to a PowerPoint Presentation
A block diagram is a useful tool both in designing new processes, and in improving existing. A block diagram is a type of chart, which is often used in presentations, because of its universality - the graphic blocks can be applied to many processes.The PowerPoint presentation of major process steps and key process participants can be very informative and helpful. Using ConceptDraw PRO, you can easily convert a block diagram to MS PowerPoint presentation.
 Sales Flowcharts
The Sales Flowcharts solution lets you create and display sales process maps, sales process workflows, sales steps, the sales process, and anything else involving sales process management.
 Block Diagrams
Block diagrams solution extends ConceptDraw PRO software with templates, samples and libraries of vector stencils for drawing the block diagrams.
How To Draw Building Plans
Building Plan is the basis for implementation construction and repair works. Creation of Building Plans is the main purpose of architects and designers. They are required and even obligatory for builders to accurately implement your wishes and ideas during the building, designing or redesigning your home, flat, office, or any other premise. ConceptDraw PRO is a powerful quick building plan software for creating great-looking Office layouts, Home floor plans, Commercial floor plans, Storage building plans, Expo and Shopping mall building plans, School and Training building plans, Cafe or Restaurant plans, Gym and Spa area plans, Sport field plans, House interior designs, Electric and Telecom building plans, Fire and Emergency plans, HVAC plans, Security and Access plans, Plumbing and Piping plans, Plant layouts, etc. Use helpful samples, templates and variety of libraries with numerous building design elements from Floor Plans solution for ConceptDraw PRO software to facilitate design drawing process.
 ConceptDraw Solution Park
ConceptDraw Solution Park collects graphic extensions, examples and learning materials
HelpDesk
How To Create a PERT Chart
Project Evaluation and Review Technique (PERT) is a method of project tasks evaluation and analysis. PERT - is a method of analyzing the tasks required to complete the project. It includes analysis of the time required to complete each task, as well as the determination of the time required to carry out the whole project. PERT was developed to facilitate the planning of huge and complex projects. PERT is used for very large, complex, and non-standard projects. Technology implies the presence of uncertainty, making it possible to develop a schedule of the project without a precise information on details and time required for all of its components. The most popular part of PERT is a method of the critical path, based on the construction of the network schedule (PERT network diagram). ConceptDraw Office delivers you the best way to create PERT chart for your project using compatibility between ConceptDraw PROJECT and ConceptDraw PRO.
 Data Flow Diagrams (DFD)
Data Flow Diagrams solution extends ConceptDraw PRO software with templates, samples and libraries of vector stencils for drawing the data flow diagrams (DFD).
The Sales Process
The Sales Process is a complex approach for selling a product or service which assumes many steps including the sales planning, realization of the sales marketing and management strategies, sales process analysis, etc. Now we have a ConceptDraw PRO software extended with unique Sales Flowcharts solution from the Marketing area of ConceptDraw Solution Park which ideally suits for the planning and realization the company's sales process.
 AWS Architecture Diagrams
AWS Architecture Diagrams with powerful drawing tools and numerous predesigned Amazon icons and AWS simple icons is the best for creation the AWS Architecture Diagrams, describing the use of Amazon Web Services or Amazon Cloud Services, their application for development and implementation the systems running on the AWS infrastructure. The multifarious samples give you the good understanding of AWS platform, its structure, services, resources and features, wide opportunities, advantages and benefits from their use; solution’s templates are essential and helpful when designing, description and implementing the AWS infrastructure-based systems. Use them in technical documentation, advertising and marketing materials, in specifications, presentation slides, whitepapers, datasheets, posters, etc.
Sales Process Map
You need create a Sales Process Map? Use the ConceptDraw PRO software which is ideal for the sales process management, marketing and engineering thanks to the powerful Sales Flowcharts solution from the Marketing area of ConceptDraw Solution Park.
 Entity-Relationship Diagram (ERD)
Entity-Relationship Diagram (ERD) solution extends ConceptDraw PRO software with templates, samples and libraries of vector stencils from drawing the ER-diagrams by Chen's and crow’s foot notations.
 Concept Maps
The technique of concept mapping was developed as a constructive way of representing knowledge in science and increasing the meaningfulness of learning. Now, the creation of a concept map is extremely helpful when used in education as learning and teaching techniques that assist memorization. Concept maps are also used for idea generation in brainstorming sessions, and for detailing the structure of complex ideas.
The vector stencils library "Sales symbols" contains 55 sales pictograms.
Use these icon set to draw your sales flowcharts, workflow diagrams and process charts with the ConceptDraw PRO diagramming and vector drawing software.
The vector stencils library "Sales symbols" is included in the Sales Flowcharts solution from the Marketing area of ConceptDraw Solution Park.
Use these icon set to draw your sales flowcharts, workflow diagrams and process charts with the ConceptDraw PRO diagramming and vector drawing software.
The vector stencils library "Sales symbols" is included in the Sales Flowcharts solution from the Marketing area of ConceptDraw Solution Park.
Example of DFD for Online Store (Data Flow Diagram) DFD Example
Data Flow Diagram (DFD) is a methodology of graphical structural analysis and information systems design, which describes the sources external in respect to the system, recipients of data, logical functions, data flows and data stores that are accessed. DFDs allow to identify relationships between various system's components and are effectively used in business analysis and information systems analysis. They are useful for system’s high-level details modeling, to show how the input data are transformed to output results via the sequence of functional transformations. For description of DFD diagrams are uses two notations — Yourdon and Gane-Sarson, which differ in syntax. Online Store DFD example illustrates the Data Flow Diagram for online store, the interactions between Customers, Visitors, Sellers, depicts User databases and the flows of Website Information. ConceptDraw PRO enhanced with Data Flow Diagrams solution lets you to draw clear and simple example of DFD for Online Store using special libraries of predesigned DFD symbols.
- Flow Chart Diagram Online Shopping Examples
- UML Component Diagram Example - Online Shopping | Entity ...
- Foreign trade - Onion diagram | Settlement Process Flowchart
- Example of DFD for Online Store (Data Flow Diagram ). DFD ...
- Online store social media response flowchart | Visual shopping ...
- Online store social media response flowchart | Visual shopping ...
- Flow chart Example. Warehouse Flowchart | Seating Plans | Dfd For ...
- UML interaction overview diagram - Online shopping | AWS ...
- Flowchart For Online Shopping For Electronics
- Flowchart Marketing Process. Flowchart Examples | Sales Process ...
- How To Draw Flowchart For Online Shopping Site
- Store Layout Software | Example of DFD for Online Store (Data Flow ...
- Swimlane Diagram For Online Shopping
- Online store social media response flowchart | Types of Flowcharts ...
- Flowchart With Explanation For Online Medicine Shopping Site
- Trading process diagram - Deployment flowchart | Online store ...
- Online Diagram Tool | Flow Chart Online | ConceptDraw Solution ...
- State Diagram Example - Online Store | Example of DFD for Online ...
- Data Flow Diagram | Process Flowchart | Types of Flowchart ...
- UML Class Diagram Example - Medical Shop | UML Notation | Basic ...

