Hotel Plan. Hotel Plan Examples

Business Diagram Software


Hotel Network Topology Diagram


 Basic Floor Plans
Detailed floor plan is the basis of any building project, whether a home, office, business center, restaurant, shop store, or any other building or premise. Basic Floor Plans solution is a perfect tool to visualize your creative projects, architectural and floor plans ideas.
Total Quality Management Business Diagram

Cause and Effect Diagrams

 Fishbone Diagram
Fishbone Diagrams solution extends ConceptDraw DIAGRAM software with templates, samples and library of vector stencils for drawing the Ishikawa diagrams for cause and effect analysis.
 Picture Graphs
Typically, a Picture Graph has very broad usage. They many times used successfully in marketing, management, and manufacturing. The Picture Graphs Solution extends the capabilities of ConceptDraw DIAGRAM with templates, samples, and a library of professionally developed vector stencils for designing Picture Graphs.
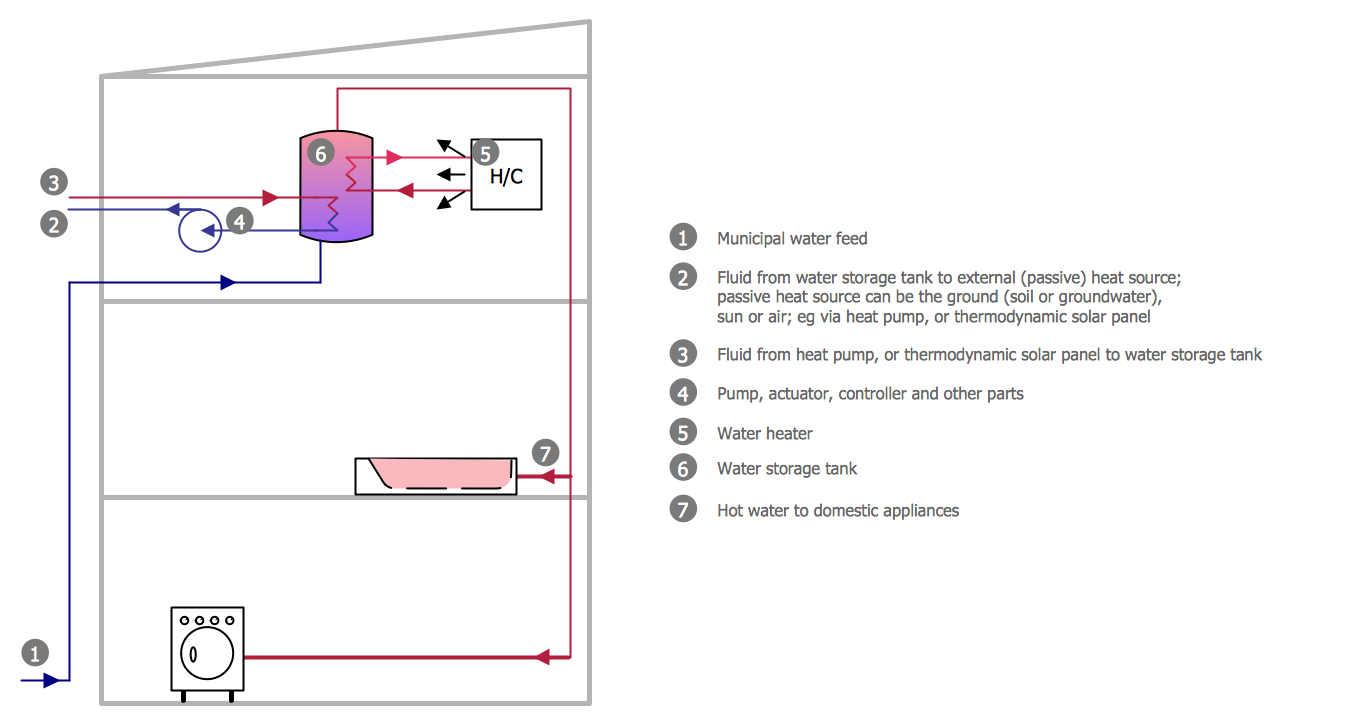
 Plumbing and Piping Plans
Plumbing and Piping Plans solution extends ConceptDraw DIAGRAM.2.2 software with samples, templates and libraries of pipes, plumbing, and valves design elements for developing of water and plumbing systems, and for drawing Plumbing plan, Piping plan, PVC Pipe plan, PVC Pipe furniture plan, Plumbing layout plan, Plumbing floor plan, Half pipe plans, Pipe bender plans.
Half Pipe Plans
When To Use a Fishbone Diagram

Cause and Effect Analysis - Fishbone Diagrams for Problem Solving

Cause and Effect Diagram

Cause and Effect Analysis

Cause and Effect Diagram Software

- Process Flowchart | Copying Service Process Flowchart . Flowchart ...
- Cross-functional flowchart landscape, U.S. units | Hotel Service ...
- Flowchart Examples Of Hotel Management
- Copying Service Process Flowchart . Flowchart Examples | Hotel ...
- Flow Chart Of Accommodation Services
- Copying Service Process Flowchart . Flowchart Examples | Mini ...
- Flow Chart Equipment Type With An Example
- Mini Hotel Floor Plan. Floor Plan Examples | Copying Service ...
- Hotel Plan. Hotel Plan Examples | Copying Service Process ...
- Process Flowchart | Sales Process Flowchart . Flowchart Examples ...
- Hotel Plan. Hotel Plan Examples | Process Flowchart | Hotel Service ...
- Invoice payment process - Flowchart | UML Class Diagram Example ...
- Sales Process Flowchart . Flowchart Examples | Hotel reservation ...
- Hotel reservation system | Process Flowchart | Basic Flowchart ...
- Hotel Management Role Flowchart Hd Images
- Flowchart on Bank. Flowchart Examples | Time - Design Elements ...
- Sales Flowcharts | Sales Process Management | Hotel reservation ...
- Hotel Management System Algorithm And Flowchart
- Hotel Service Process | Copying Service Process Flowchart ...