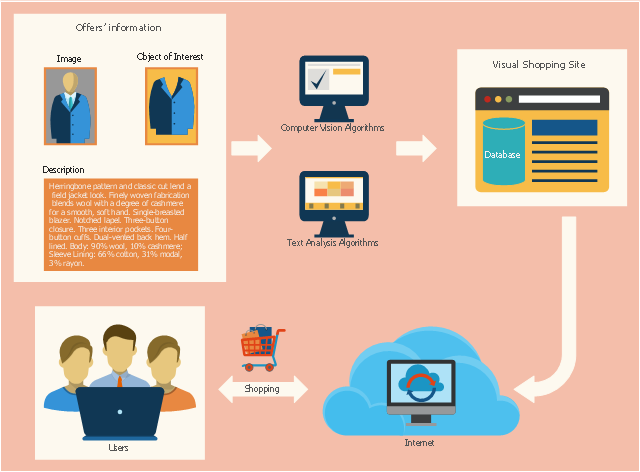
This sales flowchart example was redesigned from the Wikimedia Commons file: Visual shopping scheme.pdf. [commons.wikimedia.org/ wiki/ File:Visual_ shopping_ scheme.pdf]
"Online shopping (sometimes known as e-tail from "electronic retail" or e-shopping) is a form of electronic commerce which allows consumers to directly buy goods or services from a seller over the Internet using a web browser. Alternative names are: e-web-store, e-shop, e-store, Internet shop, web-shop, web-store, online store, online storefront and virtual store. Mobile commerce (or m-commerce) describes purchasing from an online retailer's mobile optimized online site or app." [Online shopping. Wikipedia]
The example "Visual shopping scheme" was created using the ConceptDraw PRO diagramming and vector drawing software extended with the Sales Flowcharts solution from the Marketing area of ConceptDraw Solution Park.
Example of DFD for Online Store (Data Flow Diagram) DFD Example
Data flow diagrams (DFDs) reveal relationships among and between the various components in a program or system. DFDs are an important technique for modeling a system’s high-level detail by showing how input data is transformed to output results through a sequence of functional transformations.Example of DFD for Online Store shows the Data Flow Diagram for online store and interactions between the Visitors, Customers and Sellers, as well as Website Information and User databases.
Sales Flowcharts
The Sales Flowcharts solution lets you create and display sales process maps, sales process workflows, sales steps, the sales process, and anything else involving sales process management.
ConceptDraw Solution Park
ConceptDraw Solution Park collects graphic extensions, examples and learning materials
Data Flow Diagrams (DFD)
Data Flow Diagrams solution extends ConceptDraw PRO software with templates, samples and libraries of vector stencils for drawing the data flow diagrams (DFD).
HelpDesk
How to Add a Block Diagram to a PowerPoint Presentation
Block diagram is rather universal type of charts - compositions from geometric blocks can be applied to describe various kinds of processes or systems, consisting from components, which depend on each other. Block diagrams are indispensable when you need to represent a process or system on a basic level. With blocks, you can easily depict the basic elements of the process, without drilling down. The PowerPoint presentation of major process steps and key process participants can be very informative and helpful. Using ConceptDraw PRO, you can easily convert a block diagram to MS PowerPoint presentation.Fishbone Diagrams
The Fishbone Diagrams solution extends ConceptDraw PRO v10 software with the ability to easily draw the Fishbone Diagrams (Ishikawa Diagrams) to clearly see the cause and effect analysis and also problem solving. The vector graphic diagrams produced using this solution can be used in whitepapers, presentations, datasheets, posters, and published technical material.
HelpDesk
How To Create a PERT Chart
Project Evaluation and Review Technique (PERT) is a method of project tasks evaluation and analysis. PERT - is a method of analyzing the tasks required to complete the project. It includes analysis of the time required to complete each task, as well as the determination of the time required to carry out the whole project. PERT was developed to facilitate the planning of huge and complex projects. PERT is used for very large, complex, and non-standard projects. Technology implies the presence of uncertainty, making it possible to develop a schedule of the project without a precise information on details and time required for all of its components. The most popular part of PERT is a method of the critical path, based on the construction of the network schedule (PERT network diagram). ConceptDraw Office delivers you the best way to create PERT chart for your project using compatibility between ConceptDraw PROJECT and ConceptDraw PRO.Block Diagrams
Block diagrams solution extends ConceptDraw PRO software with templates, samples and libraries of vector stencils for drawing the block diagrams.
This example was created on the base of the hunting and fishing license sales flowchart from the COMPASS portal of the Department of Natural Resources, Maryland, U.S.
[compass.dnr.maryland.gov/ Help/ Topic/ ViewTopic/ ExecutingaSalesTransaction]
The COMPASS portal "allow you quick and easy access to hunting and fishing licenses, regulations and other important information about outdoor recreation in Maryland." [compass.dnr.maryland.gov/ DnrCompassPortal]
The example "Hunting and fishing license sales flowchart" was created using the ConceptDraw PRO diagramming and vector drawing software extended with the Sales Flowcharts solution from the Marketing area of ConceptDraw Solution Park.
Business Diagram Software
ConceptDraw business diagram Software is the most powerful business and relational charting software. Create advanced, completely customizable flow charts, organizational charts, business process diagrams, work flow diagrams, audit diagram, value stream maps, TQM diagrams, ERD diagrams, EPC diagrams, marketing diagrams, cause and effect diagrams, dashboards, infographics and other relational business diagrams from your data.How To Draw Building Plans
Building Plans are a set of scaled drawings, which show a view from above, the relationships between rooms, spaces and other physical features at one level of a structure. Usually plans are drawn or printed on paper, but they can take the form of a digital file.Quick building plan software for creating great-looking office layout, home floor, electrical plan, commercial floor plans, Storage building plans, expo and shopping mall building plans, school and training building plans, cafe or restaurant plans, gym and spa area plans, sport field plans, electric and telecom building plans, fire and emergency plans, HVAC plans, security and access plans, plumbing and piping plans and plant layouts.
This flowchart example shows the lifecycle of an invoice in Microsoft Dynamics CRM. It was redesigned from the Wikimedia Commons file: Invoice lifecycle.svg. [commons.wikimedia.org/ wiki/ File:Invoice_ lifecycle.svg]
"Microsoft Dynamics CRM is a customer relationship management software package developed by Microsoft. Out of the box, the product focuses mainly on Sales, Marketing, and Service (help desk) sectors...
Dynamics CRM is a server-client application, which, like Microsoft SharePoint, is primarily an IIS-based web application which also supports extensive web services interfaces. Clients access Dynamics CRM either by using a Browser or by a thick client plug-in to Microsoft Outlook." [Microsoft Dynamics CRM. Wikipedia]
The process flowchart example "Invoice lifecycle" was created using the ConceptDraw PRO diagramming and vector drawing software extended with the Sales Flowcharts solution from the Marketing area of ConceptDraw Solution Park.
- Sample Data Flow Diagram For Online Shop
- How To Draw Flowchart For Online Shopping Site
- Online store social media response flowchart | Visual shopping ...
- Flow Chart Of Online Shopping Website
- Flowchart For Online Shopping For Electronics
- Flowchart Of Online Shopping Of Artwork
- Online store social media response flowchart | Example of DFD for ...
- State Diagram Example - Online Store | Example of DFD for Online ...
- How To Draw Flow Diagram For Shopping Website
- Flowchart With Explanation For Online Medicine Shopping Site
- Example of DFD for Online Store ( Data Flow Diagram ).
- Online store social media response flowchart | Accounting ...
- Dfd Diagram For Online Shopping Website
- Sample Of Online Shopping Center Flow Chart
- Sample Flowchart For Online Shopping
- Example of DFD for Online Store (Data Flow Diagram ) DFD ...
- Flow Chart Diagram Online Shopping Examples
- Store Layout Software | Example of DFD for Online Store (Data Flow ...
- Flowchart Marketing Process. Flowchart Examples | UK labour ...
- Example of DFD for Online Store (Data Flow Diagram ) DFD ...
- ERD | Entity Relationship Diagrams, ERD Software for Mac and Win
- Flowchart | Basic Flowchart Symbols and Meaning
- Flowchart | Flowchart Design - Symbols, Shapes, Stencils and Icons
- Flowchart | Flow Chart Symbols
- Electrical | Electrical Drawing - Wiring and Circuits Schematics
- Flowchart | Common Flowchart Symbols