This site uses cookies. By continuing to browse the ConceptDraw site you are agreeing to our Use of Site Cookies.

Cross Functional Flowchart Symbols

The excellent possibility to create attractive Cross Functional Flowcharts for step-by-step visualization the operations of a business process flow of any degree of detailing is offered by ConceptDraw’s Cross-Functional Flowcharts solution. The extensive selection of commonly used vector cross functional flowchart symbols allow you to demonstrate the document flow in organization, to represent each team member’s responsibilities and how processes get shared or transferred between different teams and departments.
HelpDesk

How to Create a Time Series Dashboard

Time Series Dashboard means an integration of some type of diagrams: Line Charts, Bar Charts, Column Charts, and Dot Plots on a single space. The ConceptDraw Time Series Dashboard solution can be used to create the interactive Time Series dashboard. The libraries of Time Series Charts solution contain the Live Objects, that can change their appearance depending on the external data. Each chart from the Time Series dashboard displays particular source data. You can include Time Series Charts in your business or technical dashboards to show and compare the items changing over time.

Cross-Functional Flowchart

Use of Cross-Functional Flowchart is a clear way of showing each team member’s responsibilities and how processes get shared or transferred between different responsible people, teams and departments. Use the best flowchart maker ConceptDraw PRO with a range of standardized cross-functional flowchart symbols to create the Cross-Functional Flowcharts simply and to visualize the relationship between a business process and the functional units responsible for that process. To draw the most quickly Cross-Functional Flowcharts, Cross Functional Process Maps, or Cross Functional Process Flow Diagrams, start with a Cross-functional flowchart samples and templates from ConceptDraw Solution Park. The ConceptDraw Arrows10 and RapidDraw technologies will be also useful for you in drawing. ConceptDraw PRO supports designing both types - horizontal and vertical Cross-functional flowcharts. A vertical layout makes the accents mainly on the functional units while a horizontal layout - on the process. If you need a Visio alternative in Mac OS X, try ConceptDraw PRO. Its interface is very intuitive and it’s actually much easier to use than Visio, yet somehow it’s just as powerful if not more so. ConceptDraw PRO performs professional quality work and seamless Visio interaction.
How to Draw a Cross Functional Flowchart using visio alternative ConceptDraw PRO as visio for mac

Line Chart Examples

The Line Graphs solution from Graphs and Charts area of ConceptDraw Solution Park contains a set of examples, templates and design elements library of line and scatter charts. Use it to draw line and scatter graphs using ConceptDraw PRO diagramming and vector drawing software for illustrating your documents, presentations and websites.
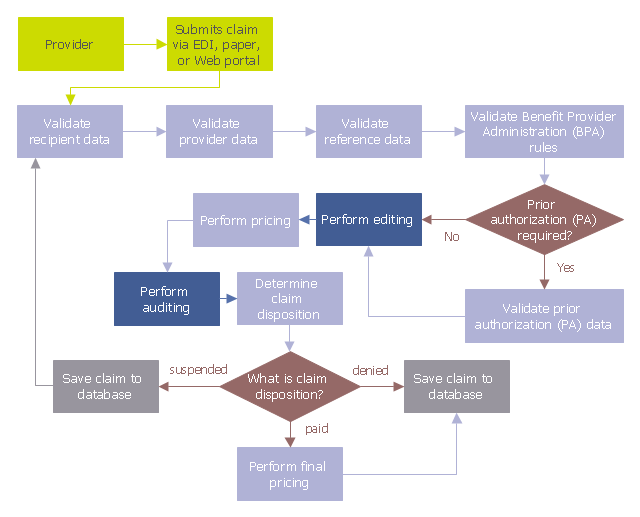
This audit flowchart sample was created on the base of the figure illustrating the webpage "Introduction to Claims Edits, Audits, Error Status Codes, and EOBs" from the website of the Ohio Department of Medicaid.
"Process.
As claims are submitted and processed, the data on the claim is validated against a series of rules, edits, and audits. Review the flowchart below to follow the sequence in which claim data is processed to see where edits and audits impact the claim adjudication process." [medicaid.ohio.gov/ PROVIDERS/ MITS/ MITSNonProviderCommunications/ MITSOnlineTutorials/ IntroductiontoClaimsEdits,Audits.aspx]
The audit flowchart example "Claim data processing" was created using the ConceptDraw PRO diagramming and vector drawing software extended with the Audit Flowcharts solution from the Finance and Accounting area of ConceptDraw Solution Park.
www.conceptdraw.com/ solution-park/ finance-audit-flowcharts
Audit flowchart
Audit flowchart, tagged process, decision,

Process Flowchart

The main reason of using Process Flowchart or PFD is to show relations between major parts of the system. Process Flowcharts are used in process engineering and chemical industry where there is a requirement of depicting relationships between major components only and not include minor parts. Process Flowcharts for single unit or multiple units differ in their structure and implementation. ConceptDraw PRO is Professional business process mapping software for making Process flowcharts, Process flow diagram, Workflow diagram, flowcharts and technical illustrations for business documents and also comprehensive visio for mac application. Easier define and document basic work and data flows, financial, production and quality management processes to increase efficiency of your business with ConcepDraw PRO. Business process mapping software with Flowchart Maker ConceptDraw PRO includes extensive drawing tools, rich examples and templates, process flowchart symbols and shape libraries, smart connectors that allow you create the flowcharts of complex processes, process flow diagrams, procedures and information exchange. Process Flowchart Solution is project management workflow tools which is part ConceptDraw Project marketing project management software. Drawing charts, diagrams, and network layouts has long been the monopoly of Microsoft Visio, making Mac users to struggle when needing such visio alternative like visio for mac, it requires only to view features, make a minor edit to, or print a diagram or chart. Thankfully to MS Visio alternative like ConceptDraw PRO software, this is cross-platform charting and business process management tool, now visio alternative for making sort of visio diagram is not a problem anymore however many people still name it business process visio tools.
How To Create a Process Flow Chart (business process modelling techniques)

time series dashboard, time varying parameters Time Series Dashboard

time series dashboard, time varying parameters
Time series dashboard solution extends ConceptDraw PRO software with templates, samples and vector stencils libraries with charts, graphs and plots for drawing the visual dashboards showing data time series.

Business Process Flowchart Symbols

Business process modeling is known in the corporate world as an excellent tool which can speak. Business process flowcharts, diagrams and maps are used to define the business processes in terms of inputs and outputs, to visually represent and effectively explain complex business processes of an enterprise, and also showcase decisions on a single piece of paper. The process of business process mapping supposes the use of special business process flowchart symbols predefined by Business Process Modeling Notation (BPMN) and taking their roots from the data processing diagrams and programming flow charts. In other words the BPMN standard notation is a common language used for business process design and implementation, that guarantees a clarity of designed Business Process Flowcharts for all business analysts, technical developers and business managers. The ability to create professionally-looking Business Process flowcharts, maps and diagrams, is provided by powerful ConceptDraw PRO software and the Business Process Mapping solution included to ConceptDraw Solution Park.

ConceptDraw Solution Park ConceptDraw Solution Park

ConceptDraw Solution Park
ConceptDraw Solution Park collects graphic extensions, examples and learning materials

Agile Methodology

Agile methodology is an excellent alternative to waterfall and traditional sequential development. ConceptDraw PRO software extended with SCRUM Workflow solution is ideal for quick and easy designing various diagrams, charts, mind maps and schematics illustrating software development using Agile methodologies, and in particular Scrum methodology.

What is the Accounting Cycle?

What is the accounting cycle? The accounting cycle is a sequence of steps that occur in the accounting period and include the processes of identifying, collecting, analyzing documents, recording transactions, classifying, summarizing, and reporting financial information of an organization.

Line Graph Charting Software

To design line and scatter charts use ConceptDraw PRO diagramming and vector drawing software extended with Line Graphs solution from Graphs and Charts area of ConceptDraw PRO Solution Park. (Line chart, scatter chart, 2d chart).

How to Create Presentation of Your Project Gantt Chart

During the planning, discussing and execution of a project you may need to prepare a presentation using project views such as the Gantt Chart, Multiproject Dashboard or Resource Usage View. It’s easy do with ConceptDraw PROJECT!