Accounting Flowchart Symbols

Business Process Flowchart Symbols

Accounting Information Systems Flowchart Symbols

The vector stencils library "Flowchart" contains 26 symbols for drawing flowcharts.
Use these shapes to draw your flow charts in the ConceptDraw PRO diagramming and vector drawing software extended with the Flowcharts solution from the area "What is a Diagram" of ConceptDraw Solution Park.
www.conceptdraw.com/ solution-park/ diagram-flowcharts
Use these shapes to draw your flow charts in the ConceptDraw PRO diagramming and vector drawing software extended with the Flowcharts solution from the area "What is a Diagram" of ConceptDraw Solution Park.
www.conceptdraw.com/ solution-park/ diagram-flowcharts
Terminator

Process

Decision

Delay

Subroutine

Data

Document

Multiple documents

Preparation

Display

Manual input

Manual loop

Loop limit

Connector

Off-page connector

Off-page connector

Off-page connector

Off-page connector

Or

Summing junction

Collate

Sort

Merge

Stored data

Database

Internal storage

Basic of Flowchart: Meaning and Symbols


The vector stencils library "HR flowchart" contains 62 flowchart symbols.
Use it to draw your HR flowcharts, workflow diagrams and process charts with the ConceptDraw PRO diagramming and vector drawing software.
The flow chart symbols library "HR flowchart" is included in the HR Flowcharts solution from the Management area of ConceptDraw Solution Park.
Use it to draw your HR flowcharts, workflow diagrams and process charts with the ConceptDraw PRO diagramming and vector drawing software.
The flow chart symbols library "HR flowchart" is included in the HR Flowcharts solution from the Management area of ConceptDraw Solution Park.
Annotation

Card

Check / audit (diamond)
-hr-flowchart---vector-stencils-library.png--diagram-flowchart-example.png)
Check / audit (square)
-hr-flowchart---vector-stencils-library.png--diagram-flowchart-example.png)
Collate

Comment / note symbol (brace)
-hr-flowchart---vector-stencils-library.png--diagram-flowchart-example.png)
Communication link

Compare (diamond)
-hr-flowchart---vector-stencils-library.png--diagram-flowchart-example.png)
Compare (square)
-hr-flowchart---vector-stencils-library.png--diagram-flowchart-example.png)
Completed form

Concurrency symbol (fork / join)
-hr-flowchart---vector-stencils-library.png--diagram-flowchart-example.png)
Conditional selector

Control transfer

Data input / output

Database

Decision

Decision indicator - No

Decision indicator - Yes

Delay

Direct access storage

Disk storage

Display

Divided process (table view)
-hr-flowchart---vector-stencils-library.png--diagram-flowchart-example.png)
Document

Entity (rounded)
-hr-flowchart---vector-stencils-library.png--diagram-flowchart-example.png)
Event

Extract

Flow line

Internal storage

Junction symbol

Lined document

Lined / shaded process

Loop limit

Manual file

Manual input

Manual operation

Merge

Multi document

Multi process

Off-page reference - arrow
Off-page reference - incoming

Off-page reference - outgoing

On-page reference/ Inspection point

Or

Page

Paper tape

Predefined process

Prepare conditional

Process step

Reference point

Sequential access storage

Sort

Start (circle)
-hr-flowchart---vector-stencils-library.png--diagram-flowchart-example.png)
Start (ellipse)
-hr-flowchart---vector-stencils-library.png--diagram-flowchart-example.png)
Stickman pictogram

Stored data

Summary

Tagged document

Tagged process

Terminal point

Title block

Torso pictogram

The vector stencils library "Sales flowchart" contains 62 sales process flow chart symbols.
Use these flow chart icon set to draw your sales flowcharts, workflow diagrams and process charts with the ConceptDraw PRO diagramming and vector drawing software.
The sales process flowchart symbols library "Sales flowchart" is included in the Sales Flowcharts solution from the Marketing area of ConceptDraw Solution Park.
Annotation

Card

Check / audit (diamond)
-sales-flowchart---vector-stencils-library.png--diagram-flowchart-example.png)
Check / audit (square)
-sales-flowchart---vector-stencils-library.png--diagram-flowchart-example.png)
Collate

Comment / note symbol (brace)
-sales-flowchart---vector-stencils-library.png--diagram-flowchart-example.png)
Communication link

Compare (diamond)
-sales-flowchart---vector-stencils-library.png--diagram-flowchart-example.png)
Compare (square)
-sales-flowchart---vector-stencils-library.png--diagram-flowchart-example.png)
Completed form

Concurrency symbol (fork / join)
-sales-flowchart---vector-stencils-library.png--diagram-flowchart-example.png)
Conditional selector

Control transfer

Database

Data input / output

Decision

Decision indicator - No

Decision indicator - Yes

Delay

Direct access storage

Disk storage

Display

Divided process (table view)
-sales-flowchart---vector-stencils-library.png--diagram-flowchart-example.png)
Document

Entity (rounded)
-sales-flowchart---vector-stencils-library.png--diagram-flowchart-example.png)
Event

Extract

Flow line

Internal storage

Junction symbol

Lined document

Lined / shaded process

Loop limit

Manual file

Manual input

Manual operation

Merge

Multi document

Multi process

Off-page reference - arrow
Off-page reference - incoming

Off-page reference - outgoing

On-page reference/ Inspection point

Or

Page

Paper tape

Predefined process

Prepare conditional

Process step

Reference point

Sequential access storage

Sort

Start (circle)
-sales-flowchart---vector-stencils-library.png--diagram-flowchart-example.png)
Start (ellipse)
-sales-flowchart---vector-stencils-library.png--diagram-flowchart-example.png)
Stickman pictogram

Stored data

Summary

Tagged document

Tagged process

Terminal point

Title block

Torso pictogram

The vector stencils library "Sales flowchart" contains 62 sales process flow chart symbols.
Use these flow chart icon set to draw your sales flowcharts, workflow diagrams and process charts with the ConceptDraw PRO diagramming and vector drawing software.
The sales process flowchart symbols library "Sales flowchart" is included in the Sales Flowcharts solution from the Marketing area of ConceptDraw Solution Park.
Use these flow chart icon set to draw your sales flowcharts, workflow diagrams and process charts with the ConceptDraw PRO diagramming and vector drawing software.
The sales process flowchart symbols library "Sales flowchart" is included in the Sales Flowcharts solution from the Marketing area of ConceptDraw Solution Park.
Annotation
Card
Check / audit (diamond)
Check / audit (square)
Collate
Comment / note symbol (brace)
Communication link
Compare (diamond)
Compare (square)
Completed form
Concurrency symbol (fork / join)
Conditional selector
Control transfer
Database
Data input / output
Decision
Decision indicator - No
Decision indicator - Yes
Delay
Direct access storage
Disk storage
Display
Divided process (table view)
Document
Entity (rounded)
Event
Extract
Flow line
Internal storage
Junction symbol
Lined document
Lined / shaded process
Loop limit
Manual file
Manual input
Manual operation
Merge
Multi document
Multi process
Off-page reference - arrow
Off-page reference - incoming
Off-page reference - outgoing
On-page reference/ Inspection point
Or
Page
Paper tape
Predefined process
Prepare conditional
Process step
Reference point
Sequential access storage
Sort
Start (circle)
Start (ellipse)
Stickman pictogram
Stored data
Summary
Tagged document
Tagged process
Terminal point
Title block
Torso pictogram
The vector stencils library "Flowchart" contains 26 symbols for drawing flowcharts.
Use these shapes to draw your flow charts in the ConceptDraw PRO diagramming and vector drawing software extended with the Flowcharts solution from the area "What is a Diagram" of ConceptDraw Solution Park.
www.conceptdraw.com/ solution-park/ diagram-flowcharts
Use these shapes to draw your flow charts in the ConceptDraw PRO diagramming and vector drawing software extended with the Flowcharts solution from the area "What is a Diagram" of ConceptDraw Solution Park.
www.conceptdraw.com/ solution-park/ diagram-flowcharts
Terminator
Process
Decision
Delay
Subroutine
Data
Document
Multiple documents
Preparation
Display
Manual input
Manual loop
Loop limit
Connector
Off-page connector
Off-page connector
Off-page connector
Off-page connector
Or
Summing junction
Collate
Sort
Merge
Stored data
Database
Internal storage
The vector stencils library "Sales flowchart" contains 62 sales process flow chart symbols.
Use these flow chart icon set to draw your sales flowcharts, workflow diagrams and process charts with the ConceptDraw PRO diagramming and vector drawing software.
The sales process flowchart symbols library "Sales flowchart" is included in the Sales Flowcharts solution from the Marketing area of ConceptDraw Solution Park.
Use these flow chart icon set to draw your sales flowcharts, workflow diagrams and process charts with the ConceptDraw PRO diagramming and vector drawing software.
The sales process flowchart symbols library "Sales flowchart" is included in the Sales Flowcharts solution from the Marketing area of ConceptDraw Solution Park.
Annotation
Card
Check / audit (diamond)
Check / audit (square)
Collate
Comment / note symbol (brace)
Communication link
Compare (diamond)
Compare (square)
Completed form
Concurrency symbol (fork / join)
Conditional selector
Control transfer
Database
Data input / output
Decision
Decision indicator - No
Decision indicator - Yes
Delay
Direct access storage
Disk storage
Display
Divided process (table view)
Document
Entity (rounded)
Event
Extract
Flow line
Internal storage
Junction symbol
Lined document
Lined / shaded process
Loop limit
Manual file
Manual input
Manual operation
Merge
Multi document
Multi process
Off-page reference - arrow
Off-page reference - incoming
Off-page reference - outgoing
On-page reference/ Inspection point
Or
Page
Paper tape
Predefined process
Prepare conditional
Process step
Reference point
Sequential access storage
Sort
Start (circle)
Start (ellipse)
Stickman pictogram
Stored data
Summary
Tagged document
Tagged process
Terminal point
Title block
Torso pictogram
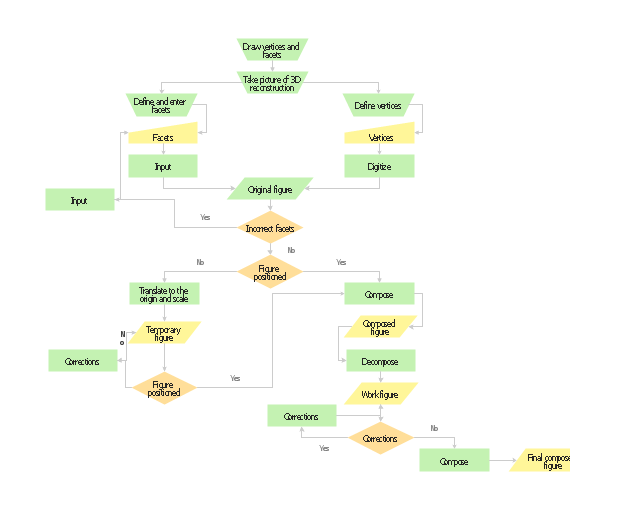
Planning scheme for the construction of a synthetic object.
"Computer-generated imagery (CGI) ... is the application of computer graphics to create or contribute to images in art, printed media, video games, films, television programs, commercials, and simulators. The visual scenes may be dynamic or static, and may be two-dimensional (2D), though the term "CGI" is most commonly used to refer to 3D computer graphics used for creating scenes or special effects in films and television." [Computer-generated imagery. Wikipedia]
The flow chart example "Synthetic object construction" was created using the ConceptDraw PRO diagramming and vector drawing software extended with the Flowcharts solution from the area "What is a Diagram" of ConceptDraw Solution Park.
Flowchart - Synthetic object construction
Account Flowchart Stockbridge SystemFlowchart Examples
 Create your own flow charts of data processing systems using the ConceptDraw DIAGRAM diagramming and vector drawing software extended with the Cross-Functional Flowcharts solution from the Business Processes area of ConceptDraw Solution Park.
This is a flowchart of a data processing system combining manual and computerized processing to handle accounts receivable, billing, and general ledger.
This flow chart sample was drawn on the base on the illustration of the article "Climate change impact on China food security in 2050" from the website of Chinese Academy of Agricultural Sciences .
Create your own flow charts of data processing systems using the ConceptDraw DIAGRAM diagramming and vector drawing software extended with the Cross-Functional Flowcharts solution from the Business Processes area of ConceptDraw Solution Park.
This is a flowchart of a data processing system combining manual and computerized processing to handle accounts receivable, billing, and general ledger.
This flow chart sample was drawn on the base on the illustration of the article "Climate change impact on China food security in 2050" from the website of Chinese Academy of Agricultural Sciences .
[caas.cn/ en/ newsroom/ research_ update/ 67347.shtml]
"Food security is a condition related to the ongoing availability of food. ...
According to the Food and Agriculture Organization (FAO), food security "exists when all people, at all times, have physical and economic access to sufficient, safe and nutritious food to meet their dietary needs and food preferences for an active and healthy life". ...
Extreme events, such as droughts and floods, are forecast to increase as climate change takes hold. Ranging from overnight floods to gradually worsening droughts, these will have a range of impacts on the agricultural sector. ...
According to the Climate & Development Knowledge Network report Managing Climate Extremes and Disasters in the Agriculture Sectors: Lessons from the IPCC SREX Report, the impacts will include changing productivity and livelihood patterns, economic losses, and impacts on infrastructure, markets and food security. Food security in future will be linked to our ability to adapt agricultural systems to extreme events." [Food security. Wikipedia]
The flowchart example "Food security assessment" was created using the ConceptDraw PRO diagramming and vector drawing software extended with the Flowcharts solution from the area "What is a Diagram" of ConceptDraw Solution Park.
Flowchart

Data Flow Diagram
 Data Flow Diagram (DFD) is part of the Structured Systems Analysis and Design Methodology (SSADM), which is intended for information systems projection and analysis. Data Flow Diagrams allow graphically to represent the data flows in the information system and analyze the data processing during the structural projection. This type of diagrams lets visually show a work of information system and results of this work, it is often used in connection with human processes and can be displayed as a Workflow diagram. Data Flow Diagram visualizes processes and functions, external entities, data depositories, and data flows connecting these elements and indicating direction and data character. Each of these elements used for DFD has its own graphical notation. There are two notations to draw DFDs - Yourdon & Coad and Gane & Sarson.
ConceptDraw DIAGRAM extended with Data Flow Diagrams (DFD) solution from the Software Development area is ideal for designing professional-looking DFDs, which can be then easily exported in various formats.
HelpDesk
Data Flow Diagram (DFD) is part of the Structured Systems Analysis and Design Methodology (SSADM), which is intended for information systems projection and analysis. Data Flow Diagrams allow graphically to represent the data flows in the information system and analyze the data processing during the structural projection. This type of diagrams lets visually show a work of information system and results of this work, it is often used in connection with human processes and can be displayed as a Workflow diagram. Data Flow Diagram visualizes processes and functions, external entities, data depositories, and data flows connecting these elements and indicating direction and data character. Each of these elements used for DFD has its own graphical notation. There are two notations to draw DFDs - Yourdon & Coad and Gane & Sarson.
ConceptDraw DIAGRAM extended with Data Flow Diagrams (DFD) solution from the Software Development area is ideal for designing professional-looking DFDs, which can be then easily exported in various formats.
HelpDesk
How to Create Flowchart Using Standard Flowchart Symbols
 Flowcharts are used to display an algorithm for consistent execution of certain steps. Flowchart is probably the easiest way to make a graphical representation of any process. Flowcharts use the set of standard geometric symbols and arrows to define relationships. ConceptDraw DIAGRAM allows you to create professional flowchart quickly and easily. The ability to create flowcharts is contained in the Flowcharts solution. The solution provides a set of special tools for creating flowcharts.
The vector stencils library "Accounting flowcharts" contains 14 flow chart symbols.
Flowcharts are used to display an algorithm for consistent execution of certain steps. Flowchart is probably the easiest way to make a graphical representation of any process. Flowcharts use the set of standard geometric symbols and arrows to define relationships. ConceptDraw DIAGRAM allows you to create professional flowchart quickly and easily. The ability to create flowcharts is contained in the Flowcharts solution. The solution provides a set of special tools for creating flowcharts.
The vector stencils library "Accounting flowcharts" contains 14 flow chart symbols.
This library was created according the article " Accounting Flowchart: Purchasing, Receiving, Payable and Payment"
http:/ / accounting-financial-tax.com/ 2010/ 04/ accounting-flowchart-purchasing-receiving-payable-and-payment/
from the website " Accounting Financial Tax" http:/ / accounting-financial-tax.com , with the kind permission of the author.
Use this library for drawing the accounting flowcharts in the ConceptDraw PRO software extended with the Accounting Flowcharts solution from the Finance and Accounting area of ConceptDraw Solution Park.
www.conceptdraw.com/ solution-park/ finance-accounting-flowcharts
On-page Connector
 Off-page Connector
 Punched Card
 Annotation
 Magnetic Tape
 Punched Tape
 Manual Input
 Angled Connector
 Double Tree Connector
 Magnetic Disk
 Manual File
 Process
 Manual Operation
 Document

Data Flow Diagram Model
 Data Flow Diagram (DFD) is a technique of graphical structural analysis, describing the sources external to the system, recipients of data, also logical functions, data flows and data stores that are accessed. The DFD's goal is to show how each process converts its inputs into the outputs and to identify relationships between these processes, at this make the system's description clear and understandable at every level of detail. Historically happened that for describing Data Flow Diagrams are used two notations - Yourdon and Gane-Sarson that differ each from other by graphical representation of symbols. The DFD model, like most other structural models is a hierarchical model. Each process can be subjected to decomposition on the structural components, the relationships between which in the same notation can be shown on a separate diagram. Typically, several DFD models are built when modeling the system.
ConceptDraw DIAGRAM software enhanced with Data Flow Diagrams solution ideally suits for creation DFD models and professional drawing Data Flow Diagrams.
The vector stencils library "Audit flowcharts" contains 31 flow chart symbols.
Data Flow Diagram (DFD) is a technique of graphical structural analysis, describing the sources external to the system, recipients of data, also logical functions, data flows and data stores that are accessed. The DFD's goal is to show how each process converts its inputs into the outputs and to identify relationships between these processes, at this make the system's description clear and understandable at every level of detail. Historically happened that for describing Data Flow Diagrams are used two notations - Yourdon and Gane-Sarson that differ each from other by graphical representation of symbols. The DFD model, like most other structural models is a hierarchical model. Each process can be subjected to decomposition on the structural components, the relationships between which in the same notation can be shown on a separate diagram. Typically, several DFD models are built when modeling the system.
ConceptDraw DIAGRAM software enhanced with Data Flow Diagrams solution ideally suits for creation DFD models and professional drawing Data Flow Diagrams.
The vector stencils library "Audit flowcharts" contains 31 flow chart symbols.
Use it in accounting, financial management, fiscal information tracking, money management, decision making, and financial inventories to create auditing flowchart diagrams in the ConceptDraw PRO diagramming and vector drawing software extended with the Audit Flowcharts solution from the Finance and Accounting area of ConceptDraw Solution Park.
www.conceptdraw.com/ solution-park/ finance-audit-flowcharts
Tagged Process
 Tagged Document
 Decision
 Manual operation
 Terminator
 Manual File
 Display
 On-page reference
 Off-page reference
 Divided (Table View)
-audit-flowcharts---vector-stencils-library.png--diagram-flowchart-example.png) Process
Process
 Lined / shaded process
 Lined Document
 Document
 Database
 Disk Storage
 Floppy disk
 Magnetic Tape
 Data Transmission
 Manual input
 Check 1 (audit)
-audit-flowcharts---vector-stencils-library.png--diagram-flowchart-example.png) Compare 1
Compare 1
 Reference point
 Check 2 (audit)
-audit-flowcharts---vector-stencils-library.png--diagram-flowchart-example.png) Compare 2
Compare 2
 Event
Event
 Entity (Rounded Corners)
-audit-flowcharts---vector-stencils-library.png--diagram-flowchart-example.png) Title Block
Title Block
 Condition
 Input/ Output
 Delay
Delay

Data Flow Diagram Symbols. DFD Library
 Data Flow Diagrams graphically represent the information transfers and process steps of a system. They visually depict how data are processed by a system in terms of inputs and outputs, how occurs the input in a system, how the data flow through an information system and where they are stored, and how occurs output from the system. DFDs give the overview of the system and models the processes aspects, they are maintained with other methods of structured systems analysis. The main goal of DFDs is achievement of understanding between developers and users. For their construction are used two notations - Gane-Sarson and Yourdon, each of them uses its own set of symbols.
Data Flow Diagrams solution from Software Development area extends the ConceptDraw DIAGRAM software with templates, samples, and predesigned libraries of data flow diagram symbols for both notations, allowing you easy design the process-oriented and data-oriented models, draw the Data Flow Diagrams, Data Flowcharts, Data Process Diagrams, Information Flow Diagrams, Structured Analysis Diagrams, etc.
Data Flow Diagrams graphically represent the information transfers and process steps of a system. They visually depict how data are processed by a system in terms of inputs and outputs, how occurs the input in a system, how the data flow through an information system and where they are stored, and how occurs output from the system. DFDs give the overview of the system and models the processes aspects, they are maintained with other methods of structured systems analysis. The main goal of DFDs is achievement of understanding between developers and users. For their construction are used two notations - Gane-Sarson and Yourdon, each of them uses its own set of symbols.
Data Flow Diagrams solution from Software Development area extends the ConceptDraw DIAGRAM software with templates, samples, and predesigned libraries of data flow diagram symbols for both notations, allowing you easy design the process-oriented and data-oriented models, draw the Data Flow Diagrams, Data Flowcharts, Data Process Diagrams, Information Flow Diagrams, Structured Analysis Diagrams, etc.
Database Flowchart Symbols
 Data base diagrams describes inter-related data and tables. It describes roles and relationships, internal and external dependencies, data exchange conventions and structures of knowledge domain.
ConceptDraw Software provides number of data-base chart libraries including major 49 vector symbols. Use these DFD flowchart symbol libraries to design data-base structure and models, use it to design data base process-oriented models, or simple data-oriented models. The are special drawing tools for making data flowcharts, data process diagrams, structured analysis diagrams, and information flow diagrams.
Data base diagrams describes inter-related data and tables. It describes roles and relationships, internal and external dependencies, data exchange conventions and structures of knowledge domain.
ConceptDraw Software provides number of data-base chart libraries including major 49 vector symbols. Use these DFD flowchart symbol libraries to design data-base structure and models, use it to design data base process-oriented models, or simple data-oriented models. The are special drawing tools for making data flowcharts, data process diagrams, structured analysis diagrams, and information flow diagrams.
Flowchart Examples
Create your own flow charts of data processing systems using the ConceptDraw DIAGRAM diagramming and vector drawing software extended with the Cross-Functional Flowcharts solution from the Business Processes area of ConceptDraw Solution Park.
This is a flowchart of a data processing system combining manual and computerized processing to handle accounts receivable, billing, and general ledger.
This flow chart sample was drawn on the base on the illustration of the article "Climate change impact on China food security in 2050" from the website of Chinese Academy of Agricultural Sciences .
[caas.cn/ en/ newsroom/ research_ update/ 67347.shtml]
"Food security is a condition related to the ongoing availability of food. ...
According to the Food and Agriculture Organization (FAO), food security "exists when all people, at all times, have physical and economic access to sufficient, safe and nutritious food to meet their dietary needs and food preferences for an active and healthy life". ...
Extreme events, such as droughts and floods, are forecast to increase as climate change takes hold. Ranging from overnight floods to gradually worsening droughts, these will have a range of impacts on the agricultural sector. ...
According to the Climate & Development Knowledge Network report Managing Climate Extremes and Disasters in the Agriculture Sectors: Lessons from the IPCC SREX Report, the impacts will include changing productivity and livelihood patterns, economic losses, and impacts on infrastructure, markets and food security. Food security in future will be linked to our ability to adapt agricultural systems to extreme events." [Food security. Wikipedia]
The flowchart example "Food security assessment" was created using the ConceptDraw PRO diagramming and vector drawing software extended with the Flowcharts solution from the area "What is a Diagram" of ConceptDraw Solution Park.
Flowchart
Data Flow Diagram
HelpDesk
How to Create Flowchart Using Standard Flowchart Symbols
The vector stencils library "Accounting flowcharts" contains 14 flow chart symbols.
This library was created according the article " Accounting Flowchart: Purchasing, Receiving, Payable and Payment"
http:/ / accounting-financial-tax.com/ 2010/ 04/ accounting-flowchart-purchasing-receiving-payable-and-payment/
from the website " Accounting Financial Tax" http:/ / accounting-financial-tax.com , with the kind permission of the author.
Use this library for drawing the accounting flowcharts in the ConceptDraw PRO software extended with the Accounting Flowcharts solution from the Finance and Accounting area of ConceptDraw Solution Park.
www.conceptdraw.com/ solution-park/ finance-accounting-flowcharts
On-page Connector
Off-page Connector
Punched Card
Annotation
Magnetic Tape
Punched Tape
Manual Input
Angled Connector
Double Tree Connector
Magnetic Disk
Manual File
Process
Manual Operation
Document
Data Flow Diagram Model
The vector stencils library "Audit flowcharts" contains 31 flow chart symbols.
Use it in accounting, financial management, fiscal information tracking, money management, decision making, and financial inventories to create auditing flowchart diagrams in the ConceptDraw PRO diagramming and vector drawing software extended with the Audit Flowcharts solution from the Finance and Accounting area of ConceptDraw Solution Park.
www.conceptdraw.com/ solution-park/ finance-audit-flowcharts
Tagged Process
Tagged Document
Decision
Manual operation
Terminator
Manual File
Display
On-page reference
Off-page reference
Divided (Table View)
Process
Lined / shaded process
Lined Document
Document
Database
Disk Storage
Floppy disk
Magnetic Tape
Data Transmission
Manual input
Check 1 (audit)
Compare 1
Reference point
Check 2 (audit)
Compare 2
Event
Entity (Rounded Corners)
Title Block
Condition
Input/ Output
Delay
Data Flow Diagram Symbols. DFD Library
Database Flowchart Symbols
- Basic Flowchart Symbols and Meaning | Technical Flow Chart ...
- Sales flowchart - Vector stencils library | Input Output Box In Flowchart
- Basic Flowchart Symbols and Meaning | Technical Flow Chart ...
- Cross Functional Flowchart Examples | Examples Of Input Output ...
- Audit flowcharts - Vector stencils library | Accounting Information ...
- Accounting Flowchart Symbols | Flowchart Input Symbol
- Basic Flowchart Symbols and Meaning | Account Flowchart ...
- Cross Functional Flowchart Examples | Input Output Box Flowchart ...
- Accounting Information Systems Flowchart Symbols | Draw Input ...
- Basic Flowchart Symbols and Meaning | Accounting Flowchart ...