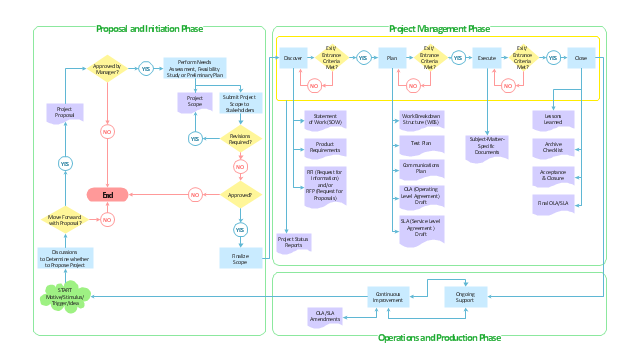
"Product life cycle is a business analysis that attempts to identify a set of common stages in the life of commercial products. In other words the 'Product Life cycle' PLC is used to map the lifespan of the product such as the stages through which a product goes during its lifespan. ...
The stages of a product's life cycle... :
1. INTRODUCTION... 2. GROWTH... 3. MATURITY... 4. DECLINE...
The product life cycle is an important concept in marketing. It includes four stages that a product goes through from when it was first thought of until it is eliminated from the industry. Not all products reach this final stage. Some continue to grow and others rise and fall." [Product lifecycle. Wikipedia]
The flow chart example "Product life cycle process" was created using the ConceptDraw PRO diagramming and vector drawing software extended with the Flowcharts solution from the area "What is a Diagram" of ConceptDraw Solution Park.
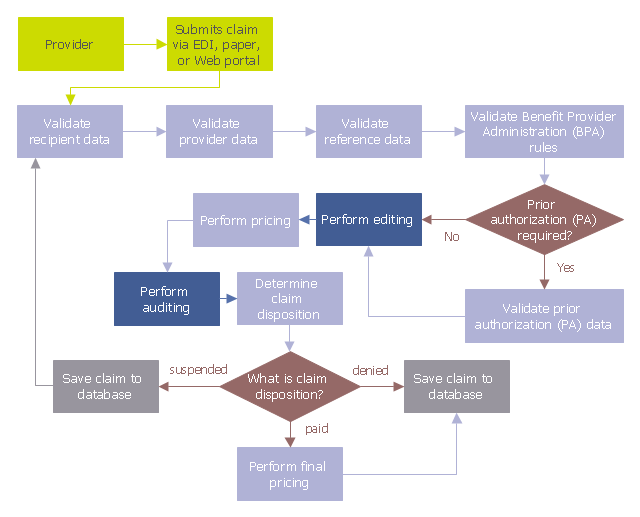
This audit flowchart sample was created on the base of the figure illustrating the webpage "Introduction to Claims Edits, Audits, Error Status Codes, and EOBs" from the website of the Ohio Department of Medicaid.
"Process.
As claims are submitted and processed, the data on the claim is validated against a series of rules, edits, and audits. Review the flowchart below to follow the sequence in which claim data is processed to see where edits and audits impact the claim adjudication process." [medicaid.ohio.gov/ PROVIDERS/ MITS/ MITSNonProviderCommunications/ MITSOnlineTutorials/ IntroductiontoClaimsEdits,Audits.aspx]
The audit flowchart example "Claim data processing" was created using the ConceptDraw PRO diagramming and vector drawing software extended with the Audit Flowcharts solution from the Finance and Accounting area of ConceptDraw Solution Park.
www.conceptdraw.com/ solution-park/ finance-audit-flowcharts
HelpDesk
How to Open MS Visio® 2013/2016 Files on a Mac®
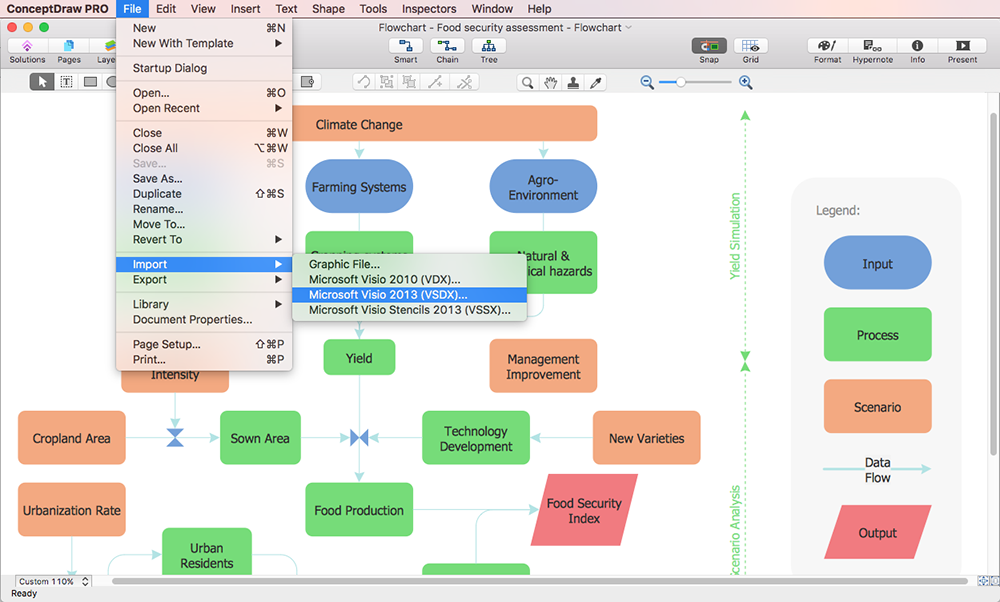
Powerful business graphics and diagramming tools are the norm and not the exception for today’s businesses. For years the de facto standard file format for business has been Microsoft Visio™. Many people involved in visual communication need software tools that will read and write using the Visio file format. With the introduction of Visio 2013 Microsoft has changed the native file format used in earlier versions of Microsoft Visio. ConceptDraw PRO v10 file import and export works round-trip with the new Visio VSDX file format.HelpDesk
How to Convert MS Visio® 2003-2010 File to ConceptDraw PRO
ConceptDraw PRO v10 is such a viable alternative for individuals and organizations that are looking for a professional business solution. ConceptDraw PRO v10 file import and export works roundtrip with the Visio 2010-2013 file formats. With the introduction of Visio 2013 Microsoft has changed the native binary file format used in earlier versions of Microsoft Visio. ConceptDraw PRO v10 file import and export works with the new Visio VSDX file format and at the same time supports the improved import of VDX file format. To Import Visio vsd files to ConceptDraw follow the steps described in this article.- Introduction to bookkeeping: Accounting flowchart process ...
- Introduction to bookkeeping: Accounting flowchart process | How to ...
- Workflow to Make a Purchase. Accounting Flowchart Example ...
- Introduction to bookkeeping: Accounting flowchart process | Audit ...
- Introduction to bookkeeping: Accounting flowchart process | HR ...
- Introduction to bookkeeping: Accounting flowchart process | Steps of ...
- Introduction to bookkeeping: Accounting flowchart process | Steps of ...
- Introduction to bookkeeping: Accounting flowchart process ...
- Pyramid Diagram | Purchase funnel diagram | Introduction to ...
- Why Flowchart Important to Accounting Information System ...
- Purchase Process Flow Chart , Receiving Process Flow Chart
- Introduction to bookkeeping: Accounting flowchart process ...
- Introduction to bookkeeping: Accounting flowchart process | Banquet ...
- Block Diagram | Introduction to Cloud Computing Architecture | SDL ...
- Introduction to bookkeeping: Accounting flowchart process | What ...
- Computer Network Diagrams | Examples of Flowcharts , Org Charts ...
- Office Layout Plans | Use the Best FlowChart Tool for the Job ...
- Workflow to Make a Purchase. Accounting Flowchart Example ...
- Product life cycle process - Flowchart | Use the Best FlowChart Tool ...
- Introduction to Cloud Computing Architecture | Office Layout Plans ...


