This site uses cookies. By continuing to browse the ConceptDraw site you are agreeing to our Use of Site Cookies.

Kanban Board Software: A Comprehensive Overview

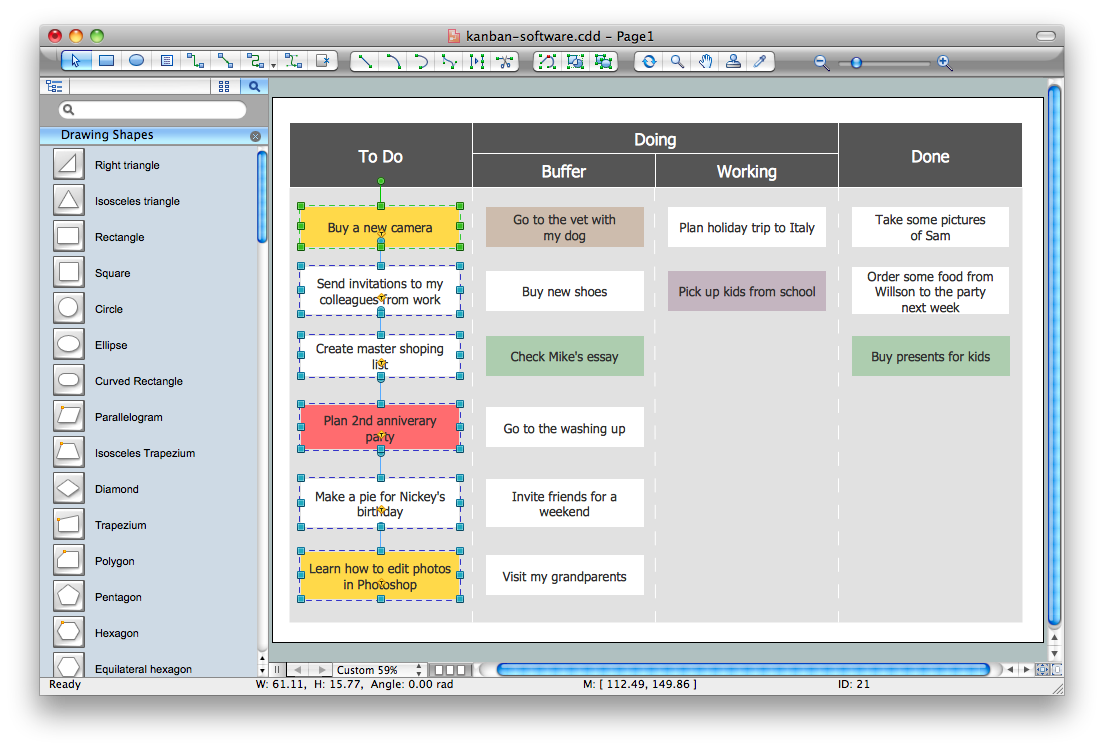
Kanban Board Software is incredibly useful tool that allows a team to work effective and productive, to analyze and improve the business processes, and visualize the workflows. ConceptDraw DIAGRAM with its numerous solutions is a powerful Kanban Board Software! Draw your own professional looking Kanban Board Diagrams quick, easy and effective with useful tools of ConceptDraw DIAGRAM diagramming and vector drawing software.

kanban board, kanban flow, kanban board agile, kanban board example Kanban Board

kanban board, kanban flow, kanban board agile, kanban board example
Kanban Board solution offers an effective way to build the Kanban boards in an electronic view. This solution includes a lot of Kanban Board samples and the great number of predesigned vector design objects of Task Boards, basic symbols, and icons of caution and markers, communication, complete and numbers, emoji and priorities, sticky notes, and team members. Use all advantages of the Kanban boards, Kanban board agile and ConceptDraw’s Kanban Board solution tools, start with any included Kanban Board example and improve your workflow efficiency and personal effectiveness.

Scrum board

ConceptDraw diagramming and vector drawing software extended with SCRUM Workflow solution from the Project Management area of ConceptDraw Solution Park is an ideal scrum tool and powerful software for creating pictorial and professional-looking Scrum board for easy tracking the workflow, for facilitating daily synchronization and productivity improvement.
HelpDesk

Kanban Board Tool for Project Managers and Developers

Kanban Board solution provides support for drawing Kanban boards in ConceptDraw DIAGRAM and for making Kanban board mind maps in ConceptDraw MINDMAP with the ability to automatically generate Kanban board charts in DIAGRAM.

project management, scrum, agile, business Project Management Package

project management, scrum, agile, business
Project Management Package includes a large set of graphical solutions from the ConceptDraw Solution Park. They are selected specially to help in completing the business and management goals, creating business models and modeling business processes, analyzing business progress and efficiency of projects implementation. The tools of this package's solutions are helpful to create number of diagrams and dashboards including Management Diagrams, Business diagrams, Bubble diagrams, Circle-spoke diagrams, Circular arrows diagrams, Venn diagrams, Scrum charts, Kanban boards, Business Intelligence maps, Business Metric charts, Dynamic charts, Project diagrams, Hierarchical charts, Influence diagrams, Work Breakdown Structures (WBS), Resource Breakdown Structures (RBS), PERT Diagrams, Project management charts, Project timelines, Gantt Charts, Funnel diagrams, Stakeholder Onion diagrams, and many more.

Value stream with ConceptDraw DIAGRAM

The Value stream is a totality of all actions on the projection, order composition and production: starting from creation a product project to launching this product, from order to delivery, from extraction of raw materials to ready product manufacturing. Value stream mapping is a process of visualization of these actions and creation of a detailed and graphical map.

ConceptDraw Solution Park ConceptDraw Solution Park

ConceptDraw Solution Park
ConceptDraw Solution Park collects graphic extensions, examples and learning materials
The vector stencils library "Value stream mapping" contains 43 VSM symbols.
Use it for drawing value stream maps in the ConceptDraw PRO diagramming and vector drawing software extended with the Value Stream Mapping solution from the Quality area of ConceptDraw Solution Park.
www.conceptdraw.com/ solution-park/ business-value-stream-mapping
Inventory
Inventory, inventory,
Inventory
Inventory, inventory,
Information Flow
Information Flow, information flow,
Shipment
Shipment, shipment,
Shipment
Shipment, shipment,
Material Flow
Material Flow, material flow, PUSH,
Material Pull
Material Pull, material pull,
FIFO Line
FIFO Line, FIFO line,
Truck shipment/Logistics
Truck shipment/Logistics, truck shipment, logistics,
Customer/Supplier
Customer/Supplier, customer, supplier,
Dedicated Process
Dedicated Process, dedicated process,
Shared Process
Shared Process, shared process,
Supermarket Parts
Supermarket Parts, supermarket,
Data Box
Data Box, data box,
Workcell
Workcell, workcell,
Kaizen Burst
Kaizen Burst, Kaizen burst,
Operator
Operator, operator,
Other
Other,
Production Control
Production Control, production control,
Manual Info
Manual Info, manual info,
Electronic Information Flow
Electronic Information Flow, electronic information flow,
Production Kanban
Production Kanban, production Kanban,
Withdrawal Kanban
Withdrawal Kanban, material withdrawal Kanban,
Signal Kanban
Signal Kanban, signal Kanban,
Kanban Post
Kanban Post, Kanban post,
Sequenced Pull
Sequenced Pull, sequenced pull ball,
Load Levelling
Load Levelling, load levelling,
MRP/ERP
MRP/ERP, MRP, ERP,
Go-See
Go-See, go see,
Pull Arrow
Pull Arrow, pull,
Manual Info
Manual Info, manual info,
Pull Arrow
Pull Arrow, pull,
Timeline Total
Timeline Total, timeline total,
Ship
Ship, ship,
Forklift Truck
Forklift Truck, forklift truck,
Plane
Plane, plane,
Process with Data
Process with Data, process with data, process, data,
Timeline
Timeline, timeline,
Timeline
Timeline, timeline,
Supermarket, 2
Supermarket, 2, supermarket,
Supermarket, 3
Supermarket, 3, supermarket,
Safety stock, 2
Safety stock, 2, safety stock,
Safety stock, 3
Safety stock, 3, safety stock,

scrum, agile methodology, scrum methodology, scrum board Scrum Workflow

scrum, agile methodology, scrum methodology, scrum board
The Scrum Workflow Solution extends the capabilities of ConceptDraw DIAGRAM with a large collection of professionally-designed samples and a selection of ready-to-use scrum design elements: scrum diagrams and arrows, scrum icons of people, artifacts, workflow, workspace and other colorful scrum clipart, and also scrum charts.

manufacturing drawings Manufacturing and Maintenance

manufacturing drawings
Manufacturing and maintenance solution extends ConceptDraw DIAGRAM software with illustration samples, templates and vector stencils libraries with clip art of packaging systems, industrial vehicles, tools, resources and energy.

Bundles Packages Area

Bundles
We are excited to introduce a new Bundles Catalogue, where ConceptDraw products are paired together or offered with thematic set of paid solutions.
"Value Stream Map (VSM)
1. A tool used to improve a process by identifying added value and eliminating waste.
2. A process map that follows the value creation process.
A. “strap yourself to the product (or service) and see where you go”
3. A process map with data added.
A. Times: processing, wait, cycle.
B. Quality: number of rejects.
C. Inventory.
D. Resources.
1) Number of people.
2) Space.
3) Distance traveled.
E. Whatever else is useful for analyzing the process." [ocw.mit.edu/ courses/ aeronautics-and-astronautics/ 16-660j-introduction-to-lean-six-sigma-methods-january-iap-2012/ lecture-notes/ MIT16_ 660JIAP12_ 1-6.pdf]
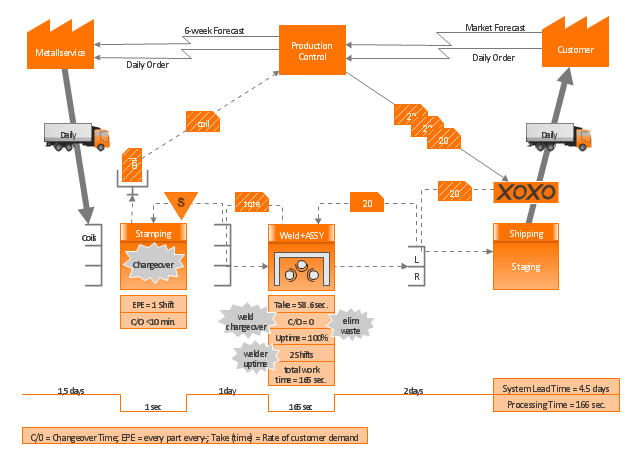
This sample VSM flowchart shows the value stream in a manufacturing, production control and shipping processes.
This value stream mapping diagram example was created using the ConceptDraw PRO diagramming and vector drawing software extended with the Value Stream Mapping solution from the Quality area of ConceptDraw Solution Park.
Value stream mapping
Value stream mapping, workcell, truck shipment, logistics, timeline total, timeline, supermarket, signal Kanban, shipment, pull, production control, production Kanban, operator, material withdrawal Kanban, manual info, load levelling, electronic information flow, dedicated process, data box, customer, supplier, Kanban post, Kaizen burst,
The vector stencils library "Workflow diagrams" contains 54 symbol icons of workflow diagrams.
Use these clipart to represent information flow, automation of business processes, business process re-engineering, accounting, management, and human resources tasks in industry, business, and manufacturing.
"The term workflow is more commonly used in particular industries, such as printing and professional domains, where it may have particular specialized meanings.
(1) Processes: A process is a more general notion than workflow and can apply to physical or biological processes, for instance; whereas a workflow is typically a process or collection of processes described in the context of work, such as all processes occurring in a machine shop.
(2) Planning and scheduling: A plan is a description of the logically necessary, partially ordered set of activities required to accomplish a specific goal given certain starting conditions. A plan, when augmented with a schedule and resource allocation calculations, completely defines a particular instance of systematic processing in pursuit of a goal. A workflow may be viewed as an (often optimal or near-optimal) realization of the mechanisms required to execute the same plan repeatedly.
(3) Flow control is a control concept applied to workflows, to distinguish from static control of buffers of material or orders, to mean a more dynamic control of flow speed and flow volumes in motion and in process. Such orientation to dynamic aspects is the basic foundation to prepare for more advanced job shop controls, such as just-in-time or just-in-sequence.
(4) In-transit visibility is a monitoring concept that applies to transported material as well as to work in process or work in progress, i.e., workflows." [Workflow. Wikipedia]
The example "Workflow diagram - Business" was drawn using the ConceptDraw PRO diagramming and vector drawing software extended with the Workflow Diagrams solution from the Business Processes area of ConceptDraw Solution Park.
Business - Work flow chart
Business - Work flow chart, shipping, sales, receiving, quality, production, payment, lorry, delivery, customer service, box, open, box,

project chart, project manager, project management process, project manager duties, project presentation, project scope management PM Mind Maps and Tables

project chart, project manager, project management process, project manager duties, project presentation, project scope management
PM Mind Maps and Tables solution extends the functional abilities of ConceptDraw DIAGRAM and ConceptDraw MINDMAP software with a set of drawing tools, professionally developed samples and templates allowing to prepare the project documentation including wide set of charts, tables, matrices, and Mind Maps. Being intended for the project manager, senior managers, team leaders and other project team members, it facilitates the execution of main project manager duties, contributes effective project planning and project management process implementation, increasing productivity in project planning, documenting, project presentation, tracking the progress and reporting.
"Value stream mapping usually employs standard symbols to represent items and processes, therefore knowledge of these symbols is essential to correctly interpret the production system problems." [Value stream mapping. Wikipedia]
The vector stencils library Value stream mapping contains 43 symbols for drawing the value stream mapping diagrams using the ConceptDraw PRO diagramming and vector drawing software.
The example "Design elements - Value stream mapping diagram" is included in the Value Stream Mapping solution from the Quality area of ConceptDraw Solution Park.
VSM symbols
VSM symbols, workcell, truck shipment, logistics, timeline total, timeline, supermarket, signal Kanban, shipment, ship, shared process, sequenced pull ball, safety stock, pull, production control, production Kanban, process with data, process, data, plane, operator, material withdrawal Kanban, material pull, material flow, PUSH, manual info, load levelling, inventory, information flow, go see, forklift truck, electronic information flow, dedicated process, data box, customer, supplier, MRP, ERP, Kanban post, Kaizen burst, FIFO line,
The vector stencils library "Scrum people" contains 30 icons: scrum master, product owner, development team, etc.
Use this clipart set to design your agile software development diagrams and infographics with ConceptDraw PRO software.
"There are three core roles in the scrum framework. These core roles are those committed to the project in the scrum process — they are the ones producing the product (objective of the project). They represent the scrum team. ...
Product owner
The product owner represents the stakeholders and is the voice of the customer, who is accountable for ensuring that the team delivers value to the business. The product owner writes (or has the team write) customer-centric items (typically user stories), ranks and prioritizes them, and adds them to the product backlog. ...
Development team
The development team is responsible for delivering potentially shippable increments (PSIs) of product at the end of each sprint (the sprint goal). A team is made up of 3–9 individuals who do the actual work (analyse, design, develop, test, technical communication, document, etc.). Development teams are cross-functional, with all of the skills as a team necessary to create a product increment. The development team in scrum is self-organizing...
Scrum master
Scrum is facilitated by a scrum master, who is accountable for removing impediments to the ability of the team to deliver the product goals and deliverables. The scrum master is not a traditional team lead or project manager, but acts as a buffer between the team and any distracting influences. The scrum master ensures that the scrum process is used as intended. The scrum master helps ensure the team follows the agreed scrum processes, often facilitates key sessions, and encourages the team to improve." [Scrum (software development). Wikipedia]
The clip art sample "Design elements - Scrum people" is included in the Scrum solution from the Project Management area of ConceptDraw Solution Park.
Icon set
Icon set, whole team, tester, team member, team lead, support staff, stakeholder, software architect, senior manager, scrum team, scrum master, scrum evangelist, remote team member, project manager, programmer, product owner, product manager, power user, operations staff, mobile phone, light bulb, gold owner, external system team, end user, domain expert, developers, designer, customer, cross-functional team, change control board, business analyst, bug, banknote bundle, auditor, architecture owner, arc arrow, QA, quality assurance,
This agile software development infographic example was inspired by Mike Cohn's post "The Ideal Agile Workspace" from the Mountain Goat Software blog.
"... a list of all the things that ... should be visible within the ideal agile workspace:
* Big Visible Charts. ... the sprint burndown chart, showing the number of hours remaining as of each day of the current sprint. ... big visible charts showing the number of passing customer acceptance tests, the pass/ fail status of tests by day, sprint and release burndown charts, number of new stories introduced to the product backlog per sprint ...
* Additional feedback devices. ... a lava lamp that is turned on whenever the automated build is broken. ... flashing red traffic lights to indicate exceptional conditions such as an issue on a production server. ... ambient orbs and Nabaztag rabbits, which are wireless programmable devices that can also be configured to change colors, speak messages, or wiggle their ears as a team desires.
* Everyone on your team. Each person on the team should ideally be able to see each other person on the team. ...
* The sprint backlog. ... The best way to do that is by displaying the sprint backlog on a wall, ideally in the form of a task board A task board is usually oriented in rows and columns with each row containing a particular user story and one index card or sticky note for each task involved in that story. Task cards are organized in columns, minimally including “To Do” “In Process,” and “Done.” ...
* The product backlog. ... tack the index cards with those upcoming user stories on a wall where all can see them. ...
* At least one big white board. ...
* Someplace quiet and private. ...
* Food and drink. ...
* A window." [mountaingoatsoftware.com/ blog/ the-ideal-agile-workspace].
The infographic sample "Scrum workspace" was created using the ConceptDraw PRO software extended with the Scrum solution from the Project Management area of ConceptDraw Solution Park.
Infographic
Infographic, window, white board, use case, task card, sticky note, task, sticky notes, sprint story tasks, sprint story, server tower case, recycle bin, printer, office table, office chair, lava lamp, laptop computer, notebook, egg timer, drawing shapes, cork board, computer monitor, coffee cup, ambient orb, BAU transition,
The vector stencils library "Scrum artifacts" contains 52 icons.
Use this clipart set to design your agile software development diagrams and infographics with ConceptDraw PRO software.
"Product backlog
The product backlog comprises an ordered list of requirements that a scrum team maintains for a product. It consists of features, bug fixes, non-functional requirements, etc.—whatever must be done to successfully deliver a viable product. The product owner orders the product backlog items (PBIs) based on considerations such as risk, business value, dependencies, and date needed. ...
Sprint backlog
The sprint backlog is the list of work the development team must address during the next sprint. The list is derived by the scrum team selecting product backlog items from the top of the product backlog until the development team feels it has enough work to fill the sprint. This is done by the development team asking "Can we also do this?" and adding product backlog items to the sprint backlog. The development team should keep in mind its past performance assessing its capacity for the new sprint, and use this as a guide line of how much "effort" they can complete.
The product backlog items may be broken down into tasks by the development team. Tasks on the sprint backlog are never assigned; rather, tasks are signed up for by the team members as needed according to the set priority and the development team member skills. This promotes self-organization of the development team, and developer buy-in. ...
Sprint burn-down chart
The sprint burndown chart is a public displayed chart showing remaining work in the sprint backlog. Updated every day, it gives a simple view of the sprint progress. ...
Release burn-down chart
The release burndown chart is the way for the team to track progress and provide visibility. The release burndown chart is updated at the end of each sprint by the scrum master. The horizontal axis of the release burndown chart shows the sprints; the vertical axis shows the amount of work remaining at the start of each sprint." [Scrum (software development). Wikipedia]
The clip art sample "Design elements - Scrum artifacts" is included in the Scrum solution from the Project Management area of ConceptDraw Solution Park.
Clipart set
Clipart set, velocity, user story, tracer bullet, team velocity chart, task, unstarted, task, ongoing, task, completed, task, story points, story card, sprint story tasks, sprint story, sprint review meeting, sprint retrospective meeting, sprint planning meeting, sprint goal, sprint burndown chart, sprint backlog list, SBL, sprint backlog, sprint, spike, software product, scrumbut, scrumban, scrum theme, scrum task board, scrum task, scrum story, scrum release, scrum poker, scrum of scrums, scrum meeting, scrum epic, scrum, sashimi, return on investment (ROI), release burndown chart, recycle bin, product backlog, project backlog, release backlog, product backlog list, PBL, product backlog item, PBI, planning game, pig, objective, non-functional requirement (NFR), impediment, functional requirement, feature, daily scrum meeting, chicken, abnormal termination, Potentially shippable increment, PSI, product increment, potentially releasable increment, Definition of Done, DoD,
The vector stencils library "Scrum workspace" contains 21 icons.
Use this clipart set to design your agile software development diagrams and infographics with ConceptDraw PRO software.
"... a list of all the things that ... should be visible within the ideal agile workspace:
Big Visible Charts. ... the sprint burndown chart, showing the number of hours remaining as of each day of the current sprint. ... big visible charts showing the number of passing customer acceptance tests, the pass/ fail status of tests by day, sprint and release burndown charts, number of new stories introduced to the product backlog per sprint, and more.
Additional feedback devices. In addition to big, visible charts, it is common for an agile team to use additional visual feedback devices in their workspace. One of the most common is a lava lamp that is turned on whenever the automated build is broken.
... flashing red traffic lights to indicate exceptional conditions such as an issue on a production server. Also popular are ambient orbs and Nabaztag rabbits, which are wireless programmable devices that can also be configured to change colors, speak messages, or wiggle their ears as a team desires. ...
Everyone on your team. Each person on the team should ideally be able to see each other person on the team. This absolutely includes the ScrumMaster and ideally includes the product owner. ...
The sprint backlog. One of the best ways to ensure that everything necessary is completed in the sprint is to make the sprint backlog visible. The best way to do that is by displaying the sprint backlog on a wall, ideally in the form of a task board ...
The product backlog. One problem with running an endless series of sprints is that each can feel disconnected or isolated from the whole of a planned released or related set of new capabilities. A good way to reduce the impact of this problem is by displaying the product backlog somewhere clearly visible. ... tack the index cards with those upcoming user stories on a wall where all can see them. This allows team members to see how the user stories they are working on in the current sprint relate to others that are coming soon.
At least one big white board. ... Locating this in the team’s common workspace encourages spontaneous meetings." [mountaingoatsoftware.com/ blog/ the-ideal-agile-workspace]
The clip art sample "Design elements - Scrum workspace" is included in the Scrum solution from the Project Management area of ConceptDraw Solution Park.
Icon set
Icon set, window, white board, under-desk refrigerator, sticky notes, servers, server rack mount, server tower case, red traffic lights, push pins, printer, office table, office chair, nabaztag rabbit, lava lamp, laptop computer, notebook, egg timer, desktop computer, cork board, computer monitor, coffee machine, ambient orb,
This infographic sample shows digital audio devices for record, store and play of sound and music.
"Digital audio is technology that can be used to record, store, generate, manipulate, and reproduce sound using audio signals that have been encoded in digital form. Following significant advances in digital audio technology during the 1970s, it gradually replaced analog audio technology in many areas of sound production, sound recording (tape systems were replaced with digital recording systems), sound engineering and telecommunications in the 1990s and 2000s." [Digital audio. Wikipedia]
The infographic example "Digital audio" was created using the ConceptDraw PRO diagramming and vector drawing software extended with the Audio, Video, Media solution from the Illustrations area of ConceptDraw Solution Park.
Infographic
Infographic, usb drive, title text block, text column, side panel, tablet, sound, volume, sound frequency bars, music system, music album, mobile music, midi, microphone, mic, memory card, loudspeaker, iPod, mp4 player, iOS music player, iPod touch, iPod shuffle, iPhone, home theatre, headset, headphones, hard drive, earphones, digital phone, desktop phone, computer monitor, compact disk, cd, cloud storage, cd drive, cd box, audio file,