 Cross-Functional Flowcharts
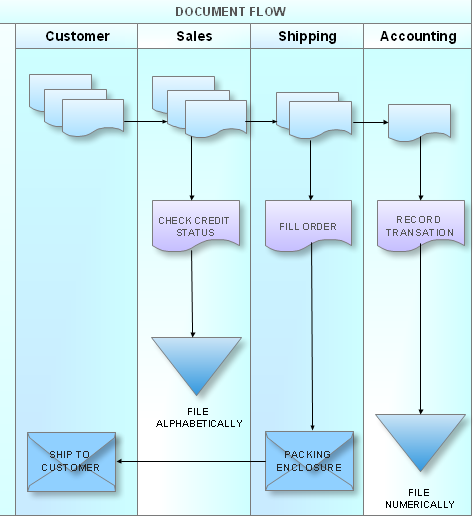
Cross-functional flowcharts are powerful and useful tool for visualizing and analyzing complex business processes which requires involvement of multiple people, teams or even departments. They let clearly represent a sequence of the process steps, the order of operations, relationships between processes and responsible functional units (such as departments or positions).
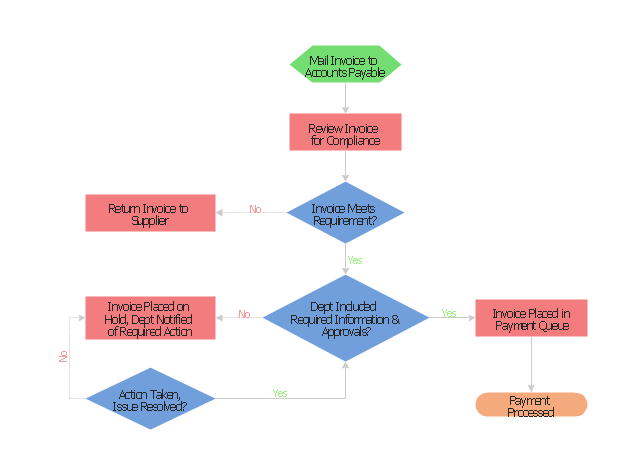
"An invoice, bill or tab is a commercial document issued by a seller to a buyer, relating to a sale transaction and indicating the products, quantities, and agreed prices for products or services the seller has provided the buyer.
Payment terms are usually stated on the invoice. These may specify that the buyer has a maximum number of days in which to pay, and is sometimes offered a discount if paid before the due date. The buyer could have already paid for the products or services listed on the invoice.
In the rental industry, an invoice must include a specific reference to the duration of the time being billed, so in addition to quantity, price and discount the invoicing amount is also based on duration. Generally each line of a rental invoice will refer to the actual hours, days, weeks, months, etc., being billed.
From the point of view of a seller, an invoice is a sales invoice. From the point of view of a buyer, an invoice is a purchase invoice. The document indicates the buyer and seller, but the term invoice indicates money is owed or owing. ...
Payment of invoices.
Organizations purchasing goods and services usually have a process in place for approving payment of invoices based on an employee's confirmation that the goods or services have been received.
Typically, when paying an invoice, a remittance advice will be sent to the supplier to inform them their invoice has been paid." [Invoice. Wikipedia]
The flow chart example "Invoice payment process" was created using the ConceptDraw PRO diagramming and vector drawing software extended with the Flowcharts solution from the area "What is a Diagram" of ConceptDraw Solution Park.
HelpDesk
How to Create a Cross - Functional Flowchart Using ConceptDraw PRO
Cross-functional flowcharts are used to visualize cross-functional processes. Cross-functional process is a process that involves multiple divisions, each of which makes its part of the entire company workflow. For example: product development, lead management , client orders processing – and other critical processes. All of them are important both for business and customers, but the workflow and responsibilities distribution within these processes are divided between multiple departments and services. Cross-functional processes cannot be depicted with simple workflow diagrams, because of the specific interactions between company departments. ConceptDraw PRO has released the specialized solution to create cross-functional diagrams. Cross Functional Flowcharts solution includes a special set of templates and libraries to depict the cross-functional processes.
HelpDesk
How to Create a VSM Diagram Using ConceptDraw Value Stream Mapping Solution
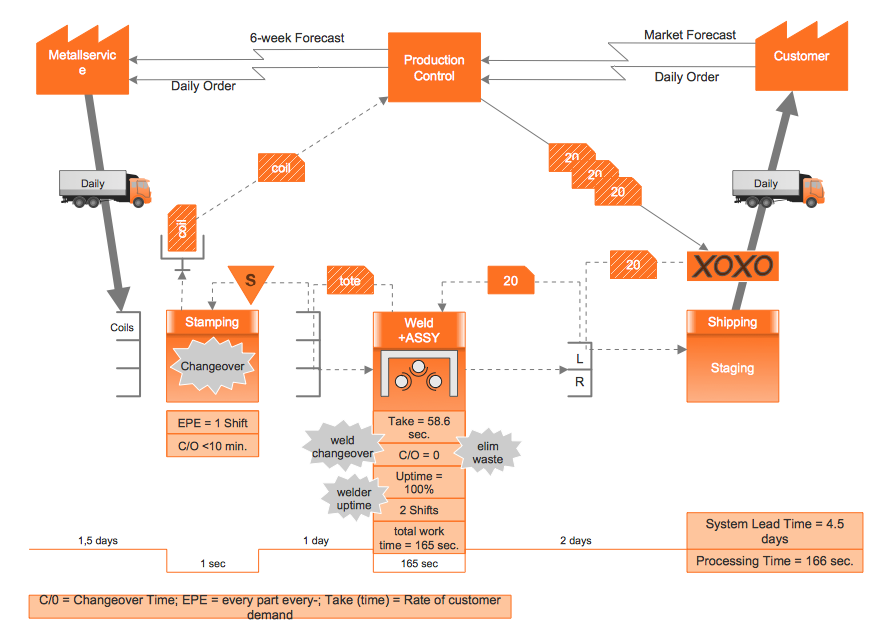
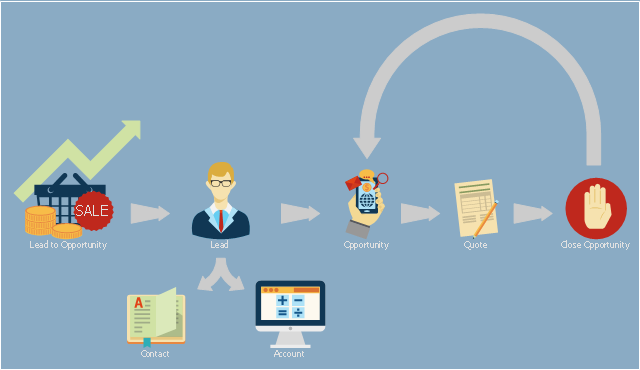
Value Stream Mapping is a Lean Manufacturing tool that uses a flow diagram to document in great detail every step of a manufacturing process. This graphical representation of a process is a powerful tool that helps in the diagnosis of process efficiency and allows companies to develop improved processes. Many lean practitioners use Value Stream Mapping as a fundamental tool to identify waste, cut process cycle times, and implement process improvement. Many organizations use value stream mapping as a key portion of their lean efforts. Value Stream Maps are used to analyze and design the flow of materials and information required to bring a product or service to a consumer. You can create a Value Stream Mapping flowchart using ConceptDraw PRO tools.This presales process flowchart example depicts the Microsoft Dynamics CRM workflow from lead to opportunity. It was redesigned from the Wikimedia Commons file: Lead to Opportunity sales flow.svg. [commons.wikimedia.org/ wiki/ File:Lead_ to_ Opportunity_ sales_ flow.svg]
"Presales is a process or a set of activities normally carried out before a customer is acquired, though sometimes presales also extends into the period the product or service is delivered to the customer. ...
In a typical sales cycle the stages are:
(1) Contact.
(2) Lead / Suspect.
(3) Prospect / Opportunity.
The task of a presales person starts from the initial contact phase and often ends once the customer is acquired i.e. sale is made." [Presales. Wikipedia]
The process flowchart example "Lead to opportunity sales flow" was created using the ConceptDraw PRO diagramming and vector drawing software extended with the Sales Flowcharts solution from the Marketing area of ConceptDraw Solution Park.
- Product life cycle process - Flowchart | Draw Flowcharts with ...
- Flowchart of Products . Flowchart Examples | Gantt chart examples ...
- Sales Process Flowchart . Flowchart Examples | Sales Process Steps ...
- Simple Flow Chart | Creating a Simple Flowchart | Flowchart ...
- Service -goods continuum diagram | Pyramid Chart Examples ...
- Process Flowchart | Copying Service Process Flowchart . Flowchart ...
- Sales Process Flowchart . Flowchart Examples | Sales Process Steps ...
- Copying Service Process Flowchart . Flowchart Examples | Process ...
- Marketing Diagrams | Marketing | Marketing and Sales Organization ...
- New Product Development Process Flowchart Sample
- Invoice payment process - Flowchart | Accounting Flowchart ...
- Copying Service Process Flowchart . Flowchart Examples | Flow ...
- Process Flowchart | Example Process Flow Chart | Example Process ...
- Flowchart of Products . Flowchart Examples | Product life cycle ...
- A Flow Chart Of A Commercial Product Of Png
- Process Flowchart | Copying Service Process Flowchart . Flowchart ...
- Pie Chart Software | Marketing Analysis Diagram | Flowchart ...
- Work Order Process Flowchart . Business Process Mapping ...
- Pyramid Chart Examples | Marketing Diagrams | Service -goods ...
- Product Manufacturing Process Flow Chart


