Android User Interface
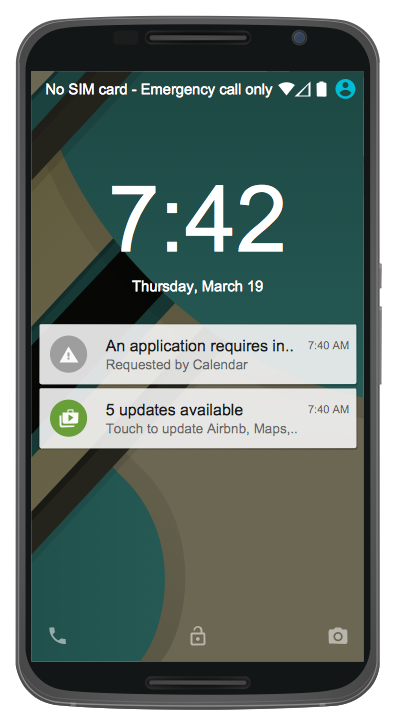
Android is a mobile operating system (OS) based on the Linux kernel and currently developed by Google. One of the most important features of any Android app is, of course, its Android User Interface. It is all what the user sees on the screen of its device and interacts with. Creating of successful Android User Interface and developing Android UI prototypes may be the mighty task. But we recommend you to make it fast and easy in ConceptDraw PRO specially extended with Android User Interface Solution from the Software Development Area.Android GUI
Android is an operating system based on the Linux kernel and developed by Google for smartphones, tablet computers, electronic books, netbooks, smartbooks, digital players, watches, game consoles, TV and other devices. ConceptDraw PRO extended with Android User Interface Solution from the Software Development Area is a powerful software with extensive drawing tools which can help you to build the intelligible, attractive and easy for perception Android GUI for your application.
 Windows 10 User Interface
Windows 10 User Interface solution extends significantly ConceptDraw PRO v11 functionality with look-and-feel functions of GUI software and makes it a great assistant for Win10 designers, developers, and software engineers. This solution provides a wide s
Organizational Charts with ConceptDraw PRO
Organizational chart or Orgchart is a diagram that depicts the structure of an organization using the terms of work responsibility and rank position. It is a useful and convenient format to visually illustrate the relationships within an organization, which is moreover applicable for organization of any size. Typically, an Organizational chart is constructed from the rectangular object blocks, which represent a job title, a person's name and relationships associated with them. You looks for the powerful Orgchart software? ConceptDraw PRO software is exactly what you've been searching long. Extended with Organizational Charts Solution, ConceptDraw PRO offers great-looking examples and samples of Orgcharts, built-in templates and various types of predesigned vector block objects and connectors for creation all kinds of Organizational Charts - from simple to complex multi-page. When designing the chart for large organization with complex branched structure, may be convenient to divide it into few smaller charts.How To Create Restaurant Floor Plan in Minutes
Developing Floor Plans, Design Drawings, Plans of Furniture Placement for restaurants and cafes is one of the most responsible and important steps at their construction and designing. Selection of favorable design, the right style of furniture and decors largely determine the success and atmosphere of the institution. The restaurant floor planner ConceptDraw PRO is a perfect choice for architects and designers. Enhanced with Cafe and Restaurant Floor Plans solution it offers a lot of extensive vector symbol libraries and building plan elements for drawing Restaurant floor plans, Restaurant layouts, Restaurant furniture layouts, Cafe floor plans, Bar area floor plan, Fast food restaurant plan, etc. With ConceptDraw PRO you don't need to be an artist to create great-looking restaurant floor plan drawings in minutes, all needed drawing tools are delivered by Building Plans area solutions. Construct your own general plan of restaurant's premises, choose the furniture for your taste from the Cafe and Restaurant Floor Plans solution libraries and arrange it on the plan as you desire fast and easy. ConceptDraw PRO has many of the features found in Visio for Mac such as Drawing, Connection, Shape and Editing Tools.
Working with Space
Generally, graphics are lines, points, polygons and text that are created and stored in the document. In this tutorial, you will learn how to work with space and content.Android UI Design
The Android operating system is one of the most popular platforms today. It was developed and now used on smartphones, tablets, netbooks, smartbooks, and many other electronic devices, and combines the reliability, flexibility and ease of use. So, millions of people face daily with Android operating system on their devices, and thus one of important things for the developers of Android applications is developing of convenient and attractive Android UI design. ConceptDraw PRO diagramming and vector drawing software extended with Android User Interface Solution from the Software Development Area will help you in this.The vector stencils library "Education pictograms" contains 128 education pictograms. Use this flat icon set to design your educational infogram in ConceptDraw PRO diagramming and vector drawing software.
The vector stencils library "Education pictograms" is included in the Education Infographics solution from the Business Infographics area of ConceptDraw Solution Park.
The vector stencils library "Education pictograms" is included in the Education Infographics solution from the Business Infographics area of ConceptDraw Solution Park.
Communication Tool for Remote Project Management
Communication is the main challenge and the key success factor for remote project management. Communicating visually via Skype you bring all team and customers onto the one page. Remote Presentation for Skype solution for ConceptDraw MINDMAP helps communicate with remote team and customers in visual manner on wide range of issues. Using this solution for regular status meetings allows you to push your team on tasks and keep task statuses up to date.- Android Tablet Flowchart App
- Top 5 Android Flow Chart Apps | Data Flow Diagrams (DFD ...
- Top 5 Android Flow Chart Apps | How to Design an Interface Mock ...
- ConceptDraw Solution Park | Business Processes Area | Basic ...
- Top 5 Android Flow Chart Apps | Data Flow Diagrams (DFD) | Army ...
- Android User Interface | How to Design an Interface Mock-up of an ...
- Top 5 Android Flow Chart Apps | Bio Flowchart | Army Flow Charts ...
- Linux Audit Flowchart Example. Flowchart Examples | Basic ...
- Design elements - Android system icons (navigation) | Flowchart ...
- Top 5 Android Flow Chart Apps | How to Design an Interface Mock ...
- Top 5 Android Flow Chart Apps | In searching of alternative to MS ...
- Data Flow Diagrams (DFD) | ConceptDraw Solution Park | Android ...
- Basic Flowchart Symbols and Meaning | Process Flowchart | Bio ...
- Top 5 Android Flow Chart Apps | Android UI Design Tool | Design ...
- Flowchart design. Flowchart symbols, shapes, stencils and icons ...
- Copying Service Process Flowchart . Flowchart Examples | How To ...
- Copying Service Process Flowchart . Flowchart Examples | How To ...
- Design elements - Android notifications | Top 5 Android Flow Chart ...
- Top 5 Android Flow Chart Apps | Bio Flowchart | How to Design an ...
- Top 5 Android Flow Chart Apps | Android UI Design Tool | Android ...


