Use a Fishbone Diagram to Attack Complex Problems

CORRECTIVE ACTIONS PLANNING. Involvement Matrix


TQM Diagram Example

Flowchart Definition

Quality issues in heir organization

Example Process Flow

Flowchart Design Flowchart Symbols, Shapes, Stencils and Icons


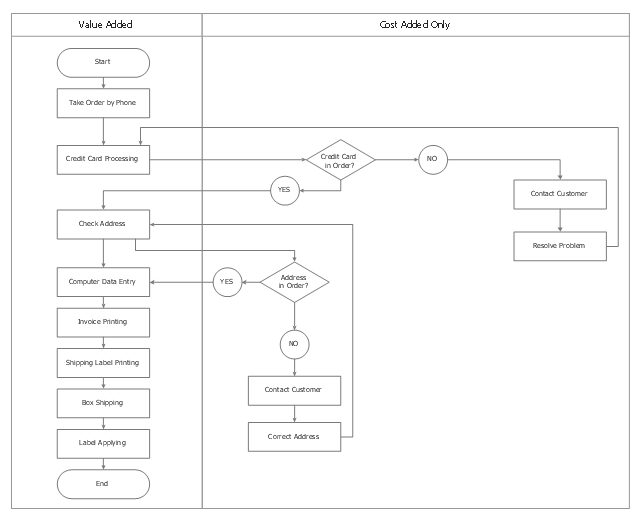
This cross-functional flowchart sample shows the order processing flow.
"Opportunity flowcharts are a variation of detailed basic flowcharts. They get their name because they highlight opportunities for improvement. Like all flowcharts, they make the process visible. But they take this idea one step further by separating value-added steps (those essential for making the product or service) from cost-added-only steps (those that are included only to check for or fix problems). ...
An opportunity flowchart is created by rearranging a detailed basic flowchart. The steps needed if everything works perfectly should flow down the left side of the chart. Steps that exist because of problems and inefficiencies flow across the right side." [Flowcharts: Plain & Simple. Inc Staff Joiner Assocs. 1995. P. 60.]
The swim lane diagram example "Process flowchart - Order processing" was created using the ConceptDraw PRO diagramming and vector drawing software extended with the Process Flowcharts solution from the Business Processes area of ConceptDraw Solution Park.
Swim lane diagram
Value-Stream Mapping for Manufacturing

Processing Flow Chart

ConceptDraw DIAGRAM enhanced with Flowcharts Solution from the "Diagrams" Area of ConceptDraw Solution Park is a powerful Processing Flow Chart software which will help save lots of your time.
The Action Plan

Flowchart

Software Flow Chart

8 Step Problem Solving

Preventive Action

Flow Chart Creator

TQM Diagram Tool

Technical Flow Chart

Flow Chart

Process Flow Chart

- Flowchart Problems And Solution
- Accounting Flowcharts | Flowchart Problems With Solution
- Accounting Flowcharts | Problems Of Flowchart And Solutions
- Accounting Flowcharts | Accounting Flowcharts | Problems In ...
- Accounting Flowcharts | Flowchart Problems For Beginners
- Accounting Flowcharts | Flowchart Solutions To Accounting Problems
- Containment and Cross-Functional Flowcharts | Flowchart Example ...
- Programming Flowchart Problems And Solutions
- Accounting Flowcharts | Solutions For Flowchart Problems
- Cross Functional Flowchart Examples | Flow Chart Problems And ...