This flowchart example was created on the base of land sales process diagram from the Property management webpage of the VicRoads website.
[www.vicroads.vic.gov.au/ planning-and-projects/ property-services/ property-management]
"VicRoads or the Roads Corporation of Victoria is a statutory corporation which is the state road and traffic authority in the state of Victoria, Australia. It is responsible for maintenance and construction of the state arterial road network, as well as driver licensing and vehicle registration. VicRoads has broad responsibility for road safety policy and research. It is also responsible for regulating the accident towing industry in Victoria." [VicRoads. Wikipedia]
"Sales Process.
Once it has been established with the relevant VicRoads Regions/ Projects and other business areas that properties are identified as surplus to VicRoads’ operational needs, they are incorporated in the VicRoads annual sales program.
Following approval: relevant VicRoads Regional Manager and the VicRoads Chief Executive (and in some circumstances Minster for Public Transport and Roads) must approve all land deemed surplus and available for disposal.
The method of sale is then determined and consultant advice is sought:
(1) Planning.
(2) Valuer General Victoria (Valuer General’s office must provide a valuation for all sales).
(3) Government Land Monitor (Land Monitor approval is sought if the value exceeds $750,000).
(4) Environmental.
(5) Local Council." [www.vicroads.vic.gov.au/ planning-and-projects/ property-services/ property-management]
The example "Land sales process flowchart" was created using the ConceptDraw PRO diagramming and vector drawing software extended with the Sales Flowcharts solution from the Marketing area of ConceptDraw Solution Park.
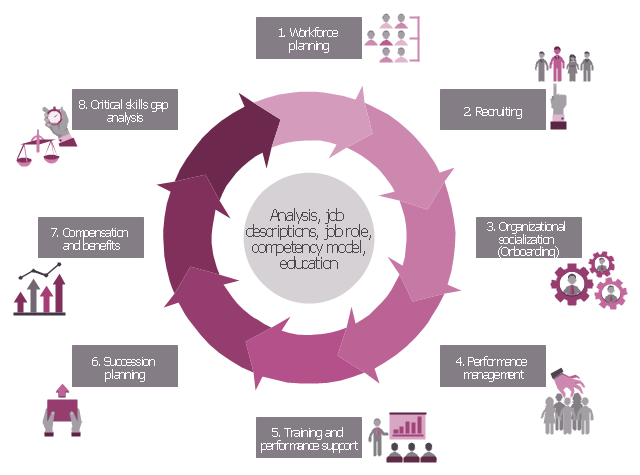
HR infographics "Talent management process" was redesigned from the Wikimedia Commons file: Model_ TM.jpg. [commons.wikimedia.org/ wiki/ File:Model_ TM.jpg]
"Talent management refers to the anticipation of required human capital for an organization and the planning to meet those needs. ...
Talent management is the science of using strategic human resource planning to improve business value and to make it possible for companies and organizations to reach their goals. Everything done to recruit, retain, develop, reward and make people perform forms a part of talent management as well as strategic workforce planning. A talent-management strategy needs to link to business strategy to make sense." [Talent management. Wikipedia]
The HR infographics example "Talent management process" was created using the ConceptDraw PRO diagramming and vector drawing software extended with the HR Flowcharts solution from the Management area of ConceptDraw Solution Park.
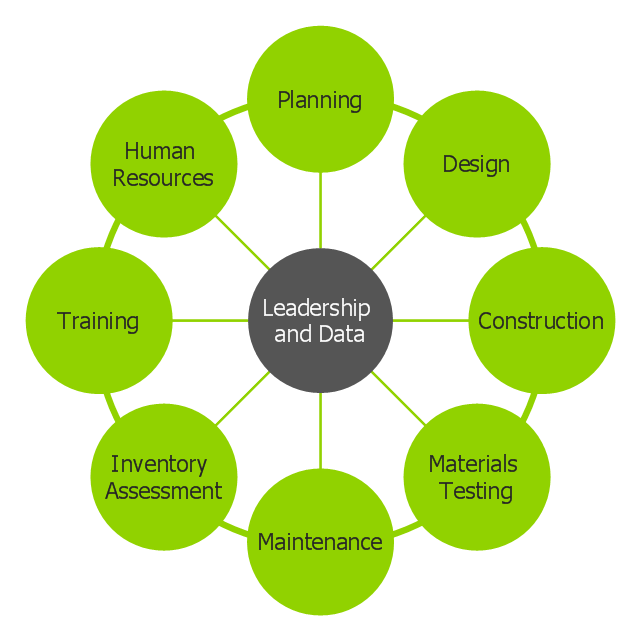
This circle-spoke diagram sample shows how leadership and data provide essential coordination of other functions in an asset management environment. Leadership points the way and common data systems keep all divisions communicating effectively.
This circle-spoke diagram example was created on the base of illustration of article "Beyond the Short Term: Transportation Asset Management for Long-Term Sustainability, Accountability and Performance" from the website of The Federal Highway Administration (FHWA).
[fhwa.dot.gov/ asset/ 10009/ tam_ topr806_ 3.cfm]
"Asset management, broadly defined, refers to any system that monitors and maintains things of value to an entity or group. It may apply to both tangible assets such as buildings and to intangible concepts such as intellectual property and goodwill. Asset management is a systematic process of operating, maintaining, upgrading, and disposing of assets cost-effectively. Alternative views of asset management in the engineering environment are: the practice of managing assets to achieve the greatest return (particularly useful for productive assets such as plant and equipment), and the process of monitoring and maintaining facilities systems, with the objective of providing the best possible service to users (appropriate for public infrastructure assets)." [Asset management. Wikipedia]
The hub-and-spoke diagram example "Leadership and data" was created using the ConceptDraw PRO diagramming and vector drawing software extended with the Circle-Spoke Diagrams solution from the area "What is a Diagram" of ConceptDraw Solution Park.
- Land sales process flowchart | Property Management Examples ...
- How To Create A Wikipedia Page Flow Chart
- Sales Process Flowchart . Flowchart Examples | Block diagram ...
- Social media activity of a real estate agent | Work Order Process ...
- Communication Gadgets Wikipedia
- Trading process diagram - Deployment flowchart | Target Diagram ...
- Block diagram - Gap model of service quality | Flow chart Example ...
- Invoice payment process - Flowchart | How to Purchase ...
- Process Flowchart | Process flowchart - QA processes in HSRU | HR ...
- Trading process diagram - Deployment flowchart | Settlement ...
- Land sales process flowchart | Accounting Flowcharts | Design ...
- Sales Process Flowchart Symbols | Euclidean algorithm - Flowchart ...
- Import process - Flowchart | Block diagram - Selling technology ...
- Order processing - EPC flow chart | Cross-Functional Flowcharts ...
- Elements Of Landscape Design Wikipedia
- Land sales process flowchart | Road signs - Vector stencils library ...
- Land sales process flowchart | Design elements - Rail transport ...
- Marketing - Vector stencils library | Land sales process flowchart ...
- Human Resource Planning Process Wikipedia


