Flowchart Software
Flowchart is a simple diagram, map or graphical schematic representation the sequence of actions within a process. It is ideal for displaying how a process currently flows or can function ideally. The Flowcharts let define the steps and boundaries of a process, uncover problems or miscommunications. The Flowcharts are widely used in education, software development, business, economics, thanks to their visuality they are ideal for presentations, reports, for using on conferences to help the audience comprehend the content better, or easy find flaws in a process flow diagrams. ConceptDraw PRO is professional flowcharts software and feature-rich flowchart maker, which supports Mac OS X and Windows. It contains at ConceptDraw Solution Park a rich set of stencils and professional flowchart symbols for design. It lets create simply professional-looking Flowcharts based on thousand free flowchart templates, colored symbols and examples. ConceptDraw PRO is a 3 times cheaper alternative to MS Visio available for both Mac and PC. It’s is another full featured business and technical diagramming application that can easily take care of Visio files within OS X. Another bonus with ConceptDraw PRO – it's cross-platform. You can work on a document in both OS X and Windows, skipping Visio entirely.
HelpDesk
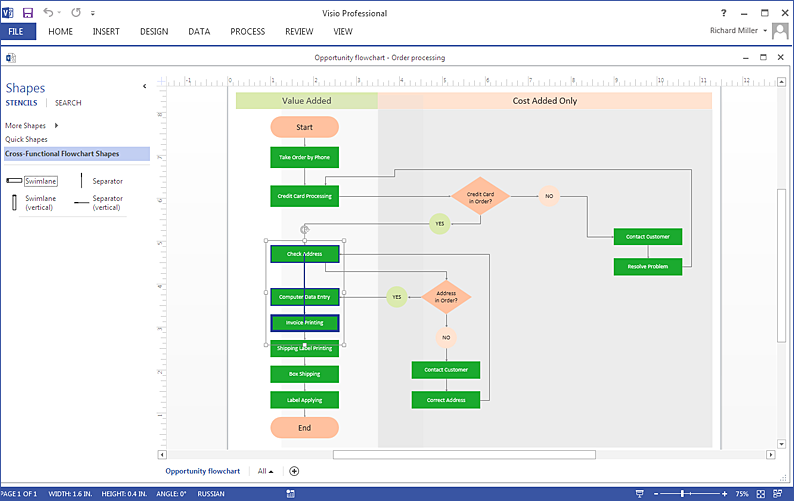
How To Create MS Visio Cross-Functional Flowchart
Cross-functional is a process involving several functional layers. Such processes typically cause the most problems, and therefore, is the most potential for improvement. Cross-functional business processes are usually illustrate the processes of product development, commercial proposal development, the order execution process - everything, that involves several departments. The package of possible improvements - is the task of re-engineering. To illustrate the cross-functional processes often use cross-functional flowchart is often used to illustrate the cross-functional processes. ConceptDraw PRO allows you to easily create cross-functional flowchart. Then, you can export it to MS Visio VSDX or VDX format and successfully share it with your colleagues still using MS Visio.HelpDesk
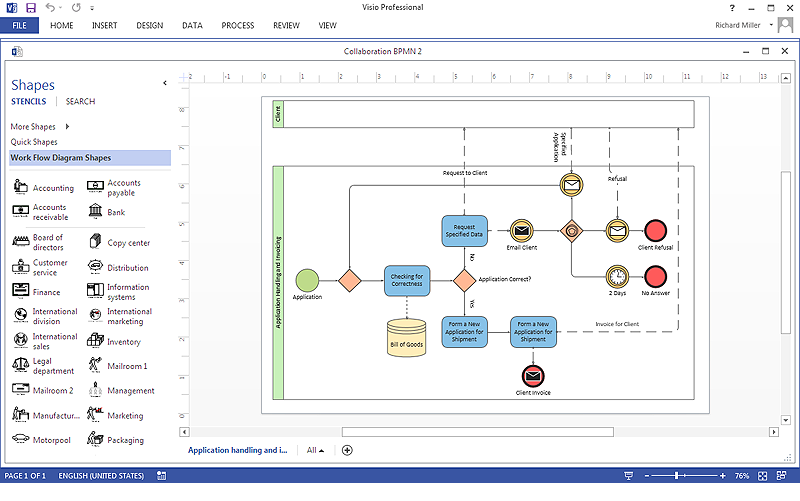
How To Create a MS Visio Business Process Diagram
Business process diagrams are specialized types of flowcharts based on the Business Process Model and Notation. The BPMN specification describes the symbols to display business processes in the form of business process diagrams. The main objective of BPMN is to create a standard set of symbols that are understandable to all business users, such as business analysts who create and improve processes, technical developers responsible for implementing processes and managers who take care processes and control them. Making a business process diagram involves many different elements that can be managed using ConceptDraw PRO. The ability to design Business process diagrams is delivered by the Business Process Diagrams solution. ConceptDraw PRO supports export of business process diagrams to MS Visio files. Thus, you can share your business documentation with MS Visio users.HelpDesk
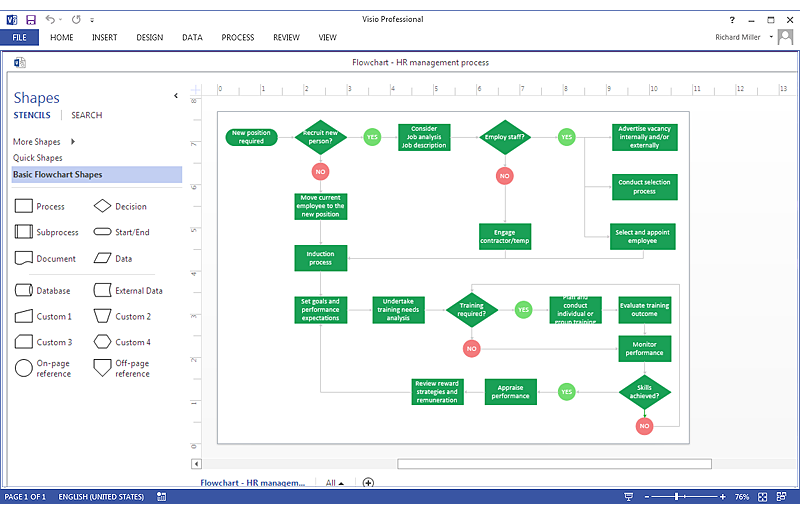
How To Create MS Visio Flowchart
Making a process or work flow step-by-step visualization helps you to better understand it and effectively communicate with your audience. Flowcharting is the best way to do this. Flowchart is a diagram that successively depicts all process steps. Basic flowchart is the most easy and understandable type of a flowchart. Using ConceptDraw PRO you can design flowcharts of any complexity on Windows or OS X . Then you can export them to Visio format to share with the users of MS Visio. Moreover, using ConceptDraw PRO you can open and edit a flowchart made in Visio, regardless of whether you are using OS X or Windows.HelpDesk
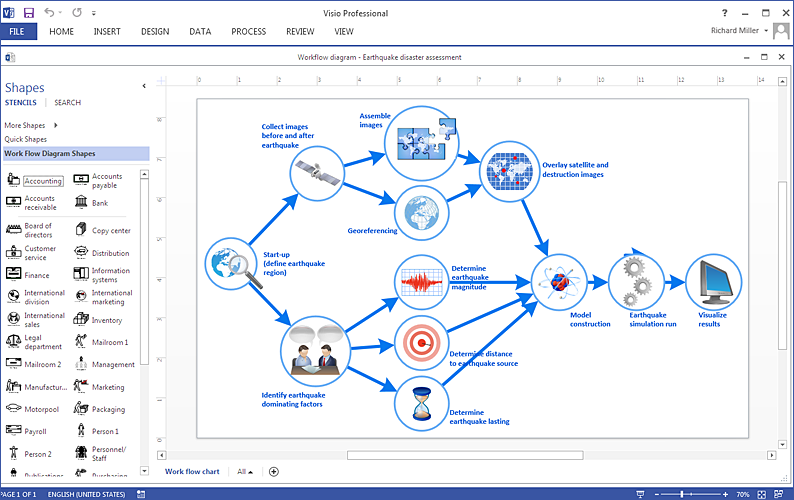
How To Create a MS Visio Workflow Diagram
A workflow diagram shows a working process as a set of related events that follow each other in a particular order.They are usually created as flowcharts, with shapes that represent steps in the process connected by arrows that indicate the next step. Making a business process diagram involves many elements that can be managed using ConceptDraw PRO. The ability to design workflow diagrams is delivered by the Workflow Diagrams solution. ConceptDraw PRO allows you to easily create workflow diagrams and then make a MS Visio file from your diagrams. Using ConceptDraw PRO, you can export your workflow diagrams to MS Visio VSDX and VDX files.HelpDesk
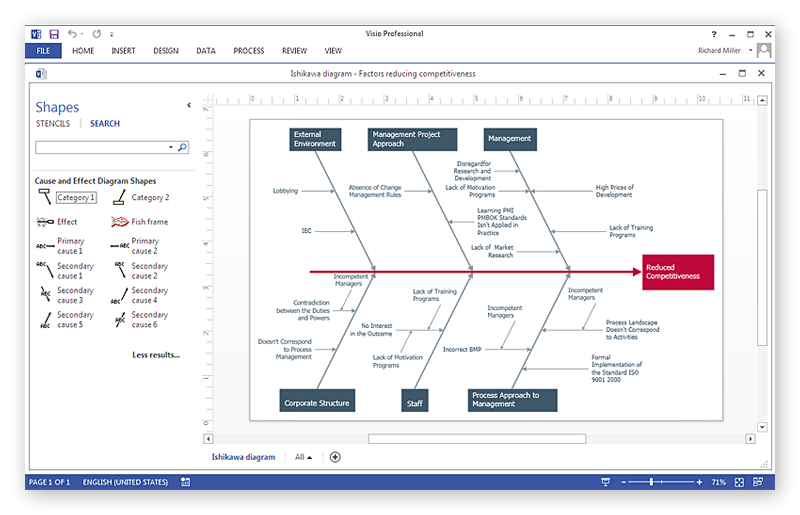
How To Create Cause and Effect (Fishbone) Diagram in MS Visio
Cause-and-Effect Ishikawa Diagram is a graphical method of analysis and cause-effect relationships, a tool in the form of fish bone. It is used to systematically determine the cause of the problem and represent it graphically. The technique is primarily used in the framework of quality management for the analysis of quality problems and their causes. Nowadays, it has found worldwide distribution and is used in multiple problem areas. It is one of the tools of lean manufacturing, which is used in group work to find the problems and their causes. ConceptDraw PRO allows you to easily create Fishbone (Ishikawa) diagram and then make a MS Visio VSDX, or VSD files from your diagrams in a couple clicks, using the export capabilities of ConcewptDraw PRO.HelpDesk
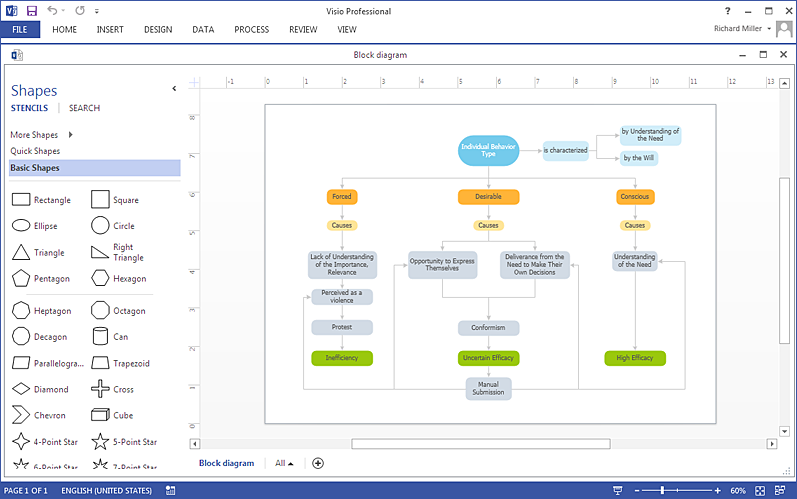
How To Create MS Visio Block Diagram
ConceptDraw PRO allows you to easily create block diagrams of any complexity and then make a MS Visio file from your diagram in a single click.HelpDesk
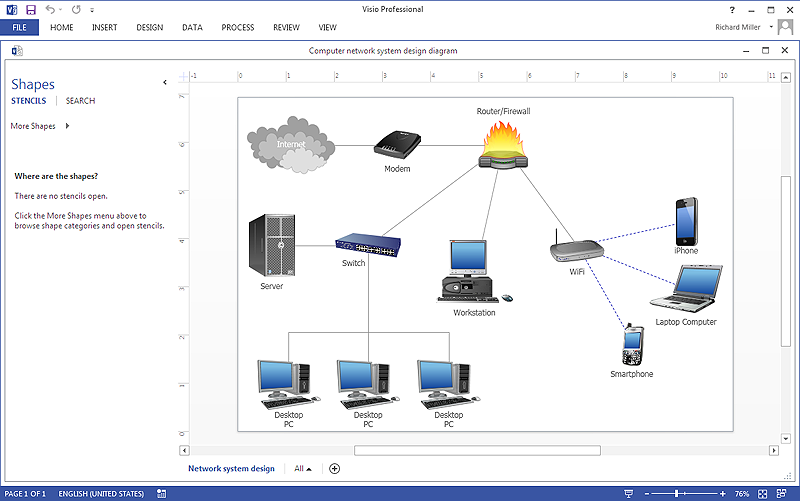
How To Create Visio Network Diagram
IT professionals are accustomed to use MS Visio for their network diagrams. Nevertheless, ConceptDraw PRO also power, and in some cases and more feature-rich product. Given the fact that many professional people committed to MS Visio, ConceptDraw PRO developers provided users with the opportunity to share their diagrams with MS Visio users. For this you can use the export to VSDX and VSD format. By exporting your network diagram to MS Visio, you can easily solve the issues in communication with the users of this widespread software product.HelpDesk
How To Create Visio Bubble Chart
ConceptDraw PRO allows you to easily create business charts and diagrams of any complexity, including the bubbles diagram and then make a MS Visio file from your diagram in a few simple steps.Basic Flowchart Symbols and Meaning
Flowcharts are the best for visually representation the business processes and the flow of a custom-order process through various departments within an organization. ConceptDraw PRO diagramming and vector drawing software extended with Flowcharts solution offers the full set of predesigned basic flowchart symbols which are gathered at two libraries: Flowchart and Flowcharts Rapid Draw. Among them are: process, terminator, decision, data, document, display, manual loop, and many other specific symbols. The meaning for each symbol offered by ConceptDraw gives the presentation about their proposed use in professional Flowcharts for business and technical processes, software algorithms, well-developed structures of web sites, Workflow diagrams, Process flow diagram and correlation in developing on-line instructional projects or business process system. Use of ready flow chart symbols in diagrams is incredibly useful - you need simply drag desired from the libraries to your document and arrange them in required order. There are a few serious alternatives to Visio for Mac, one of them is ConceptDraw PRO. It is one of the main contender with the most similar features and capabilities.
HelpDesk
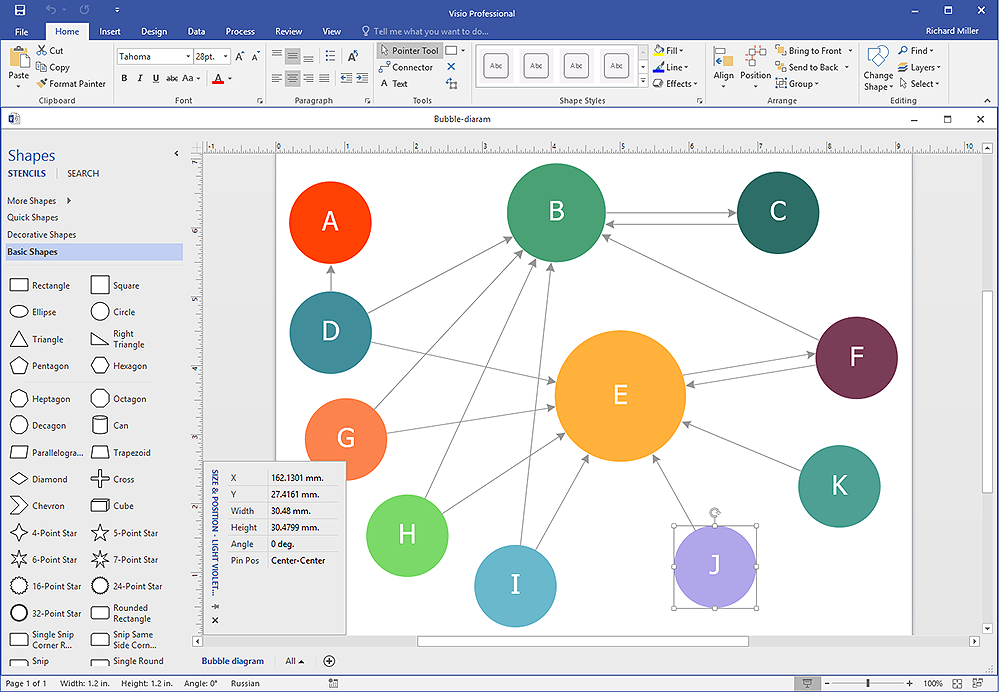
How To Make Visio Circle-Spoke Diagram
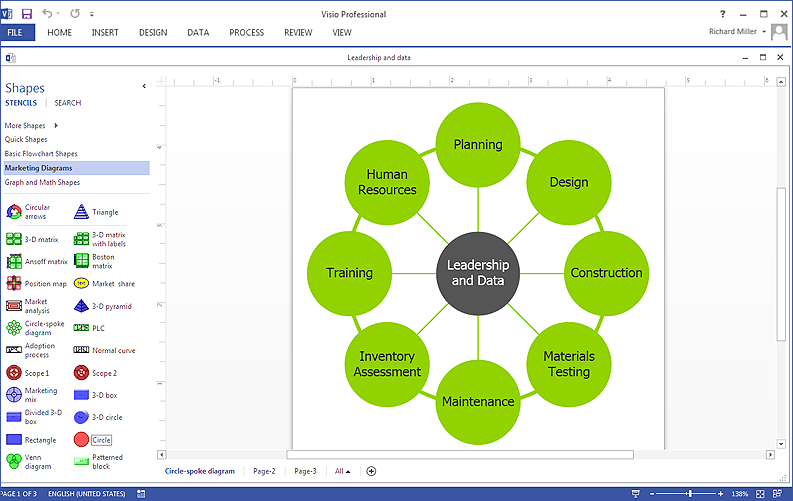
Circle Spoke Diagram consists from a central round balloon , wich is circled with other balloons as a ring . The Circle Spoke Diagram is usually used in marketing . It shows the relationships of entities and the central element. Circle Spoke Diagram can be used in marketing documentation and presentations. ConceptDraw PRO allows you to easily create marketing charts of any complexity, including the circle-spoke diagram and then make a MS Visio file from your diagram in a few simple steps. You can easily design your business documentation and share it easily with MS Visio users.Contoh Flowchart
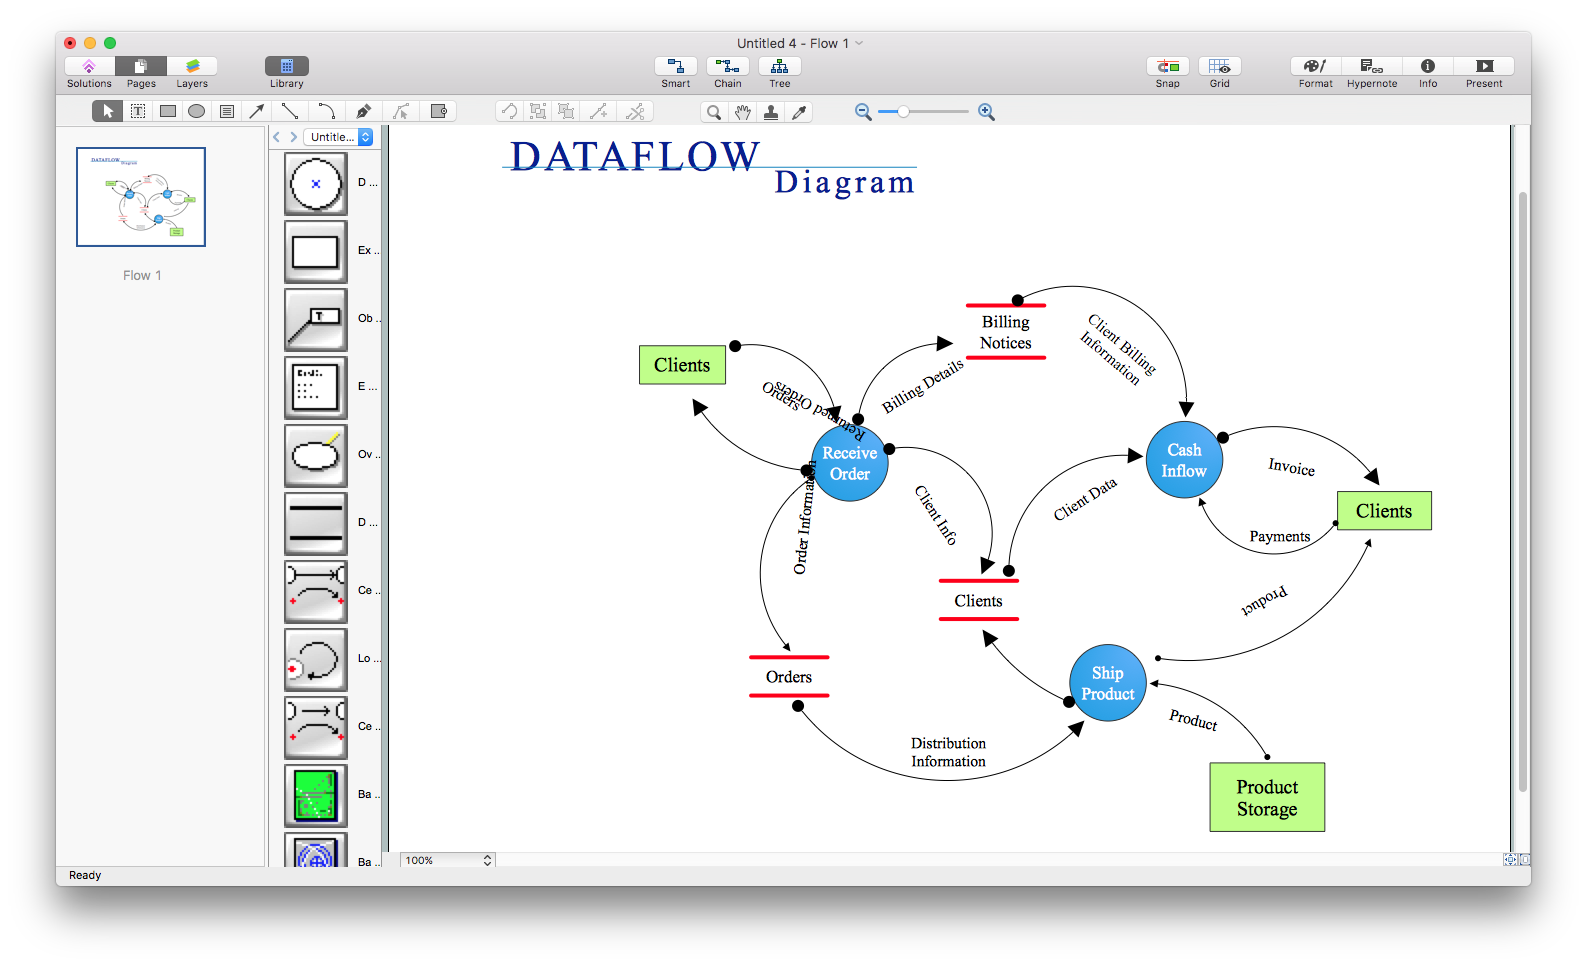
The Flowcharts are graphical representations of algorithms, processes or step-by-step solutions problems. There are many different types of Flowcharts, among them Process Flowchart, Cross Functional Flowchart, Data Flow Diagram, IDEF Flowchart, Workflow Diagram, Contoh Flowchart and many others. They have especial value when you need represent a complex process, depict in details the process of solution problems, efficiently plan and set the tasks priorities. The Flowcharts must to be constructed brief, clear and logical, simplifying the process or procedure, and making easier the comprehension and perception of information. The ConceptDraw PRO software makes the process of creating the flowcharts of any types well organized and clear for developers and customers also, including the Contoh Flowchart. It is possible due to the Flowcharts solution from ConceptDraw Solution Park, its predesigned vector objects, templates, and a lot of professional-looking practical samples and examples which can be quick and easy modified, printed, or published on web.HelpDesk
How To Create a MS Visio Telecommunication Network Diagram
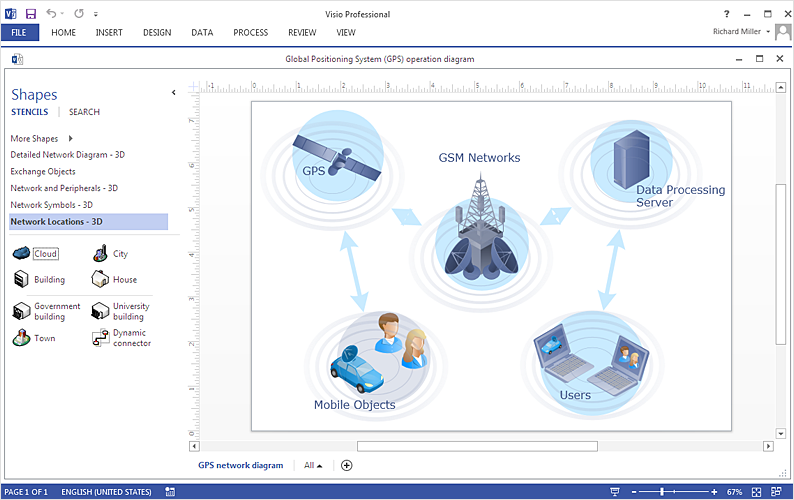
Telecommunication network consists from computers and telecommunication equipment, providing information exchange between network elements. The main purpose of telecommunication networks is to provide access to distributed resources. Making a telecommunication network diagram involves many specific elements of telecommunication technology that can be managed using ConceptDraw PRO. ConceptDraw PRO allows you to easily create telecommunication network diagram of any complexity and then export it to MS Visio VSDX and VDX file. Thus you can create a pack of telecommunication network documentation, that you will easily communicate with other specialists, who use MS Visio.HelpDesk
How to Convert MS Visio® 2003-2010 File to ConceptDraw PRO
ConceptDraw PRO v10 is such a viable alternative for individuals and organizations that are looking for a professional business solution. ConceptDraw PRO v10 file import and export works roundtrip with the Visio 2010-2013 file formats. With the introduction of Visio 2013 Microsoft has changed the native binary file format used in earlier versions of Microsoft Visio. ConceptDraw PRO v10 file import and export works with the new Visio VSDX file format and at the same time supports the improved import of VDX file format. To Import Visio vsd files to ConceptDraw follow the steps described in this article.- Cross Functional Flowchart Visio Examples
- Data Flow Diagrams | Process Flowchart | Visio Files and ...
- Swim Lane Diagrams | Cross-Functional Flowchart | Swim Lanes ...
- Life Cycle Diagram In Visio
- How To Create a MS Visio Business Process Diagram Using ...
- Process Flow Diagram Visio
- Visio Application Services Flow Chart
- MS Visio Look a Like Diagrams | Cross-Functional Flowchart ...
- UML Diagram Visio | MS Visio Look a Like Diagrams | UML ...
- Entity Relationship Diagram Symbols and Meaning ERD Symbols ...
- Flowchart Software | Process Flowchart | Basic Flowchart Symbols ...
- Visio Flowchart Software
- How To Create a Visio Circle-Spoke Diagram Using ConceptDraw ...
- Swim Lane Diagrams | Cross-Functional Flowchart | MS Visio Look ...
- How To Create a MS Visio Cross-Functional Flowchart Using ...
- Visio Diagram Showing Data Flow
- Flowchart Software | How to Convert Visio Custom Library to ...
- Visio Flowchart Example
- How To Create a MS Visio Telecommunication Network Diagram ...
- Sales Process Steps | Sales Flowcharts | Sales Process | Visio Sales ...

