This site uses cookies. By continuing to browse the ConceptDraw site you are agreeing to our Use of Site Cookies.
"A food bank or foodbank is a non-profit, charitable organization that distributes food to those who have difficulty purchasing enough food to avoid hunger.
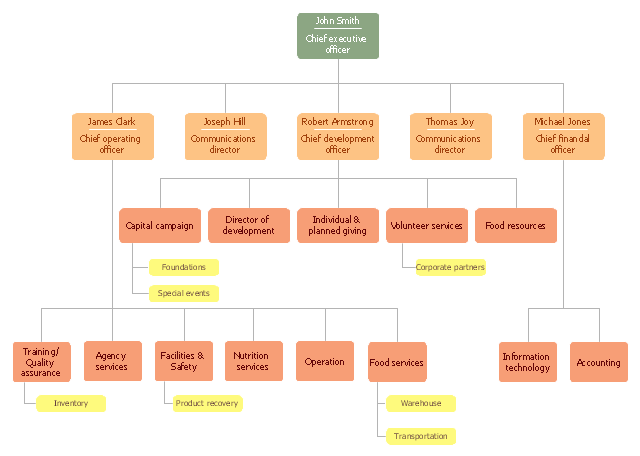
In the United States and Australia, food banks usually operate on the "warehouse" model. They act as food storage and distribution depots for smaller front line agencies; and usually do not themselves give out food directly to the hungry. After the food is collected, sorted, and reviewed for quality, these food banks distribute it to non-profit community or government agencies, including food pantries, food closets, soup kitchens, homeless shelters, orphanages, and schools.
Outside North America and Australia, the "front line" model is often found. Such food banks give out most or all of their food directly to the end users. For both models, the largest sources of food include for-profit growers, manufacturers, distributors and retailers who in the normal course of business have excess food that they cannot sell. Some foodbanks receive a substantial proportion of their food from individual donors, including their volunteer workers. There is considerable overlap with food salvage, food rescue and gleaning, although not with freeganism or dumpster-diving." [Food bank. Wikipedia]
The organization chart example "Foodbank" was created using the ConceptDraw PRO diagramming and vector drawing software extended with the Organizational Charts solution from the Management area of ConceptDraw Solution Park.
Organizational chart
Organizational chart, executive,

Organizational Chart

An organizational chart is a diagram that shows the structure of an organization and the relationships of its parts. ConceptDraw DIAGRAM extended with Organizational Charts Solution from the Management Area is powerful Organizational Chart Software.

Examples of Flowcharts, Org Charts and More

ConceptDraw DIAGRAM covers a broad spectrum of business graphics categories and offers at ConceptDraw STORE enormous online collection of pictorial examples and samples for different thematics and application areas. It is a plentiful source of inspiration and wonderful examples of professionally designed diagrams, flowcharts, UML diagrams, organizational charts, databases, ERDs, network diagrams, business charts, different thematic charts, schematics, infographics and plans developed specially for knowledge workers, engineers, managers, businessmen, marketing specialists, analytics, scientists, students, professors, journalists and also for a large number of other people that every day use various diagrams and drawings in their work and life activity. Each of these examples is a real art, all they are well thought-out and designed without efforts with help of powerful tools of ConceptDraw DIAGRAM software. ConceptDraw examples display all variety of tasks, possibilities and results that ConceptDraw Product Line lets achieve fast and easy. ConceptDraw is one of the best Visio alternatives for Mac. It open all Visio formats like.vsdx,.vss,.vdx files and allows you to export files to Visio formats.
What is ConceptDraw OFFICE

Organizational Structure Diagram Software

ConceptDraw DIAGRAM extended with Organizational Charts Solution from the Management Area is a powerful but easy-to-use Organizational Structure Diagram Software. Organizational Charts Solution provides a wide variety of templates and samples and large quantity of predesigned vector objects to help you design your Organizational Structure Diagrams and other business diagrams.
How to draw an Organizational Chart

Create Sophisticated Professional Diagrams - Simply

ConceptDraw DIAGRAM is a powerful software that helps you create professional and easy drawing diagrams for business, technology, science and education.

organizational chart, org chart Organizational Charts

organizational chart, org chart
Organizational Charts solution extends ConceptDraw DIAGRAM software with samples, templates and library of vector stencils for drawing the org charts.

Horizontal Orgchart

The Organizational Chart is a diagram that shows the structure of the organization and the relationships of its parts. There are many ways to present the Organizational Chart. One of them is the Horizontal Organizational Chart: the parts of the diagram are arranged from left to right, or from right to left. This sample was created in ConceptDraw DIAGRAM diagramming and vector drawing software using the Organizational Charts Solution from the Management area of ConceptDraw Solution Park.

Organizational Charts with ConceptDraw DIAGRAM

Organizational chart or Orgchart is a diagram that depicts the structure of an organization using the terms of work responsibility and rank position. It is a useful and convenient format to visually illustrate the relationships within an organization, which is moreover applicable for organization of any size. Typically, an Organizational chart is constructed from the rectangular object blocks, which represent a job title, a person's name and relationships associated with them. You looks for the powerful Orgchart software? ConceptDraw DIAGRAM software is exactly what you've been searching long. Extended with Organizational Charts Solution, ConceptDraw DIAGRAM offers great-looking examples and samples of Orgcharts, built-in templates and various types of predesigned vector block objects and connectors for creation all kinds of Organizational Charts - from simple to complex multi-page. When designing the chart for large organization with complex branched structure, may be convenient to divide it into few smaller charts.

Create Organizational Chart

ConceptDraw DIAGRAM software is greatly powerful in many fields due to the large collection of provided solutions by ConceptDraw Solution Park, among them the cost effective Organizational Chart design capabilities. Organizational Charts Solution from the Management Area of ConceptDraw Solution Park perfectly suits for analyzing the organizational structures, visualizing and designing Organizational Charts for the companies of any sizes, for creation the hotel organizational chart, hospital organizational chart, corporate organizational chart, different flow charts, time lines, and much more. Organizational Charts Solution makes ConceptDraw DIAGRAM the perfect analyzer tool for managers and administrative staff. It offers plenty of useful and convenient tools for ConceptDraw DIAGRAM users, including the set of Organizational chart templates that make the process of creation Organizational Charts on their base easier and quicker, extensive Organizational chart library of tasks-specific symbols and shapes, helpful Organizational chart examples and samples.

ConceptDraw DIAGRAM - Organizational chart software

Organizational Chart is a scheme which visualizes the composition of departments, sectors and other functional units of an organization, and also fixed relationships that exist between divisions and employees. ConceptDraw DIAGRAM enhanced with Organizational Charts solution is a powerful and cost effective Organizational chart software, which allows to automate the process of creation the high standard organizational charts, flow charts, time lines, and much more diagrams. It can be applied for analyzing organizational structure and drawing single or multi-page Organizational Charts with hyperlinks for the companies of any type, size and direction. Visualize the structure using the orgchartal tools, create easily as never before the Company Organizational Chart, Corporate Organizational Chart, Hospital Organizational Chart, University Organizational Chart, Hotel Organizational Chart, and then export, send by e-mail or publish it on Web in minutes, to communicate and discuss with colleagues or any other interested people.

Business diagrams & Org Charts with ConceptDraw DIAGRAM

The business diagrams are in great demand, they describe the business processes, business tasks and activities which are executed to achieve specific organizational and business goals, increase productivity, reduce costs and errors. They let research and better understand the business processes. ConceptDraw DIAGRAM is a powerful professional cross-platform business graphics and business flowcharting tool which contains hundreds of built-in collections of task-specific vector stencils and templates. They will help you to visualize and structure information, create various Business flowcharts, maps and diagrams with minimal efforts, and add them to your documents and presentations to make them successful. Among them are Data flow diagrams, Organization charts, Business process workflow diagrams, Audit flowcharts, Cause and Effect diagrams, IDEF business process diagrams, Cross-functional flowcharts, PERT charts, Timeline diagrams, Calendars, Marketing diagrams, Pyramids, Target diagrams, Venn diagrams, Comparison charts, Analysis charts, Dashboards, and many more. Being a cross-platform application, ConceptDraw DIAGRAM is very secure, handy, free of bloatware and one of the best alternatives to Visio for Mac users.
Draw Business Process Diagrams

Organigrams with ConceptDraw DIAGRAM

ConceptDraw - Organigram software allows quickly create Organigrams and much more. ConceptDraw DIAGRAM is an ideal tool for Administrative staff to clearly demonstrate the company orgchart professional.
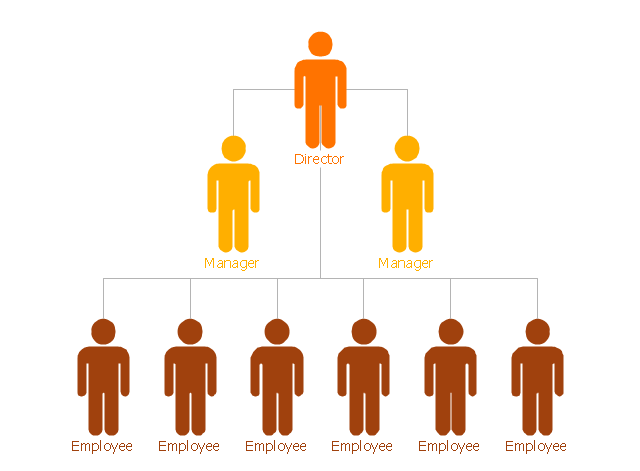
"In technology, agile development involves teams self-managing to a large extent (though agile development is commonly still practised within a hierarchical organization, which means that certain types of decisions such as hiring, firing, and pay rises remain the prerogative of managers). In scrum, an agile methodology, team members assign work to be done among themselves, either by free choice or by consensus. The scrum master role in scrum is not a management role as such, but is a role that involves helping to remove obstacles to forward progress, and ensuring that the basic scrum framework is adhered to by all parties, inside and outside the team - both aspects of the role being more akin to facilitation than to top-down micromanagement. Agile methodologies such as scrum have also begun being used in non-technology companies and organizations." [Flat organization. Wikipedia]
This flat org chart template for the ConceptDraw PRO diagramming and vector drawing software is included in the 25 Typical Organizational Charts solution from the Management area of ConceptDraw Solution Park.
Flat org chart template
Flat org chart template, president, manager, employee,

Six Markets Model Chart

This sample shows the Six Markets Model Chart. It was created in ConceptDraw DIAGRAM diagramming and vector drawing software using the Marketing Diagrams Solution from the Marketing area of ConceptDraw Solution Park. The six markets model defines six markets that take the central place in the relationship marketing: internal markets, supplier markets, recruitment markets, referral markets, influence markets and customer markets. The six markets model allows the organization to analyze the stakeholders and key market domains that can be important to it. This model used in marketing project management software for small business project management.

SWOT Template

The SWOT and TOWS Matrix Diagrams solution from the ConceptDraw Solution Park gives a simple visual support for all steps of a SWOT analysis process, which is a popular strategic planning method used to evaluate the Strengths, Weaknesses, as well as Opportunities and Threats facing a project. Strengths are the project's characteristics giving it the advantages over the others, weaknesses are the characteristics placing the team at the disadvantage relatively to others, opportunities are the elements that the project can exploit to its advantage and threats are the elements that can cause the troubles. The results of a correctly performed SWOT analysis help to achieve effectively the main objective. The SWOT templates included to SWOT and TOWS Matrix Diagrams solution for ConceptDraw DIAGRAM isually support the identifying of internal and external factors that are favorable or unfavorable. Making the SWOT analysis and completing the SWOT Matrix by simple filling a SWOT template, you can then export it to large variety of available formats: PowerPoint presentation, PDF, image files, and others.

Stakeholder Management System

Stakeholder management is a critical component to the successful delivery of any project, programme or activity. ConceptDraw DIAGRAM is a powerful diagramming and vector drawing software. Now, thanks to the Stakeholder Onion Diagrams Solution included to the Management Area of ConceptDraw Solution Park, ConceptDraw DIAGRAM became also unique stakeholder management system design software.

Create a Presentation Using a Design Template

The intuitive interface of ConceptDraw MINDMAP and the Functional Tools overview below will guide you in creating and demonstrating powerful mind map presentations using template. An advanced tool allows you effectively generate, change, and update your presentation.
This HR dashboard sample visualizes KPIs: full time employee (FTE) number, total revenue, average revenue per FTE, total employment cost, average cost per FTE.
"Employment is a relationship between two parties, usually based on a contract where work is paid for, where one party, which may be a corporation, for profit, not-for-profit organization, co-operative or other entity is the employer and the other is the employee. Employees work in return for payment, which may be in the form of an hourly wage, by piecework or an annual salary, depending on the type of work an employee does or which sector she or he is working in. Employees in some fields or sectors may receive gratuities, bonus payment or stock options. In some types of employment, employees may receive benefits in addition to payment. Benefits can include health insurance, housing, disability insurance or use of a gym." [Employment. Wikipedia]
The human resources dashboard example "Revenue and Employment Cost Dashboard" was designed using ConceptDraw PRO software extended with HR Dashboard solution from Management area of ConceptDraw Solution Park.
HR dashboard
HR dashboard, сapital formation, vertical bar chart, column chart, personal data, badge icon, job pricing, human resources, compensation management, checkbox,

Symboles Organigramme

Les organigrammes sont parfaits pour représenter visuellement des processus operationnels. Par exemple, si vous avez besoin d'afficher le flux d'un processus d'ordre personnalisé par l'entremise de divers opérateurs au sein de votre organisation, vous pouvez utiliser un organigramme. Voir aussi d'autres symboles organigramme: Symboles ordinogramme standard, symboles du flux de travail, Vérification Les symboles du schéma fonctionnel, sOrganigramme comptables des symboles, Organigramme de vente des symboles, Symboles pour organigramme des RH, Carte des symboles de processus, Diagramme de processus opérationnels, Symboles utilisés dans le schéma IDEF0.

Conception d'organigramme Organigramme des symboles, formes, stencils et icônes

Mavericks a toujours voulu se démarquer, notamment grâce à des choix de design épurés. Les présentations et documents graphiques professionnels sont plus compréhensibles et clairs s'ils utilisent des thématiques de couleurs distinctes pour leurs différentes composantes. La présentation par organigramme rend les démonstrations et les explications de processus opérationnels plus flexibles, et offre un aperçu d'un nouveau genre, se démarquant des organigrammes noir et blanc classiques sur papier. Les meilleures présentations peuvent être obtenues en utilisant les modèles « Conceptdraw » adéquats comme base de départ. Choisissez simplement l'un d'eux et entrez le texte souhaité dans chaque forme du diagramme. Appliquez moins de couleurs dans le document afin de ne pas le transformer en arc-en-ciel, trois ou quatre sera suffiront, notez également que la modélisation des processus opérationnels ne doivent pas contenir des nuances trop claires. Il est aussi