How To Use Collaboration Tool in Project Management
Collaboration tool for project management enables you to give a new role to knowledge management and document sharing within your team.
How To Implement Collaborative Project Management
Collaborative Project Management via Skype is an ideal tool for project teams who need to master a growing project complexity.
Communication Tool for Remote Project Management
Communication is the main challenge and the key success factor for remote project management. Communicating visually via Skype you bring all team and customers onto the one page. Remote Presentation for Skype solution for ConceptDraw MINDMAP helps communicate with remote team and customers in visual manner on wide range of issues. Using this solution for regular status meetings allows you to push your team on tasks and keep task statuses up to date.Software Work Flow Process in Project Management with Diagram
This sample was created in ConceptDraw DIAGRAM diagramming and vector drawing software using the Workflow Diagrams Solution from the Software Development area of ConceptDraw Solution Park.This sample shows the Workflow Diagram that clearly illustrates stages a BPM consists of and relations between all parts of business. The Workflow Diagrams are used to represent the transferring of data during the work process, to study and analysis the working processes, and to optimize a workflow.
ConceptDraw PROJECT Project Management Software Tool
ConceptDraw PROJECT is simple project management software. If you are on the fast track in your career and start facing such challenges as coordination many people, coordination tasks and works, manage project with a great deal of time and money involved - it is the right time to get Project management tool involved in your work.Quality Project Management with Mind Maps
The visual form of mind maps is helpful in all stages of quality management, from describing problem to describing and documenting a decision.Pyramid Diagram
The Project Management Triangle Diagram depicts three main constraints of any project: scope, time and cost. Projects have to comply with the specified scope, projects should be finished in time and projects need to consume the budget. Each of the constraints represents one side of the triangle, and any change in budget or timing or scope affects the entire diagram. This diagram was made using ConceptDraw Office suite including best marketing project management software extended with collection of tools for creative project management software and project management reporting software symbols.ConceptDraw PROJECT Software Overview
ConceptDraw PROJECT is an effective tool for new and experienced users with a fine balance of usability and powerful functionality.Sample Project Flowchart. Flowchart Examples
This sample shows the Flowchart that displays the architecture of SQL Exception Translation. This sample was created in ConceptDraw DIAGRAM diagramming and vector drawing software using the Flowcharts solution from the Diagrams area of ConceptDraw Solution Park.
Gantt chart examples
All Gantt charts were made using ConceptDraw PROJECT. ConceptDraw PROJECT works both on Windows and Mac OS X. It allows to schedule a voluntary number of projects in a single Workspace document and lets easily share tasks and resources among them. ConceptDraw PROJECT shares files among Windows and Mac OS X.How To Hold Project Collaboration via Skype
Project Management Trends. Status report presentation tool for remote teams, using Skype to collaborate on project objectives.
Marketing Research Project
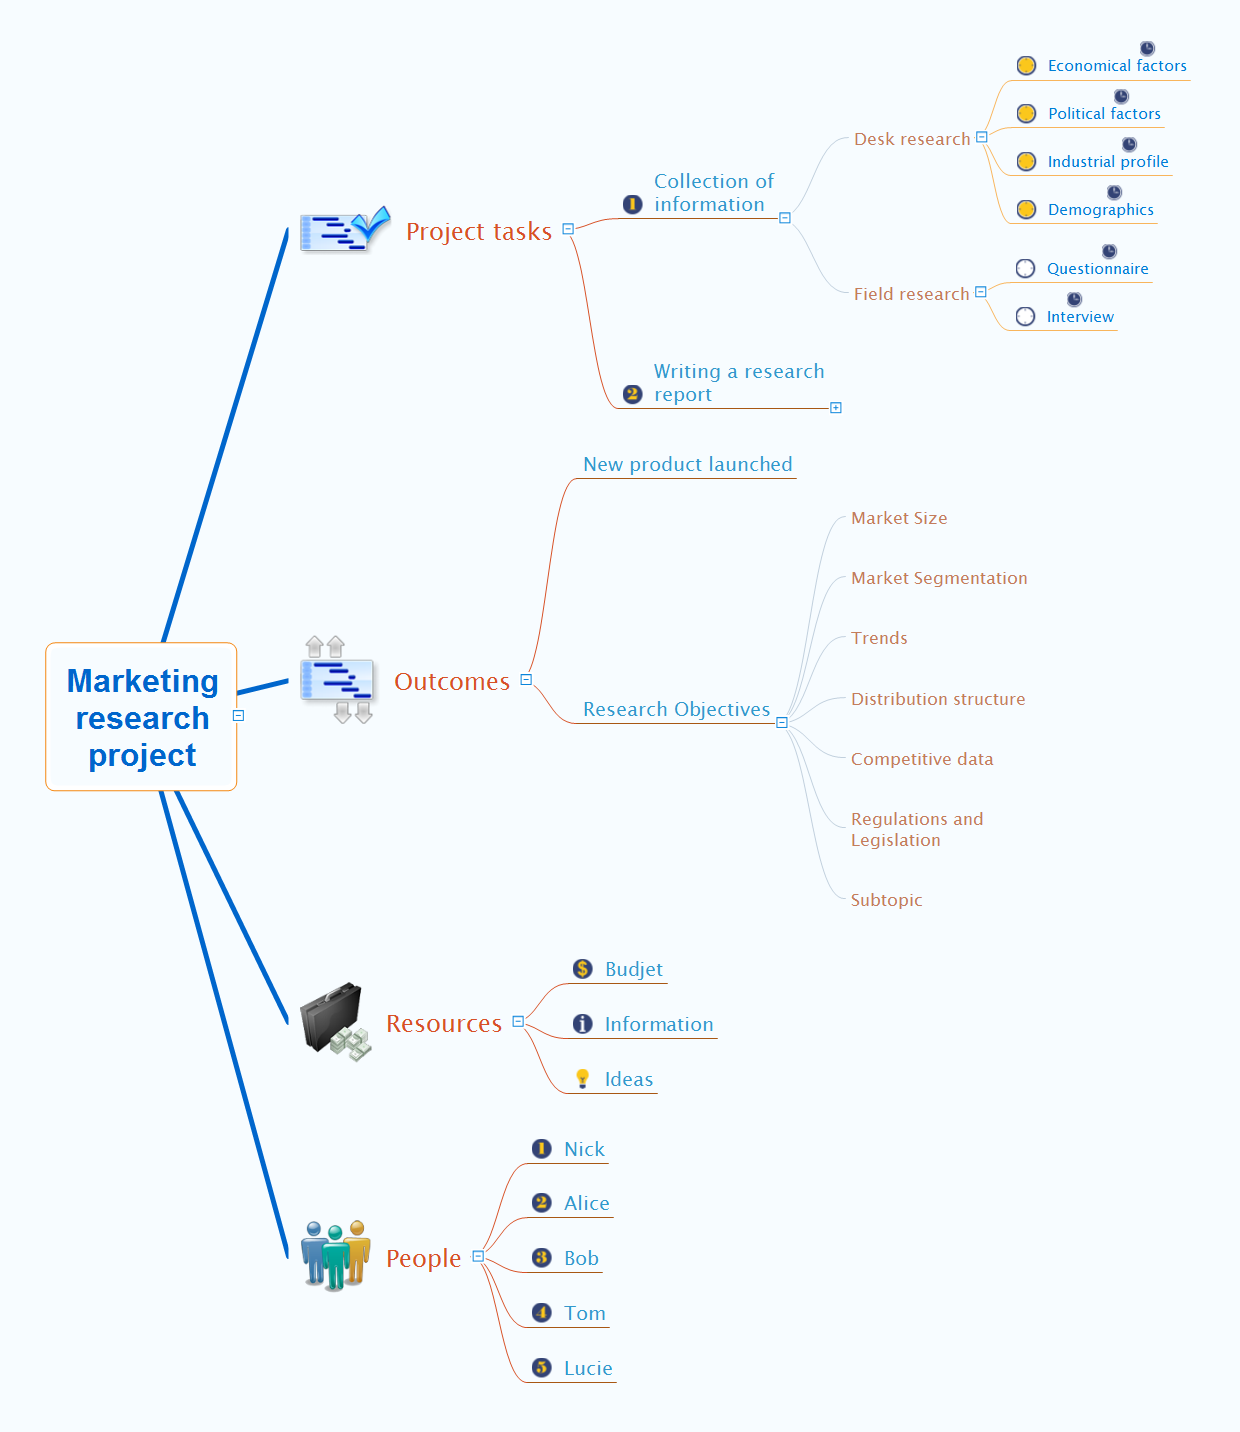
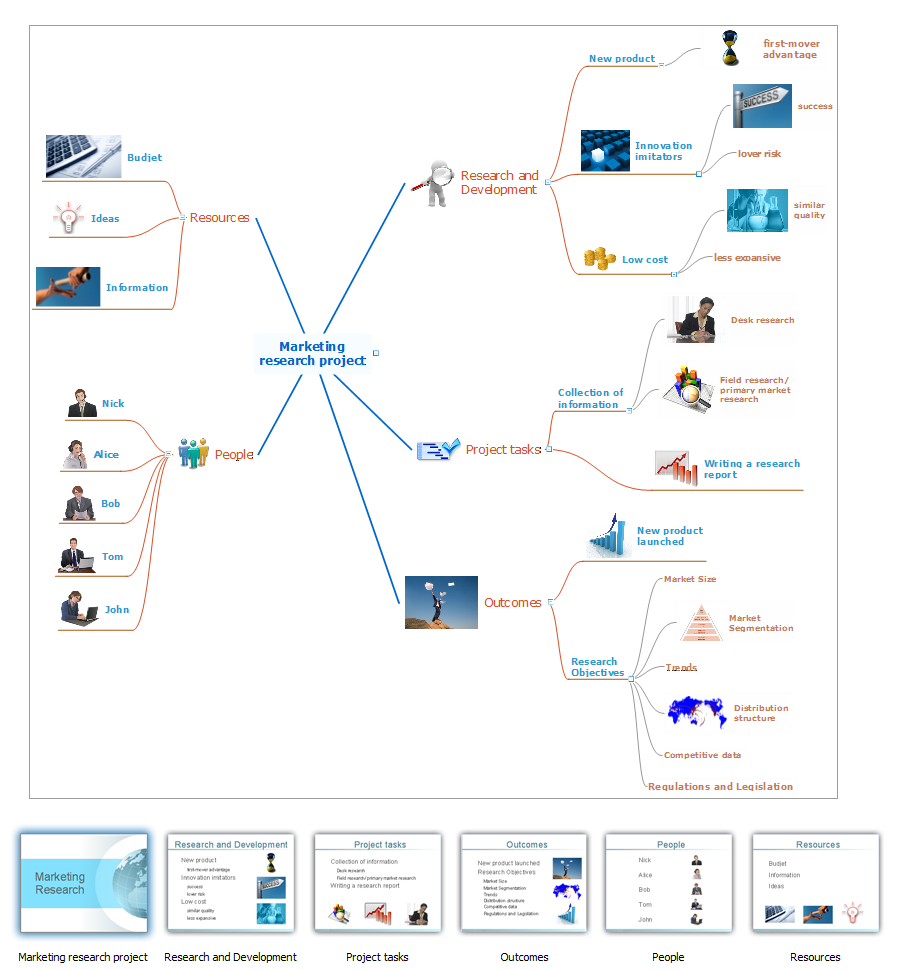
Researches are the main tools used to expand the boundaries of our knowledge in all fields of science and business. Today, it is impossible to authentically explain the behavior and intentions of customers of the company, its dealers and competitors, without serious marketing researches. The efficiently gathered, reliable and accurate information is extremely important when making the marketing decisions. It gives a company the opportunity to achieve a certain competitive advantage, to reduce financial risks, dangers and uncertainties, to objectively determine the attitude of consumers, to analyze external environment, to improve the strategy and tactics of market behavior. The marketing researches cover the market, competitors, consumers, prices, internal capacity of an enterprise and many other factors, but themselves they do not guarantee a success. However their quality performance and skillful use contribute to the achievement of company objectives. ConceptDraw MINDMAP is convenient for professional designing the Mind Maps, which represent knowledge about the process of marketing researches, visually reflect the results of marketing researches, organize the information about tasks, resources, outcomes and people for a marketing research project.Program to Make Flow Chart
Use ConceptDraw DIAGRAM diagramming and business graphics software for drawing your own PM life cycle flow charts.How To Conduct Effective Team Briefings
A team briefing tool is an excellent way to enable communication upwards, downwards and sideways throughout an organisation.
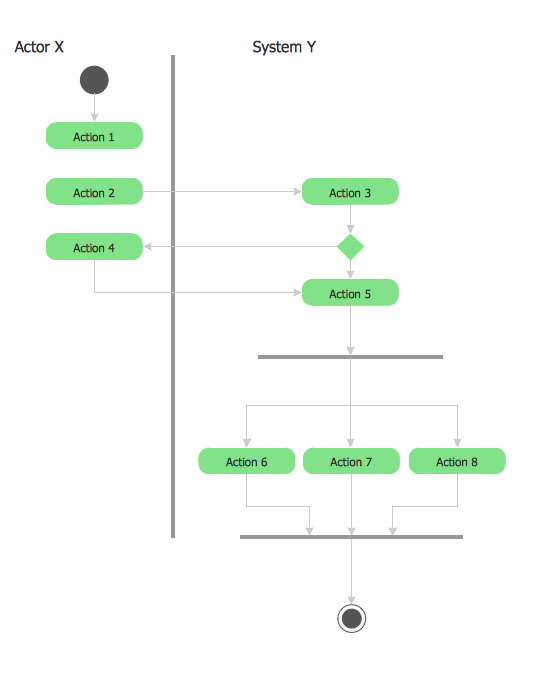
UML 2 4 Process Flow Diagram
This sample was created in ConceptDraw DIAGRAM diagramming and vector drawing software using the UML Activity Diagram library of the Rapid UML Solution from the Software Development area of ConceptDraw Solution Park.Remote Projects in Corporate Strategy
Communication is the main challenge and the key success factor for organizational project management in company with remote projects. Communicating visually via Skype you bring all projects together to achieve corporate goals.
Value Stream Diagram
The new Value Stream Mapping solution found in the ConceptDraw Solution Park continues to extend the range of ConceptDraw DIAGRAM into a business graphics tool.Basic Diagramming
Try ConceptDraw program, the perfect drawing tool for creating all kinds of great-looking drawings, charts, graphs, and illustrations.
Line Chart Template for Word
This sample was created in ConceptDraw DIAGRAM diagramming and vector drawing software using the Line Graphs Solution from Graphs and Charts area of ConceptDraw Solution Park. This sample shows the Line Chart of annual percentage change. The Line Chart allows you to clearly see the changes of data over the time.Project Timeline
Project timeline is a type of chart which allows visually represent the chronology of works for the project, placing the key points of the project (milestones) on a timescale. You need to make professional looking project timeline? Create it with ConceptDraw DIAGRAM ! ConceptDraw DIAGRAM extended with Timeline Diagrams Solution from the Management Area is the best timeline diagrams software- Sample Project Flowchart. Flowchart Examples | Project ...
- Project Management Sample Schedule
- Process Flowchart | Sample Project Flowchart. Flowchart Examples ...
- What Is Er Diagram Sample Project Management System
- Gant Chart in Project Management | Gantt chart examples ...
- Software Project Management Sample Project Gantt Chart
- ConceptDraw PROJECT Project Management Software Tool ...
- Project management life cycle - Flowchart | Product life cycle ...
- Project Time Management Plan Sample
- Software Work Flow Process in Project Management with Diagram ...
- Project management life cycle - Flowchart | Audit flowchart - Project ...
- Diagram Of It Project Management
- Project Management Dashboard Sample
- Sample Of Gantt Chart For Project Proposal
- Gantt chart examples | Online Marketing Objectives | Gant Chart in ...
- Types of summaries - Slide sample | Project Management Area ...
- How to Manage Multiple Projects on Mac | ConceptDraw PROJECT ...
- Project management life cycle - Flowchart | PM Dashboards ...
- Class Diagram For Project Management System
