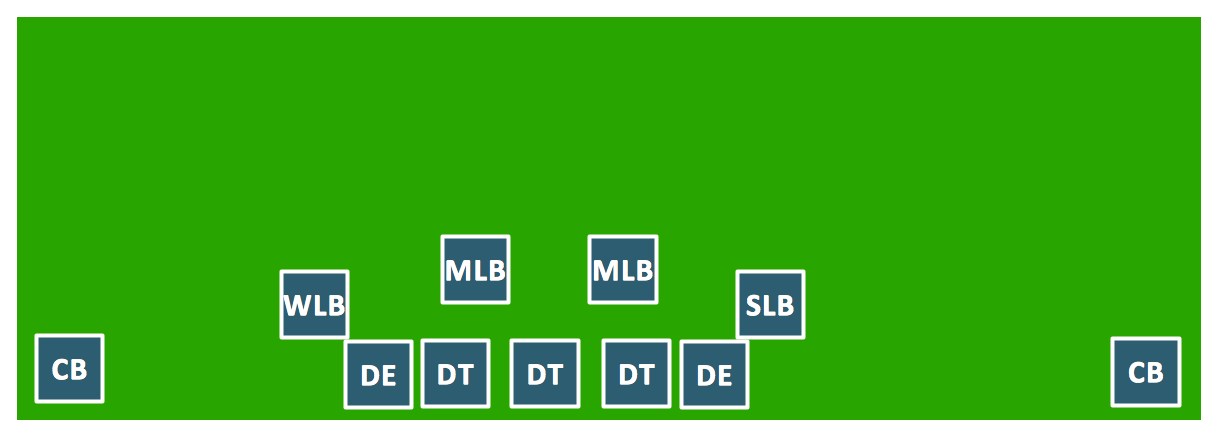
Goal Line Formation (Offense/Defense) Diagram
ConceptDraw PRO software extended with the Football solution delivers libraries, templates and samples allowing football fans or specialists to draw football-related schemas in minutes. A complete set of predesigned fields and positions make drawing schemas as quickly as possible.Soccer (Football) Diagram Software
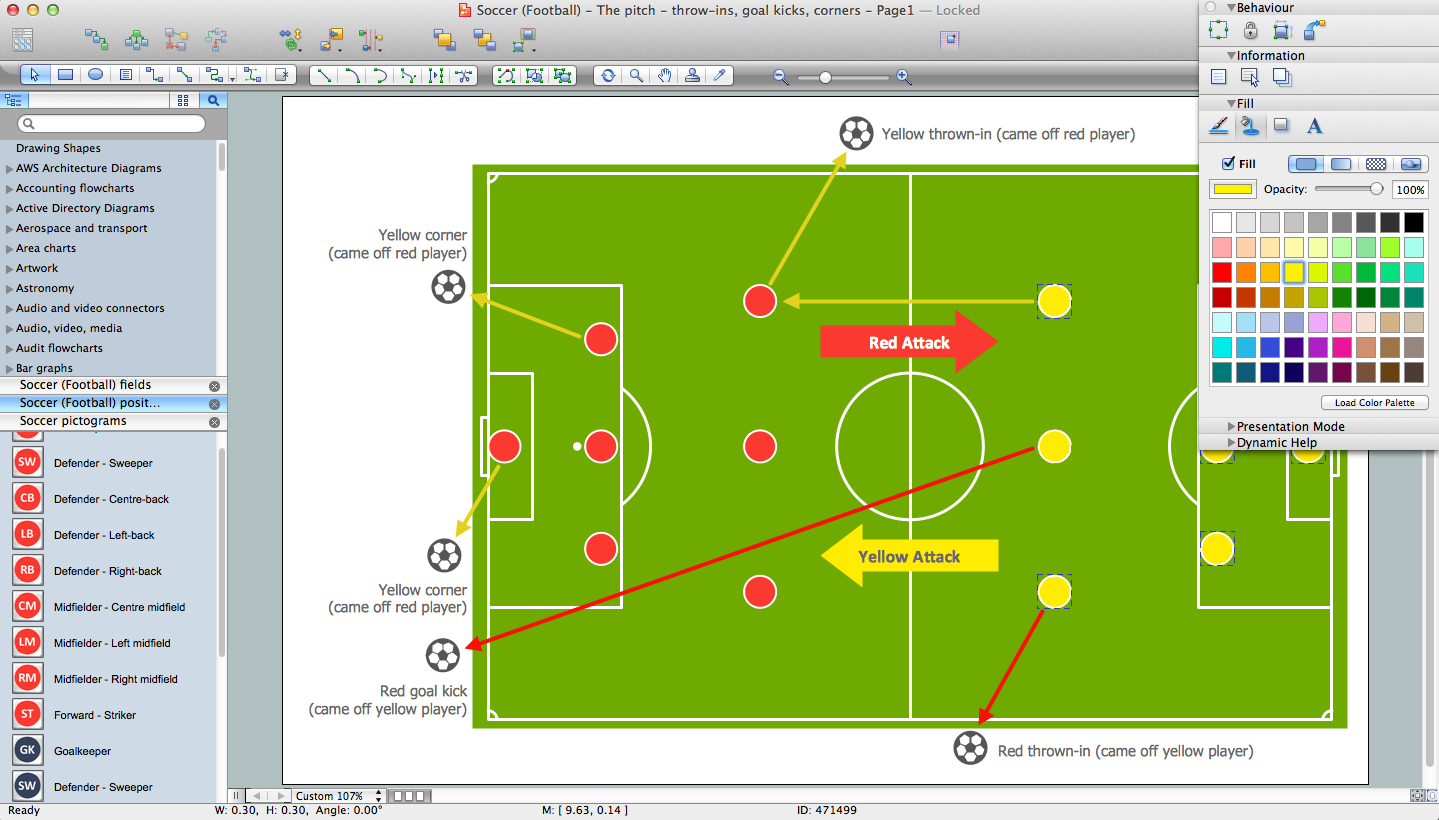
Explaining the soccer strategies and techniques is practically impossible without drawing a diagram. ConceptDraw PRO diagramming and vector drawing software extended with Soccer solution from the Sport area of ConceptDraw Solution Park is a very convenient and useful tool for designing the soccer-related diagrams.Create Soccer (Football) Positions
Explaining the soccer techniques and rules becomes much more easier and time saving with illustrations. The Soccer solution from the Sport area of ConceptDraw Solution Park provides the libraries, templates and samples that will help you produce the soccer illustrations of any complexity in minutes.Basketball Plays Software
Basketball is a popular sport played by two teams of five players with a ball. The game takes place on a rectangular court. The team goal is to score a ball into the basket of the opponent team. The team with the most points wins the game.ConceptDraw PRO diagramming and vector drawing software extended with Basketball solution from the Sport area of ConceptDraw Solution Park is a very useful tool for designing the basketball-related diagrams of any complexity.
Basketball Court Dimensions
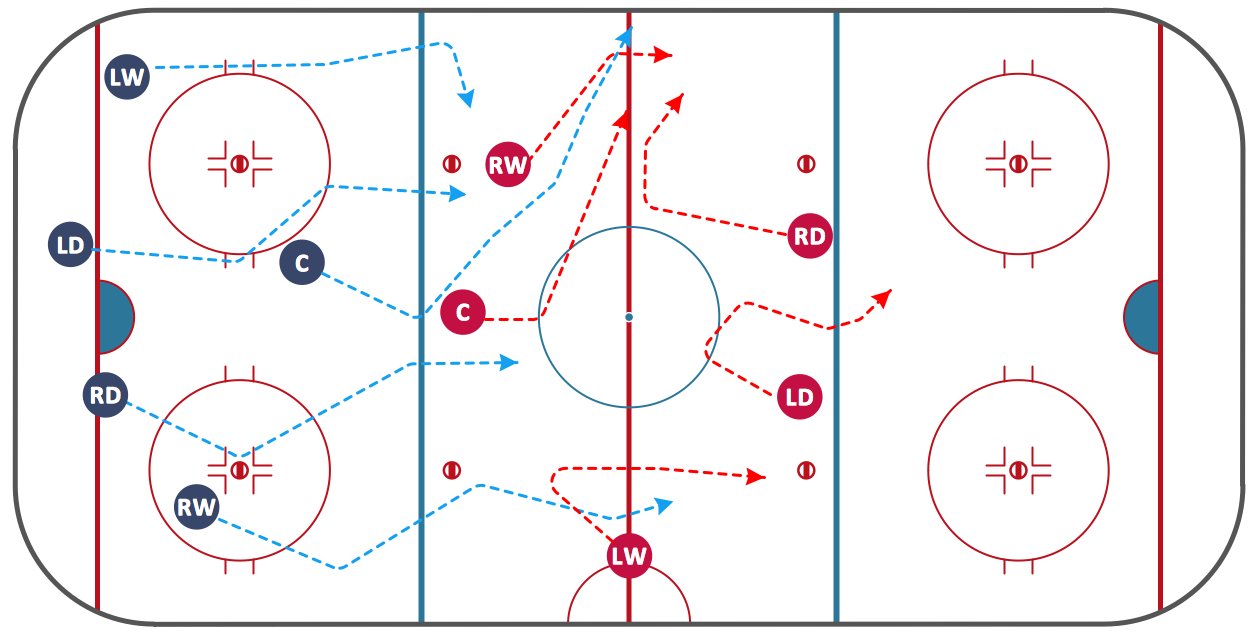
Basketball is team play with a ball a special court. The goal is to throw a ball into one of the baskets, which are mounted to a backboard at a certain height on the edges of the court.Ice Hockey Diagram – Defensive Strategy – Neutral Zone Trap
In ConceptDraw PRO you can produce ice hockey diagrams of any complexity for any presentaion needs, using a combination of tools. To adopt the sample below for presentation needs place positions and arrows onto different layers of your document and then make them visible one by one during a presentation.Ice Hockey Diagram – Entering Offensive Zone Drill
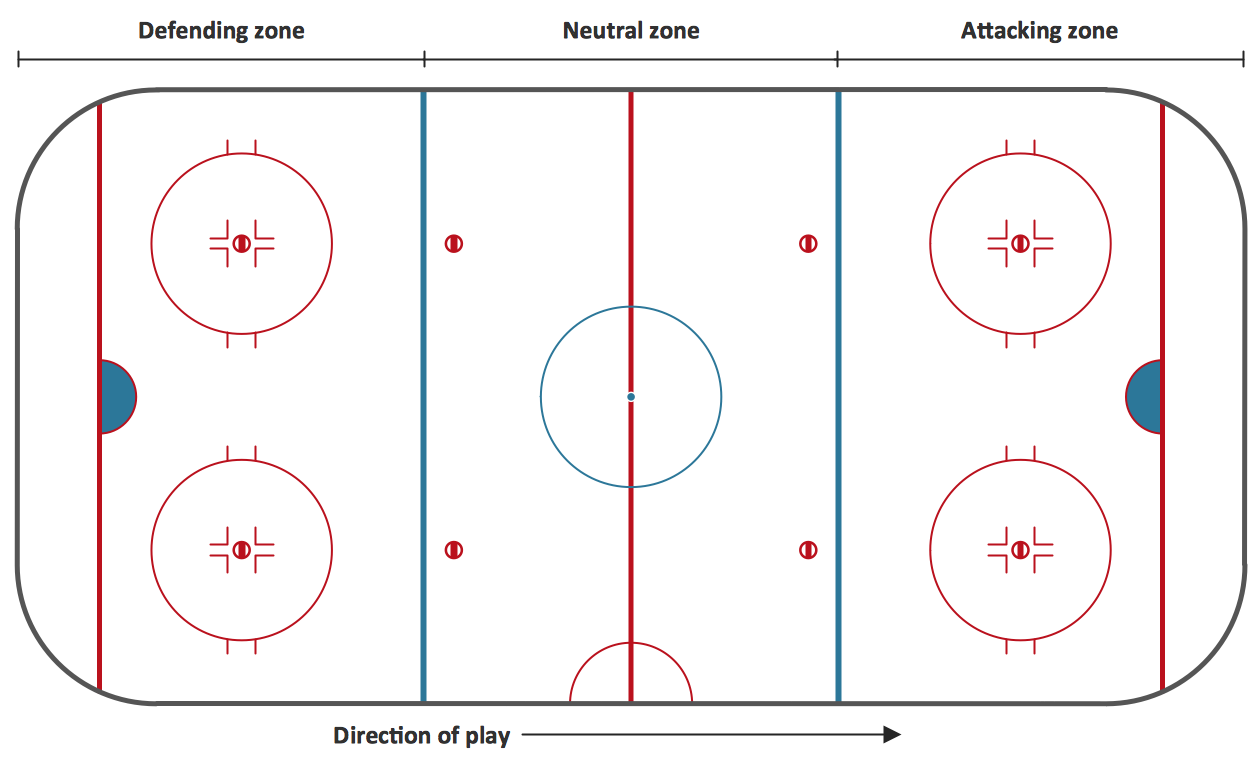
ConceptDraw PRO software extended with the Ice Hockey Solution allows you to draw professional looking ice hockey diagrams in minutes. You can easily customize existing samples or produce you own ones.Ice Hockey Rink Diagram
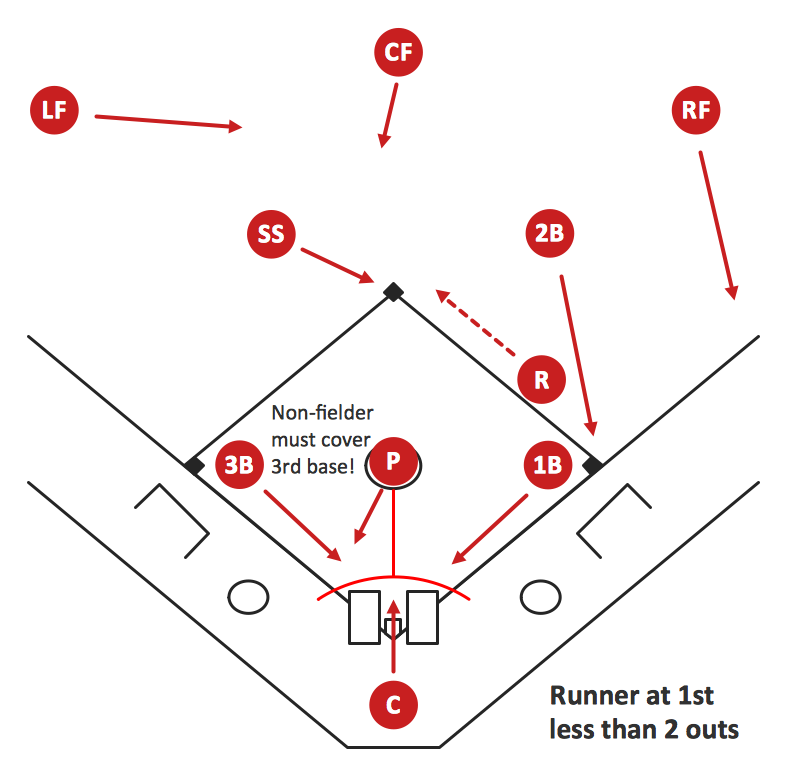
The main advantage of using ConceptDraw Ice Hockey Solution is that you don't need to draw objects manually, you have all you need in libraries, templates and samples. This allows you produce professional ice hockey diagrams as quickly as possible, and then post them to blog or social media, print or present on a large screen.Baseball Diagram – Basic Bunt Coverage – Runner at 1st
ConceptDraw PRO software extended with the Baseball solution delivers samples with diagrams of the most popular plays in baseball. You can complete this set modifying any sample. All you need is to drag and drop objects to depict another play and then save with the different name. Feel free to add text label with the play name directly to your document.
 Rapid UML
Rapid UML solution extends ConceptDraw PRO software with templates, samples and libraries of vector stencils for quick drawing the UML diagrams using Rapid Draw technology.
- Soccer | Soccer ( Football ) Tactics | Soccer ( Football ) Formation ...
- Soccer ( Football ) Formation | Soccer ( Football ) Diagram Software ...
- Microsoft Visio 2003 Download
- Soccer ( Football ) Diagram Software | Soccer ( Football ) Positions ...
- Soccer ( Football ) Formation | Basketball Court Diagram and ...
- Sample Football Field
- Soccer ( Football ) Diagram Software
- Soccer ( Football ) Formation | Soccer ( Football ) Illustrated | Soccer ...
- Soccer ( Football ) Formation | Soccer ( Football ) Positions | Design ...
- Soccer ( Football ) Formation | Defensive Formation – 4-3 Defense ...
- Soccer ( Football ) Positions | Soccer ( Football ) Formation | Soccer ...
- Basketball Court Dimensions | Soccer ( Football ) Formation ...
- Soccer ( Football ) Diagram Software | Baseball Diagram – Colored ...
- Basketball Plays Software | Soccer ( Football ) Diagram Software ...
- Soccer ( Football ) Diagram Software | Soccer ( Football ) Tactics | How ...
- Soccer ( Football ) Formation | Ice Hockey Rink Dimensions | Soccer ...
- Basketball Court Diagram and Basketball Positions | Soccer ...
- Soccer ( Football ) Positions | Soccer ( Football ) Formation | Baseball ...
- Soccer ( Football ) Formation | Soccer ( Football ) Positions ...
- Football Positions On A Field
