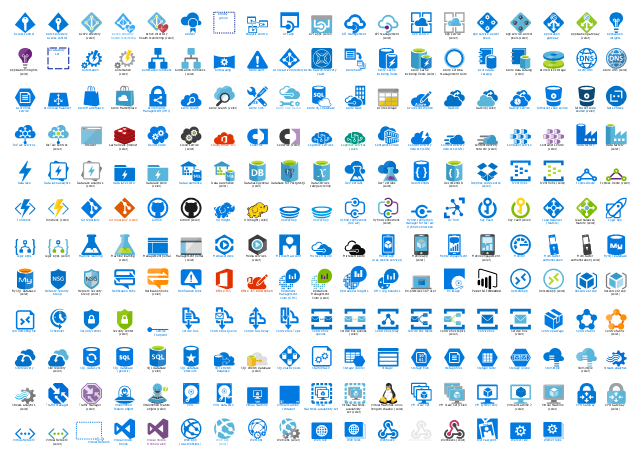
The vector stencils library "Azure architecture - Cloud" contains 227 Microsoft Azure architecture symbols.
Use this cloud computing icon set to design your Azure architecture diagrams with ConceptDraw PRO diagramming and vector drawing software.
"Cloud computing allows application software to be operated using internet-enabled devices. Clouds can be classified as public, private, and hybrid. ...
Cloud computing relies on sharing of resources to achieve coherence and economies of scale, similar to a utility (like the electricity grid) over a network. At the foundation of cloud computing is the broader concept of converged infrastructure and shared services.
Cloud computing, or in simpler shorthand just "the cloud", also focuses on maximizing the effectiveness of the shared resources. Cloud resources are usually not only shared by multiple users but are also dynamically reallocated per demand. This can work for allocating resources to users. ... This approach should maximize the use of computing power thus reducing environmental damage as well since less power, air conditioning, rack space, etc. are required for a variety of functions. With cloud computing, multiple users can access a single server to retrieve and update their data without purchasing licenses for different applications." [Cloud computing. Wikipedia]
The symbols example "Design elements - Azure architecture - Cloud" is included in the Azure Architecture solution from the Computer and Networks area of ConceptDraw Solution Park.
The vector stencils library "Workflow diagrams" contains 54 symbol icons of workflow diagrams.
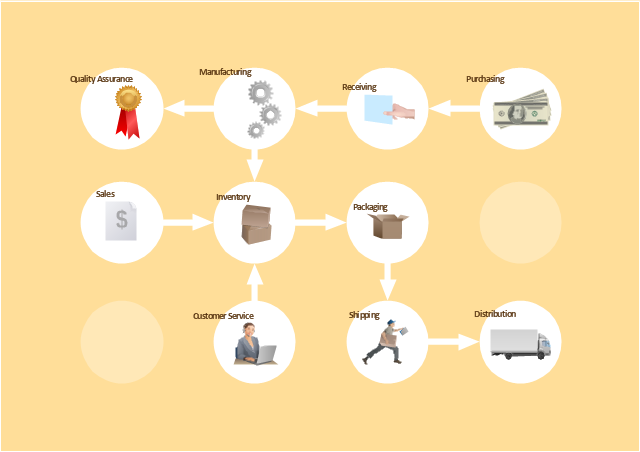
Use these clipart to represent information flow, automation of business processes, business process re-engineering, accounting, management, and human resources tasks in industry, business, and manufacturing.
"The term workflow is more commonly used in particular industries, such as printing and professional domains, where it may have particular specialized meanings.
(1) Processes: A process is a more general notion than workflow and can apply to physical or biological processes, for instance; whereas a workflow is typically a process or collection of processes described in the context of work, such as all processes occurring in a machine shop.
(2) Planning and scheduling: A plan is a description of the logically necessary, partially ordered set of activities required to accomplish a specific goal given certain starting conditions. A plan, when augmented with a schedule and resource allocation calculations, completely defines a particular instance of systematic processing in pursuit of a goal. A workflow may be viewed as an (often optimal or near-optimal) realization of the mechanisms required to execute the same plan repeatedly.
(3) Flow control is a control concept applied to workflows, to distinguish from static control of buffers of material or orders, to mean a more dynamic control of flow speed and flow volumes in motion and in process. Such orientation to dynamic aspects is the basic foundation to prepare for more advanced job shop controls, such as just-in-time or just-in-sequence.
(4) In-transit visibility is a monitoring concept that applies to transported material as well as to work in process or work in progress, i.e., workflows." [Workflow. Wikipedia]
The example "Workflow diagram - Business" was drawn using the ConceptDraw PRO diagramming and vector drawing software extended with the Workflow Diagrams solution from the Business Processes area of ConceptDraw Solution Park.
Pyramid Diagram and Pyramid Chart
Pyramid Diagram, Triangle Chart or Triangular Diagram is a convenient and useful type of diagrams, which lets represent the data hierarchical structure and to illustrate the foundation-based relationships between the hierarchy levels. Pyramid Diagrams are used to visualize effectively the hierarchical, as well as proportional and foundation-based relationships, the process steps, the interconnections of organizational layers or topics. ConceptDraw DIAGRAM software enhanced with Pyramid Diagrams solution from Marketing area of ConceptDraw Solution Park is a powerful business charting software, that includes all required tools for designing the multilevel Pyramid Diagrams as quickly as possible. The build-in vector stencils and templates are the great aid for designers, a variety of examples and samples is a good base and source of inspiration. Use attractive and vivid 2D and 3D Pyramid Diagrams and Triangle Charts designed in ConceptDraw DIAGRAM to illustrate your documents, presentations, infographics, articles, reports, websites, etc.HelpDesk
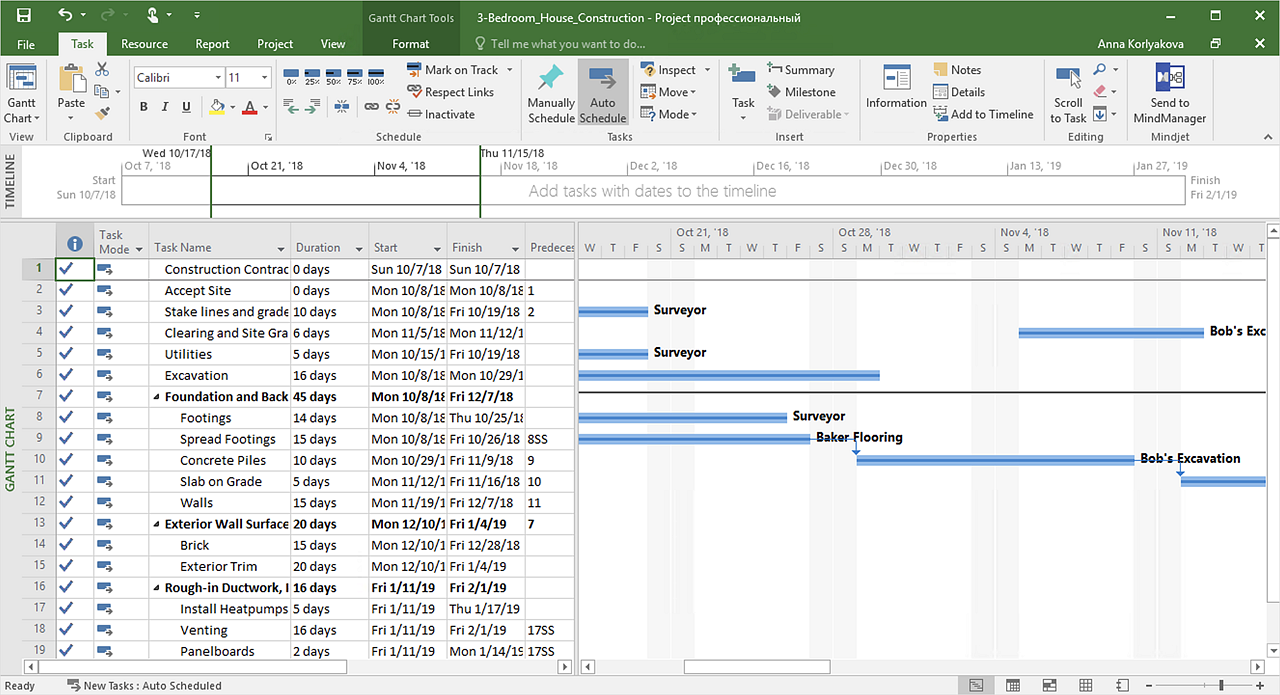
How to Edit a Project Task List
A list of project tasks is core to any project plan. It is the basic part of a project schedule. The project task list should include all of the work associated with fulfilling the project on time. Having an entire and complete task list, the project manager will be able to estimate the costs and resources, necessary to implement the project. The project task list creation is a key piece of project management. The list of project tasks have include activities, should be performed, and the sequence in which tasks need to be completed.Organizational Chart Template
Organizational Charts help to show the relationships of positions within an organization in terms of authority and responsibility. They typically give an actual and clear “snapshot” picture of an organization for both employees and individuals outside, they visually show divisions of work, levels of management, and reporting relationships. ConceptDraw DIAGRAM graphical software supplied with Organizational Charts Solution from the Management Area of ConceptDraw Solution Park offers a number of ready-made organizational chart samples, examples and templates, which you can use as a foundation in your drawing. All they are grouped in topical sets as organizational chart template files and allow easily depict a wide array of organizational structure types, and to represent any business organizational structure, matrix organization structure, or functional structure. Inside the Organizational Charts solution you will find also a set of vector shape libraries containing a lot of icons needed for effective illustration the Organizational Structure Charts of any complexity.HelpDesk
How to Convert a Mind Map into MS Project XML
The easiest way to start this project is to conduct a brainstorm session that identifies necessary tasks, then prepare a project schedule in the form of a Gantt chart and assign resources to tasks. With ConceptDraw MINDMAP, you can initiate a project using a mind map to represent all critical and important tasks. ConceptDraw MINDMAP supports a mind map export to MS Project; it also allows import a project file from MS Project giving team members who use OS X or Windows a working visual map of a planned project.
 25 Typical Orgcharts
The 25 Typical Orgcharts solution contains powerful organizational structure and organizational management drawing tools, a variety of professionally designed organization chart and matrix organization structure samples, 25 templates based on various orga
Organizational Structure
The organizational structure reflects the composition and hierarchy of company's divisions, determines the distribution of authorities and responsibilities within the organization, and facilitates the understanding by workers their responsibilities. It also defines the group of people making key decisions at the company. Visualization of organizational structure of any company, organization or institution is not an easy task, because sometimes the company may include several departments, each with more than thousand persons. For such large organizations often are created the Organizational charts for every department separately. There are many ways of organization's structuring, which determine its work. Often happens that organizational structure adapts to production process. ConceptDraw DIAGRAM extended with unique Organizational Charts solution from Management area of ConceptDraw Solution Park is a powerful organizational structure software, which ideally suits for developing Organizational Charts of any type and any complexity.
 Computer and Networks Area
The solutions from Computer and Networks Area of ConceptDraw Solution Park collect samples, templates and vector stencils libraries for drawing computer and network diagrams, schemes and technical drawings.
Human Resource Management
ConceptDraw DIAGRAM diagramming and vector drawing software enhanced with powerful HR Flowcharts Solution from the Management Area of ConceptDraw Solution Park perfectly suits for Human Resource Management.Venn Diagram Examples for Problem Solving. Computer Science. Chomsky Hierarchy
A Venn diagram, sometimes referred to as a set diagram, is a diagramming style used to show all the possible logical relations between a finite amount of sets. In mathematical terms, a set is a collection of distinct objects gathered together into a group, which can then itself be termed as a single object. Venn diagrams represent these objects on a page as circles or ellipses, and their placement in relation to each other describes the relationships between them. The Venn diagram example below visualizes the the class of language inclusions described by the Chomsky hierarchy."Organizational structure affects organizational action in two big ways. First, it provides the foundation on which standard operating procedures and routines rest. Second, it determines which individuals get to participate in which decision-making processes, and thus to what extent their views shape the organization’s actions." [Organizational structure. Wikipedia]
This hierarchical org chart template for the ConceptDraw PRO diagramming and vector drawing software is included in the 25 Typical Organizational Charts solution from the Management area of ConceptDraw Solution Park.
This hierarchical org chart template for the ConceptDraw PRO diagramming and vector drawing software is included in the 25 Typical Organizational Charts solution from the Management area of ConceptDraw Solution Park.
Organizational Chart Templates
ConceptDraw offers you a number of ready-made organizational chart templates which you can use in your drawing. They are grouped in topical sets as organizational chart template files. Use the Organizational Charts Solution for ConceptDraw DIAGRAM to create your own Organizational Charts of any complexity quick, easy and effective. The Organizational Charts designed with ConceptDraw DIAGRAM are vector graphic documents and are available for reviewing, modifying, converting to a variety of formats (image, HTML, PDF file, MS PowerPoint Presentation, Adobe Flash or MS Visio XML), printing and send via e-mail in one moment.
Purchasing Flowchart - Purchase Order. Flowchart Examples
Create your own flow charts of purchasing business processes using the ConceptDraw DIAGRAM diagramming and vector drawing software extended with the Accounting Flowcharts solution from the Finance and Accounting area of ConceptDraw Solution Park. The flow chart example shows the steps of purchasing business process.
 Entity-Relationship Diagram (ERD)
An Entity-Relationship Diagram (ERD) is a visual presentation of entities and relationships. That type of diagrams is often used in the semi-structured or unstructured data in databases and information systems. At first glance ERD is similar to a flowch
- Converged Infrastructure Icon
- Organization Icon Png
- Cloud Computing Icon
- Flowchart design. Flowchart symbols, shapes, stencils and icons ...
- Customer Relation 3d Icon Png
- Flowchart design. Flowchart symbols, shapes, stencils and icons ...
- Cisco People. Cisco icons , shapes, stencils and symbols | Basic ...
- Knowledge To Serve Png Icon
- Factory Icon Free Png
- Business Development Icon Png
- Flowchart design. Flowchart symbols, shapes, stencils and icons ...
- AWS Simple Icons for Architecture Diagrams | AWS icons 2.0 ...
- Glyph icons - Vector stencils library | Export from ConceptDraw PRO ...
- Up Down Icon Png
- Money Icon Png
- Foundation Layout Website Design
- Network Layout Floor Plans | Design elements - Network layout ...
- Flowchart design. Flowchart symbols, shapes, stencils and icons ...
- Account Icon
- Icon Mis


