Simple Drawing Applications for Mac
ConceptDraw gives the ability to draw simple diagrams like flowcharts, block diagrams, bar charts, histograms, pie charts, divided bar diagrams, line graphs, area charts, scatter plots, circular arrows diagrams, Venn diagrams, bubble diagrams, concept maps, and others.Best Diagramming Software for macOS
ConceptDraw DIAGRAM creates drawings, flowcharts, block diagrams, bar charts, histograms, pie charts, divided bar diagrams, line graphs, area charts, scatter plots, circular arrows diagrams, Venn diagrams, bubble diagrams with great visual appeal on Mac OS X.
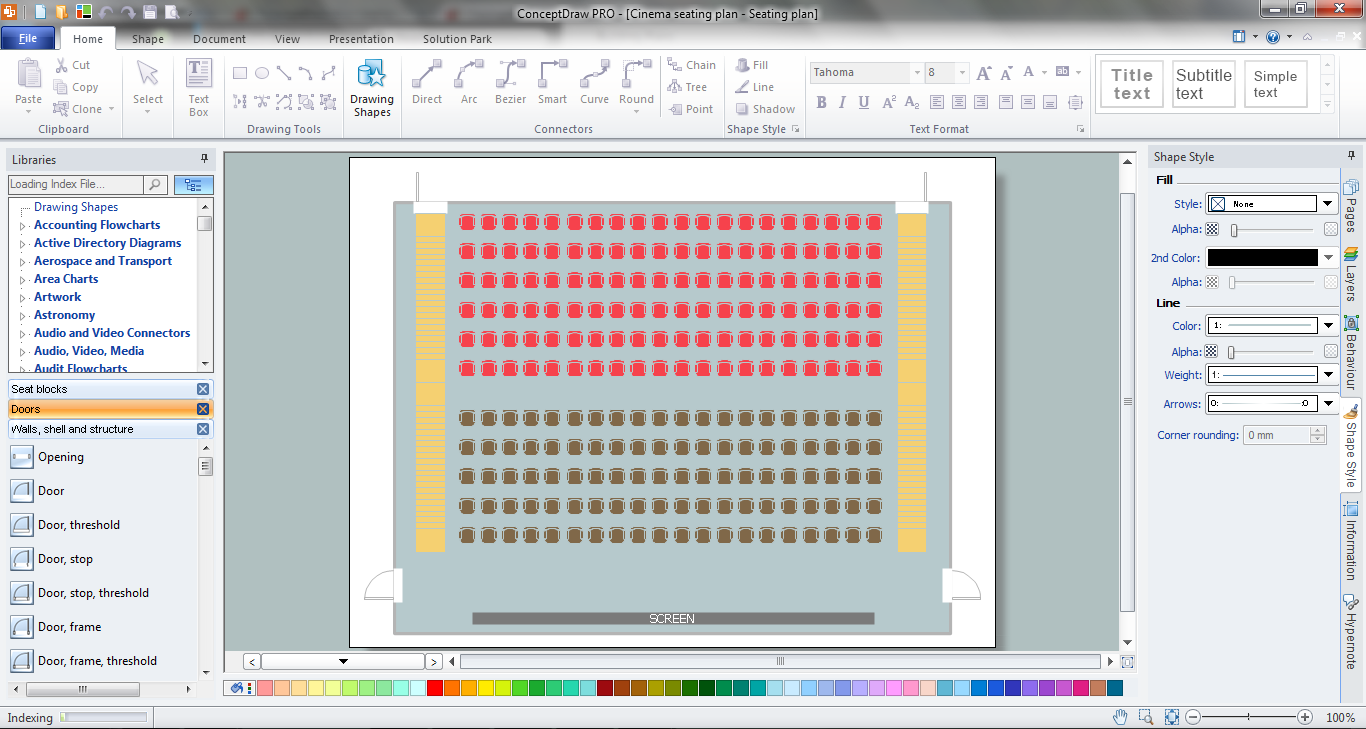
Seating Chart Template Free
You need design the seating chart? The simple way is to use the specialized software. ConceptDraw DIAGRAM diagramming and vector drawing software extended with Seating Plans solution from the Building Plans area with powerful drawing tools, samples, seating chart template free will be ideal for you.How To Create a Flow Chart in ConceptDraw
ConceptDraw DIAGRAM is a flowchart creating software. This software includes over 20 vector stencils in libraries. These objects allow you to create well-designed flowcharts. Put an initial object from library to a page and use RapidDraw technology clicking on direction arrows to add new objects to the flowchart. This way you can make flowchart quickly.How To Make a Bubble Chart
Bubble diagrams solution extends ConceptDraw DIAGRAM software with templates, Using ConceptDraw Connectors, you can make a bubble chart in moments. Using ConceptDraw you will be able to make a bubble chart from the ready ConceptDraw library objects or make your own objects. The created diagram can represent ideas organization, in brainstorming processes, by teachers for explaining difficult ideas or for presentations.Selecting & Creating Flowcharts
ConceptDraw Flowcharts visualize a process or algorithm of program as step/operation blocks of various shapes connected with arrowed lines showed the process flow direction. They are used to visualize business or technical processes and software algorithms.Flow Diagram Software
The diagram is a convenient way of representing complex information and data in a simple, visual and comprehensive form. There are used many types of diagrams, each of them has its own fields of application. Flow diagram is a diagram that illustrates the flow or set of dynamic relationships in a system, visually depicts the structure of the elements in a complex system and their interactions. The term Flow diagram is also synonym for a Flowchart. Flow Diagrams are the perfect way to visually represent the structural data. ConceptDraw DIAGRAM extended with Flowcharts solution from the Diagrams area is a professional flow diagram software. The basic set of vector stencils libraries offered by Flowcharts solution, variety of samples and templates developed by specialists, and also advanced RapidDraw technology open before ConceptDraw users wide opportunities in representing the flow processes, in drawing Flow Diagrams and Flowcharts of any type and complexity. Easy tools of exporting to different graphical formats give the possibility of further successful use the diagrams.SWOT analysis Software & Template for Macintosh and Windows
Experienced businessmen and professional marketing specialists know that the success in business largely depends on the chosen company's development strategy. To develop a correct development and promotion strategy for each individual business enterprise is needed a SWOT analysis. It is used to prepare marketing strategies for growing your business in the right direction, helps to develop the strategic alternative in the field of staff management and logistics, assists to know the strengths and weaknesses of the company, and also to identify the factors that affect the industry as a whole and this company in particular. Professional SWOT analysis is often holding by consulting companies. SWOT analysis is that tool which lets you make your business more successful. Realize it easily using professional SWOT analysis software developed for Macintosh and Windows OS - ConceptDraw DIAGRAM. Enhanced with SWOT and TOWS Matrix Diagrams solution, ConceptDraw DIAGRAM offers a lot of predesigned vector stencils for SWOT analysis, quick-start templates, useful SWOT samples and TOWS examples.Bubble Charts
Bubble Charts are convenient way to visualize ideas and concepts by organizing them in a hierarchy. To show the importance of ideas you can use different bubble sizes and colors. ConceptDraw DIAGRAM diagramming and vector drawing software extended with Bubble Diagrams Solution from the "Diagrams" Area affords you the easiest and fastest way for designing professional looking Bubble Charts.Best Multi-Platform Diagram Software
ConceptDraw DIAGRAM is a powerful tool for drawing business communication ideas and concepts, simple visual presentation of numerical data in the Mac environment.Bubble Chart
How to design a Bubble Chart? It’s very easy! All that you need is a powerful software. Never before creation of a Bubble Chart wasn’t so easy as now with tools of Bubble Diagrams Solution from the "Diagrams" Area for ConceptDraw Solution Park.Mac Compatible Remote Presentation
Mac compatible remote presentation, A simple way to share your presentation remotely via Skype. All participants receive presentation file.
How To Create a Bubble Chart
Bubble diagrams solution extends ConceptDraw DIAGRAM software with templates, Using ConceptDraw Connectors, you can create a bubble chart in moments. Using ConceptDraw you will be able to create a bubble chart from the ready ConceptDraw library objects or make your own objects. The created diagram can represent ideas organization, in brainstorming processes, by teachers for explaining difficult ideas or for presentations.How to Draw a Bubble Chart
Video tutorials on ConceptDraw products. Try it today!Good Flow Chart app for Mac
The ConceptDraw DIAGRAM is a good flow chart app for Mac. Numerous vector stencils, samples and templates created by designers allows you to draw any type of flowchart.Bubble diagrams with ConceptDraw DIAGRAM
Using ConceptDraw you will be able to create bubble diagrams from the ready ConceptDraw library objects or make your own objects. The created diagram can be saved and edited, objects can be moved and links between them will be automatically repainted after object moving because of using the ConceptDraw connectors.Diagramming Software for Design UML Timing Diagrams
UML Timing Diagram as special form of a sequence diagram are used to explore the behaviors of objects throughout a given period of time.
ConceptDraw DIAGRAM
ConceptDraw DIAGRAM is a powerful business and technical diagramming software tool that enables you to design professional-looking graphics, diagrams, flowcharts, floor plans and much more in just minutes. Maintain business processes performance with clear visual documentation. Effectively present and communicate information in a clear and concise manner with ConceptDraw DIAGRAM.Interior Design. Sport Fields — Design Elements
People of any gender, age and social status have a passion for different kinds of sport. They can be professionals, enthusiasts, active participants or avid fans, can simply love the sports and participate sport games, or express their passion into a lifestyle. Whether you're a coach, sportsman, organizer of sports competitions, the founder of the sports club, sport center or sport school, you may need to quickly and accurately draw a plan of the sports field, to develop the interior design of sport fields on the open space or at the premises. ConceptDraw DIAGRAM is intended to help you relieve the hard work of drawing. Sport Field Plans solution from Building Plans area of ConceptDraw Solution Park includes a lot of ready-to-use vector design elements for fast and easy design the plans of Sport fields and attached recreation areas, changing rooms, spa zone, and other associated facilities. Interior design sport fields plans give full graphical representation about the fields, their dimensions, arrangement of corresponding attributes, equipment, and lighting.Building Drawing Software for Design Site Plan
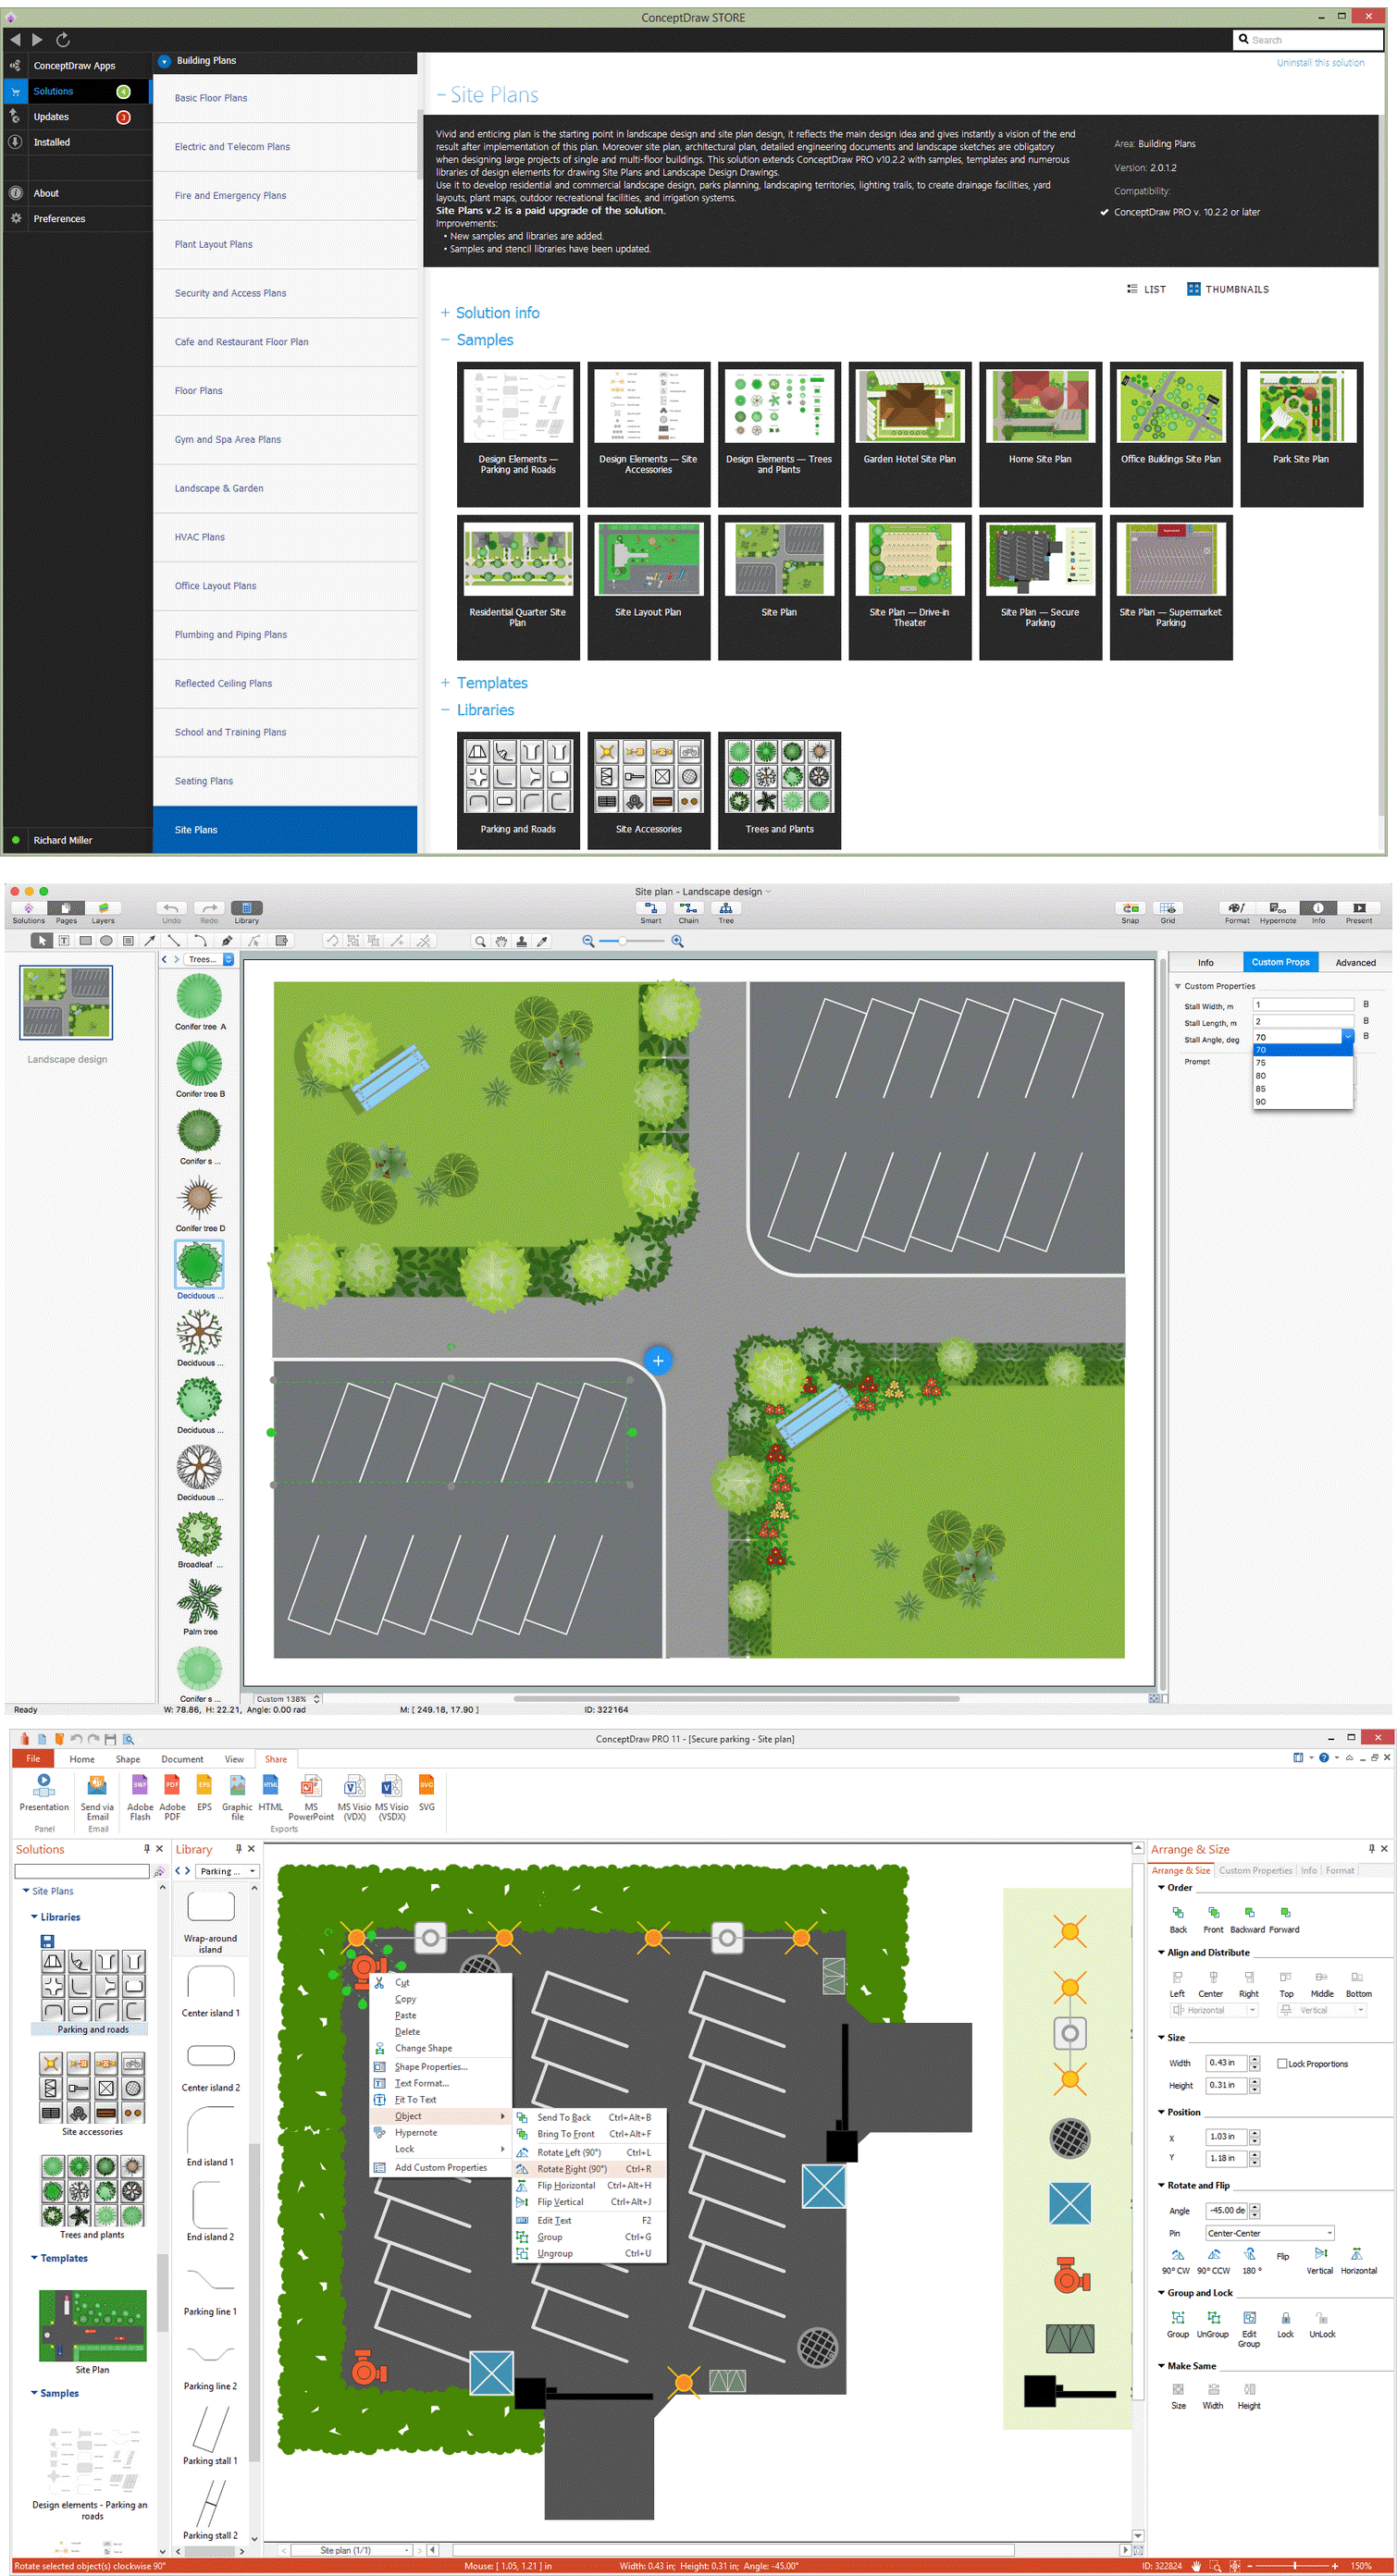
Site plan is a detailed architectural plan or document, landscape architecture project for considered object. It is a part of technical design documentation that illustrates the arrangement of buildings, trails, roads, parking, lighting, water lines, sanitary sewer lines, drainage facilities, landscape and garden elements. Site plans are constructed by architects, landscape designers or licensed design engineers, and used by the builders, contractors and installers when constructing or making improvements to some property. They reflect the main design ideas and give an instantly vision of future result after the plan's implementation. They have special value for the large projects of single or multi-floor buildings, and for accomplishment the whole districts. ConceptDraw DIAGRAM extended with Site Plans solution offers the powerful building drawing software tools and vector design elements for development and drawing Site plans and Landscape design drawings, Residential and Commercial landscape designs, Parks and Landscaping territories plans, Yard layouts, etc.
- Simple Bubble Diagram Template
- Mac Bubble Diagram
- Flow Chart Online | How To Create Visio Bubble Chart | How to Add ...
- Bubble Chart Maker | Bubble Diagrams | Bubble Chart | Free Blank ...
- Bubble Chart Template
- Bubble Chart
- Bubble Chart
- Organizational Chart Template
- Bubble diagrams in Landscape Design with ConceptDraw PRO ...
- Org Chart Template For Mac
- Free Electrical Drawing Program For Mac
- Bubble Flow Chart Template
- Organizational Chart Templates | ConceptDraw DIAGRAM ...
- Venn Diagram Examples for Problem Solving. Venn Diagram as a ...
- Bubble Chart Maker | Flow Diagram Software | Bubble Diagrams ...
- Relationship Bubble Diagram Template Ppt
- How To Create a Bubble Chart | Best Diagramming Software for ...
- Bubble Plot | Marketing Diagrams | Mac Tools - SWOT Analysis ...
- Beauty in nature Illustrations and Clipart | Bubble Diagrams | Best ...


