HelpDesk
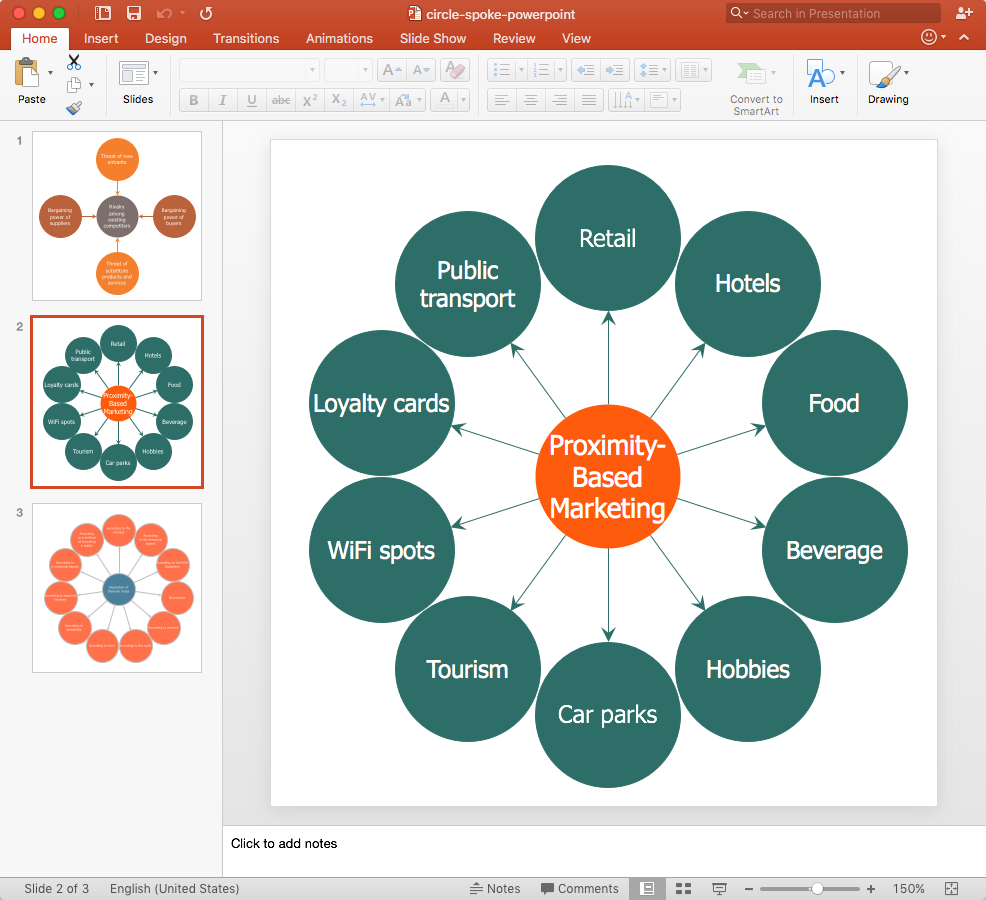
How to Add a Circle-spoke Diagram to PowerPoint
ConceptDraw PRO can be used as a tool for creating circle spoke diagrams along with other marketing diagrams. ConceptDraw PRO allows you to make a MS PowerPoint Presentation from your marketing diagrams in a few simple steps.Basic Flowchart Symbols and Meaning
Flowcharts are the best for visually representation the business processes and the flow of a custom-order process through various departments within an organization. ConceptDraw PRO diagramming and vector drawing software extended with Flowcharts solution offers the full set of predesigned basic flowchart symbols which are gathered at two libraries: Flowchart and Flowcharts Rapid Draw. Among them are: process, terminator, decision, data, document, display, manual loop, and many other specific symbols. The meaning for each symbol offered by ConceptDraw gives the presentation about their proposed use in professional Flowcharts for business and technical processes, software algorithms, well-developed structures of web sites, Workflow diagrams, Process flow diagram and correlation in developing on-line instructional projects or business process system. Use of ready flow chart symbols in diagrams is incredibly useful - you need simply drag desired from the libraries to your document and arrange them in required order. There are a few serious alternatives to Visio for Mac, one of them is ConceptDraw PRO. It is one of the main contender with the most similar features and capabilities.
HelpDesk
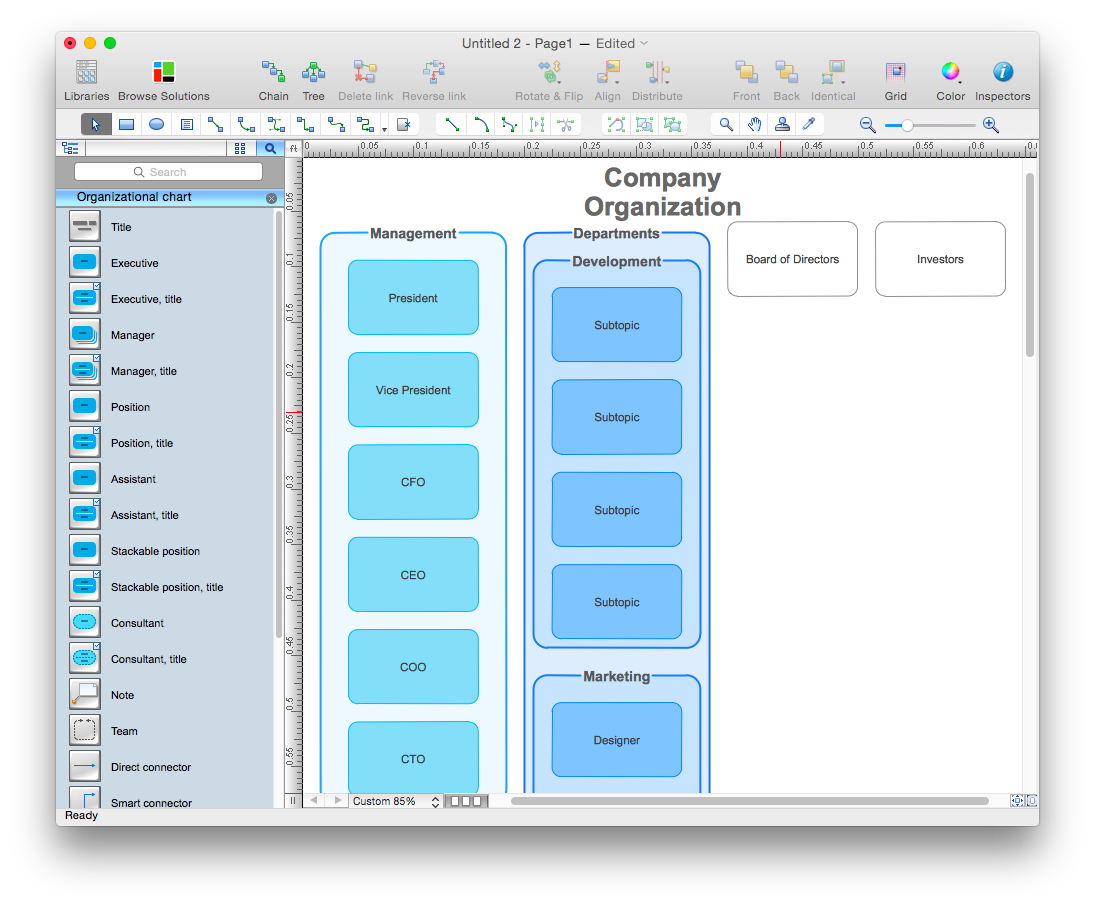
How to Draw an Organizational Chart Using ConceptDraw PRO
The organizational chart software is a valuable tool for modern business. It is important for any business to build a clear organizational structure that determines the responsibilities and relationships between different positions in the organization. The clear structured organization - means the clear structured business workflow, which is the core of success in the business. ConceptDraw PRO is an org chart software that allows you to draw an organizational structure of your company quickly and easily.HelpDesk
How to Create Organizational Chart Using Management Solution
Use ConceptDraw MINDMAP for generating structured data on organization structure and then ConceptDraw PRO for presenting the results as chart.HelpDesk
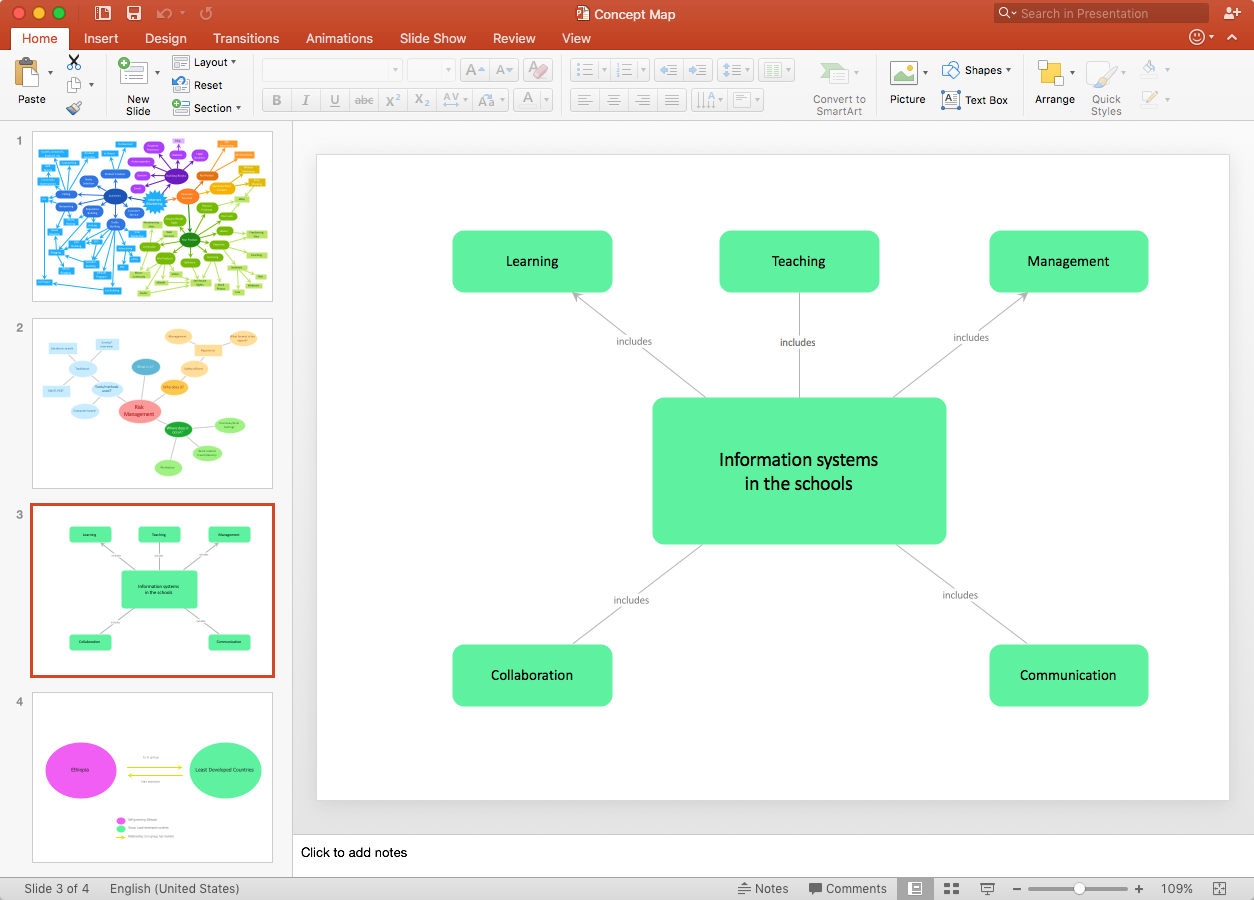
How to Add a Concept Map to a PowerPoint Presentation
Concept maps visually present the relationships among a set of a logically connected items. ConceptDraw PRO allows you to draw concept maps using the Concept Map solution. The PowerPoint presentation of key concept points can be very informative and helpful.HelpDesk
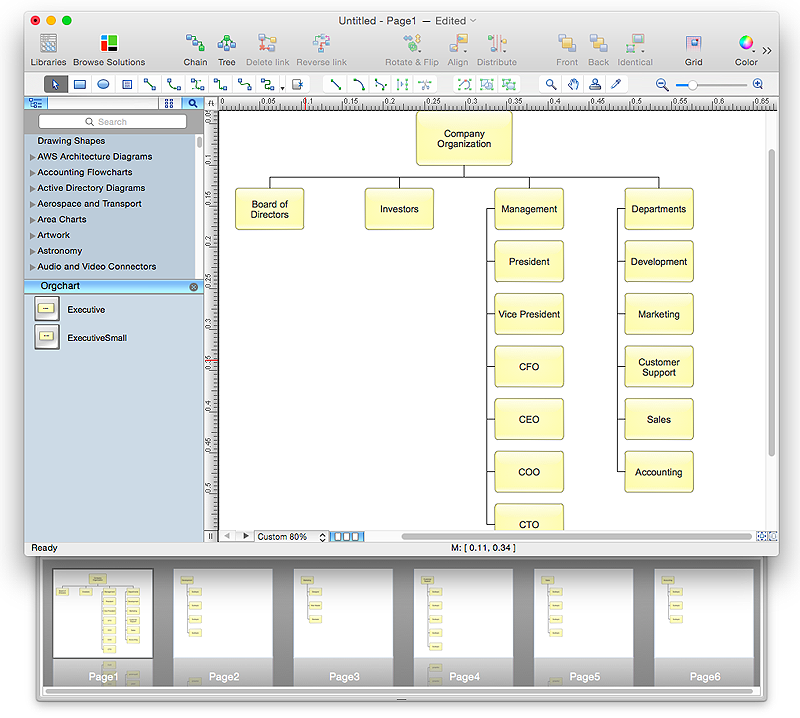
How to Create Organizational Chart Quickly
Use ConceptDraw MINDMAP for generating structured data on organization structure and then ConceptDraw PRO for presenting the results as chart.HelpDesk
How to Create a Timeline Diagram in ConceptDraw PRO
A Timeline is a chart which displays a project plan schedule in chronological order. A Timeline is used in project management to depict project milestones and visualize project phases, and show project progress. The graphic form of a timeline makes it easy to understand critical project milestones, such as the progress of a project schedule. Timelines are particularly useful for project scheduling or project management when accompanied with a Gantt chart. It captures the main of what the project will accomplish and how it will be done. making a project timeline is one of the most important skills a project manager needs have. Making comprehensive, accurate timelines allows you getting every project off in the best way. ConceptDraw PRO allows you to draw a timeline charts using special library.HelpDesk
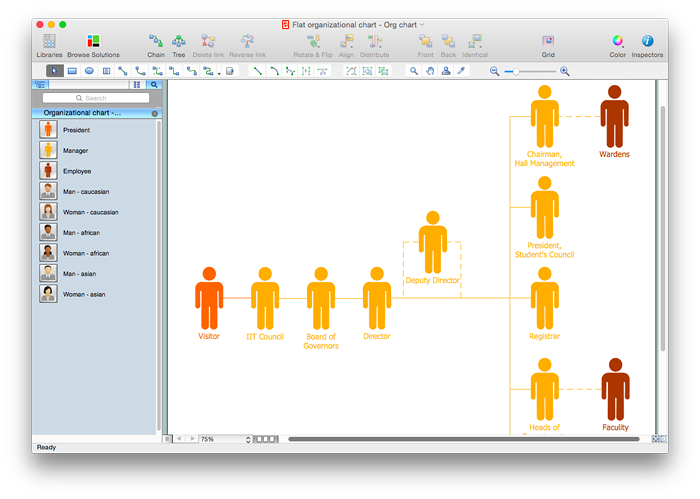
How to Draw a Flat Organizational Chart with ConceptDraw PRO
A clear organizational chart helps you to understand the relationships of positions in an organization in terms of authority and responsibility. A Flat organizational structure is one of the most typical organizational structure. Use The Flat Organizational chart template to draw an organizational structure of your company. ConceptDraw 25 Typical Orgcharts solution provides you with the possibility to develop typical organizational charts quickly and easily.HelpDesk
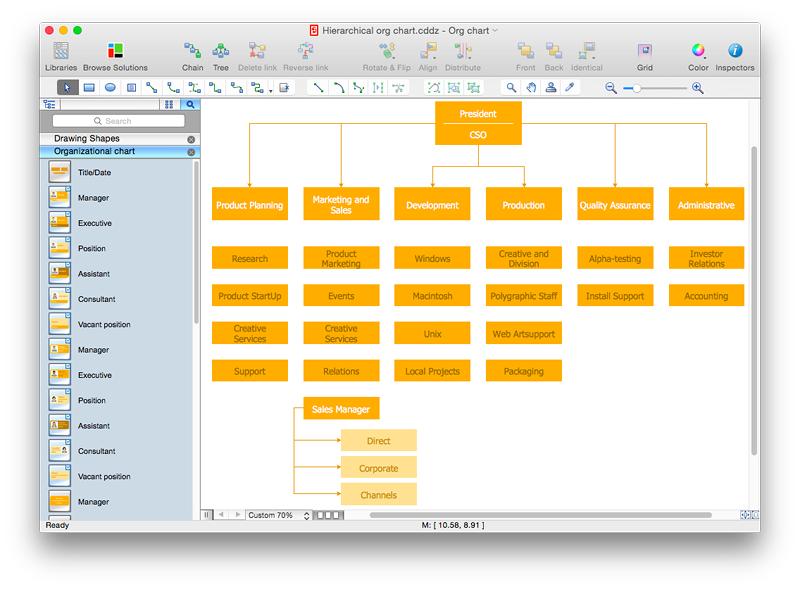
How to Draw a Hierarchical Organizational Chart with ConceptDraw PRO
There are a number of different organisational structures. The most appropriate structure will depend on the size of the business and the type of business. A hierarchical organizational structure is one of the most typical organizational structure. This structure can be represented as a pyramid, with a single entity in authority at the top, with subsequent levels of power beneath them. Each member of the pyramid reports only to their direct subordinates or superiors, limiting the amount of communication overhead, which can be seen both as an asset or a limitation. It is easy to see where a hierarchical structure would be an effective solution; companies that have offices based in disparate locations, a business that focuses on diversified markets, any organization with need for multiple levels of middle management. You can easily create a clear hierarchical organizational chart using ConceptDraw solution that contains templates of the 25 Typical Orgcharts.HelpDesk
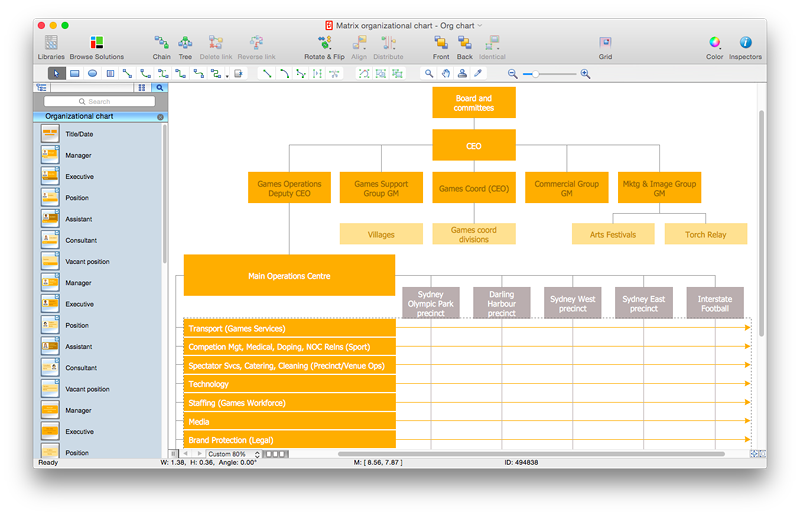
How to Draw a Matrix Organizational Chart with ConceptDraw PRO
There are a number of moments which are influenced on how the organizational structure of a certain business needs to be, how complex, and which type it should keep. The matrix organizational structure is atypical because it brings together employees and managers from different departments to work toward accomplishing a goal. This structure is commonly found in businesses that have more than one line of reportage. For instance, a company might contain an engineering department with engineering managers who workers report to. However, these workers might also have to liaise with different product or project managers depending on current tasks. Some form of matrix organization is found in most large-scale modern businesses. It is one of the most complicated reporting structures. You can easily build a clear matrix organizational chart in ConceptDraw PRO using templates from ConceptDraw Solution Park.Circles Venn Diagram
This example shows the 4 Circle Venn Diagram. The Venn Diagram visualizes all possible logical relations between several sets. The sets are represented as circles on the Venn Diagram. On this example you can see the intersections of 4 sets. Venn Diagrams are widely used in mathematics, logic, statistics, marketing, sociology, etc.HelpDesk
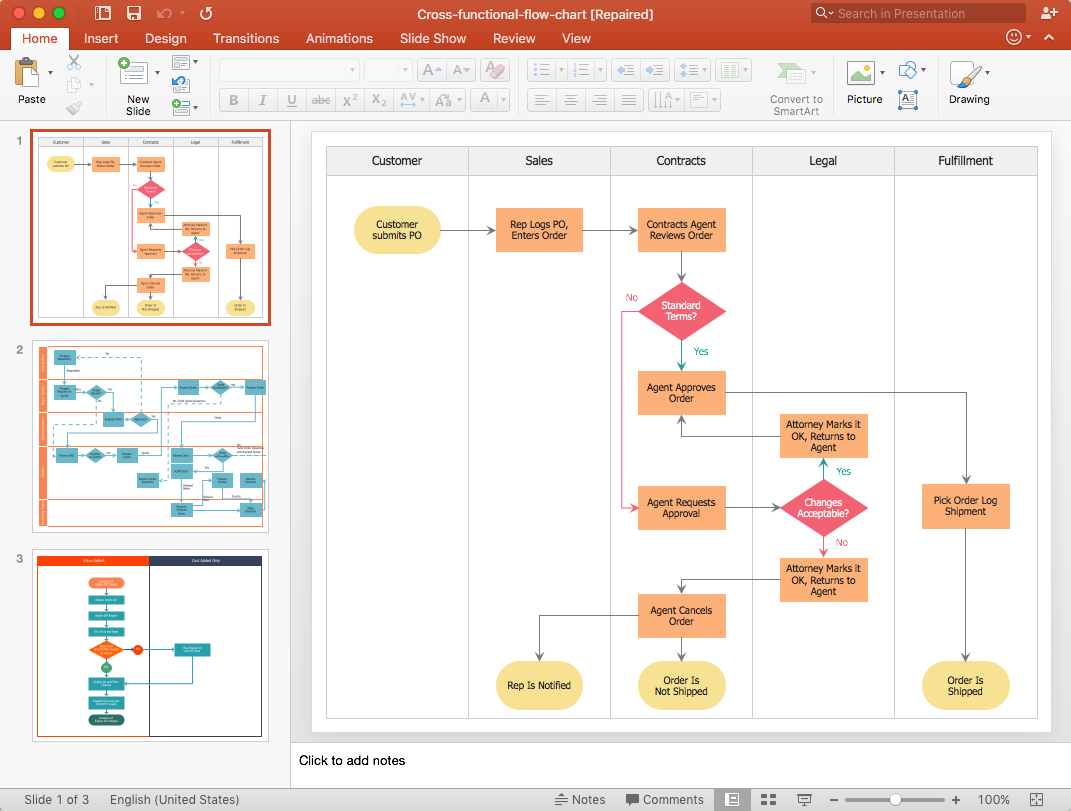
How to Add a Cross-Functional Flowchart to a PowerPoint Presentation
Using a Cross-Functional flowchart is a clear way of showing how business processes get shared or transferred between different teams and departments. ConceptDraw PRO allows you to make an MS PowerPoint Presentation from your flowcharts in a few simple steps.3 Circle Venn Diagram. Venn Diagram Example
This template shows the Venn Diagram. It was created in ConceptDraw PRO diagramming and vector drawing software using the ready-to-use objects from the Venn Diagrams Solution from the "Diagrams" area of ConceptDraw Solution Park. Venn Diagrams visualize all possible logical intersections between several sets and are widely used in mathematics, logic, statistics, marketing, sociology, etc.HelpDesk
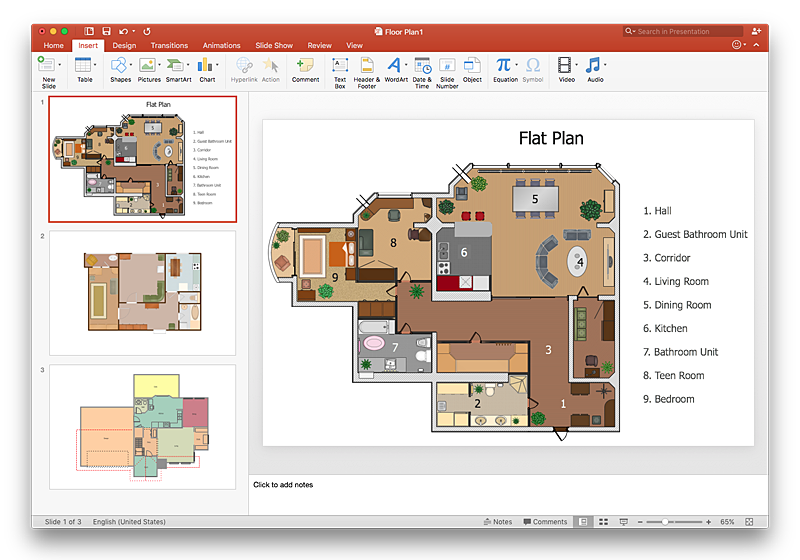
How To Make a PowerPoint Presentation of a Floor Plan
You can use ConceptDraw PRO to perform amazing PowerPoint presentation of the floor plan that includes the sizes, corners, squares and other important technical and design details.HelpDesk
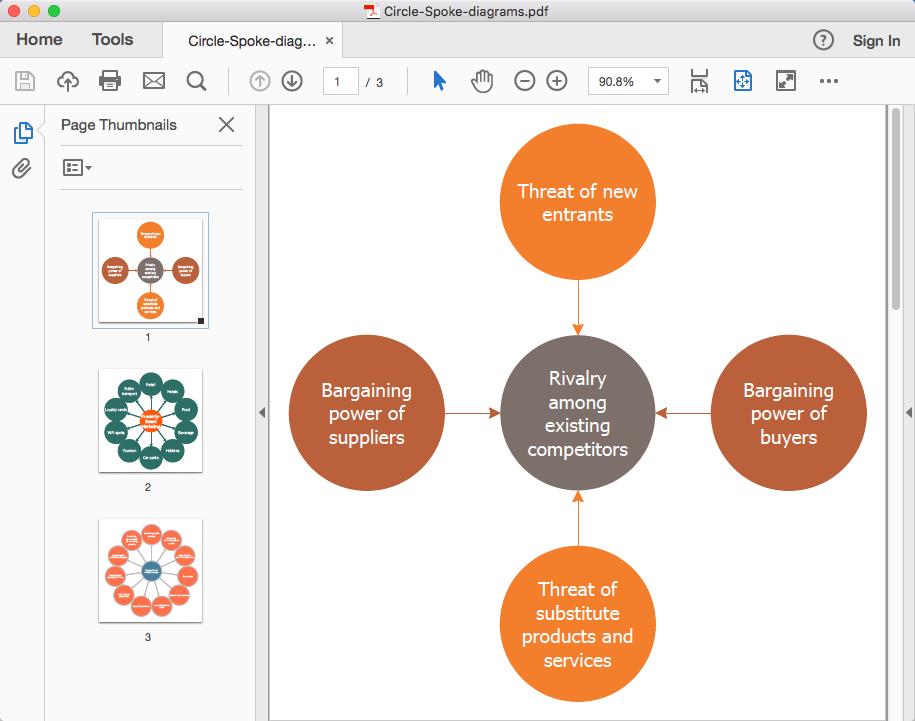
How To Convert a Circle-Spoke Diagram to Adobe PDF
ConceptDraw PRO allows you to easy share your marketing documentation between different computers with different operating systems and applications using it's export capabilities. You can get your marketing diagrams in pdf format and avoid any problems while communicating them.HelpDesk
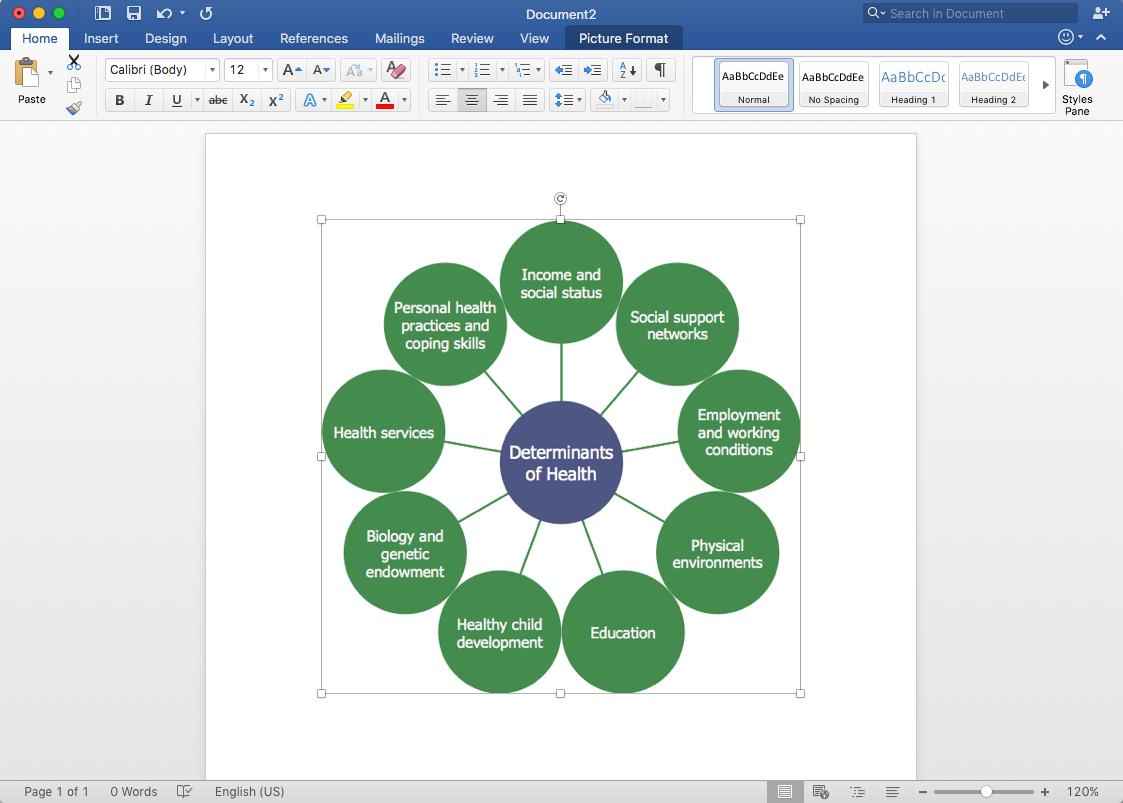
How to Add a Circle-Spoke Diagram to MS Word Document
ConceptDraw PRO allows you to easily create various marketing charts, including the circle-spoke diagrams and then insert them into a MS Word document.HelpDesk
How to Add a Bubble Diagram to PowerPoint Presentation
Bubble diagrams can be used to compare concepts, and identify areas of similarity and difference. ConceptDraw PRO allows you to make a MS PowerPoint Presentation from your charts in a few simple steps.HelpDesk
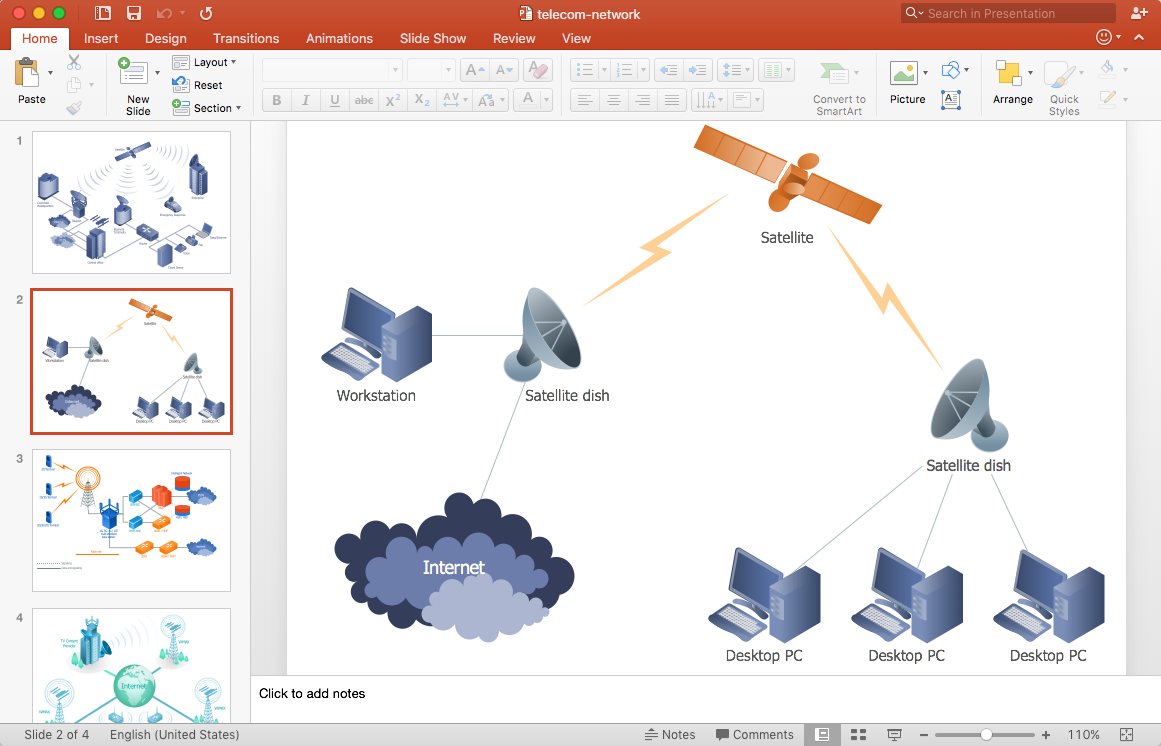
How to Add a Telecommunication Network Diagram to a PowerPoint Presentation
Telecommunication network diagram represents a system consisting of computers, servers, telecommunication devices, switches, satellites, wireless transmitters, antennas, cables, etc., that link a set of remote nodes. It is also describes a telephone exchange, that connects calls between landlines. ConceptDraw PRO allows you to easily create telecommunication network diagrams and then make a PowerPoint Presentation from your network documentation in a few clicks. Telecommunication network diagrams are used to show components and connections in a telecommunications network: how they are interacted between each other and with end-users. The PowerPoint presentation on concept of telecom network can be very informative and helpful. ConceptDraw PRO allows you to make a MS PowerPoint Presentation from your telecommunication network diagrams in a few clicks.HelpDesk
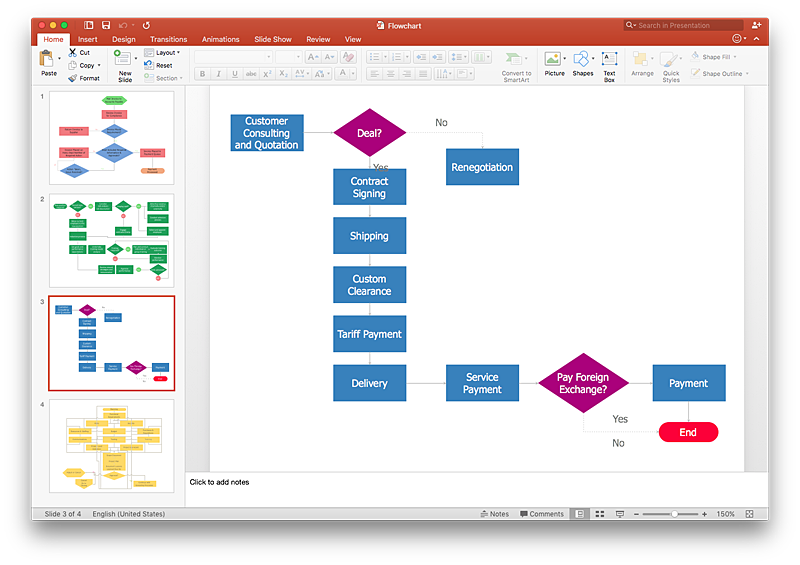
How To Make a PowerPoint Presentation of Flowcharts
ConceptDraw PRO allows you to create professional flowchart quickly and easily. The ability to create flowcharts is contained in the Flowcharts solution. To submit flowcharts for the audience, you can use export to MS PowerPoint.HelpDesk
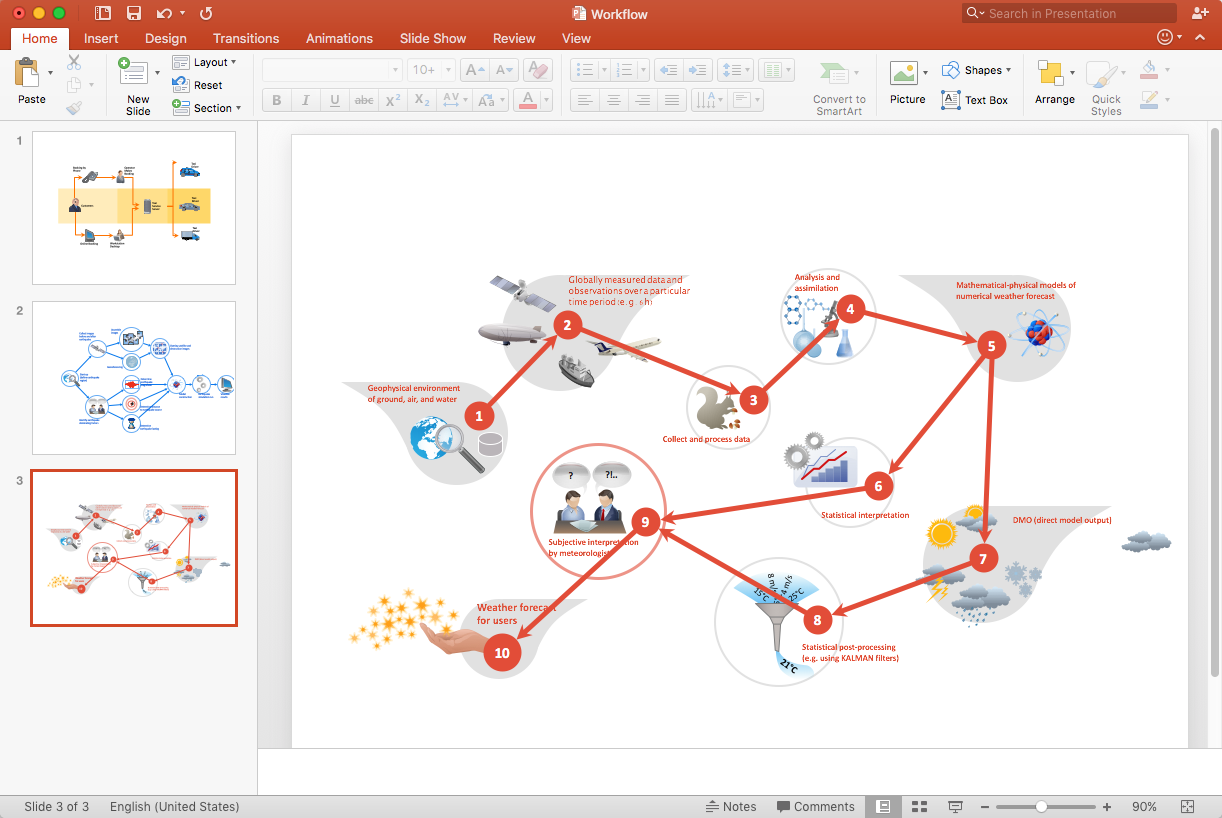
How to Add a Workflow Diagram to a PowerPoint Presentation
Making workflow diagrams in PowerPoint can help to describe the process within your organization as well as making comprehensive analysis presentations for sales or management and also can be used in other presentations and business documentation.- Business diagrams & Org Charts with ConceptDraw PRO
- ConceptDraw PRO - Organizational chart software | How to Create ...
- Basic Circles Venn Diagram. Venn Diagram Example | Multi Layer ...
- Chart Templates For Powerpoint
- Marketing | Six Markets Model Chart Template | Marketing and Sales ...
- How to Draw an Organization Chart | Pie Donut Chart. Pie Chart ...
- Powerpoint Charts Free Download
- Organizational Structure
- Organization Circle Diagram Chart
- Powerpoint Organizational Chart Templates
- Donut Chart Templates Powerpoint
- Organizational Chart Template | Process Flowchart | Horizontal Org ...
- Organizational Chart Template | ConceptDraw PRO - Organizational ...
- Organizational Chart Template | Seating Plans | Line Chart ...
- How To Make a PowerPoint Presentation of a Business Process ...
- Circle -Spoke Diagrams
- Organizational Chart Templates | UML composite structure diagram ...
- Circle Diagrams | How to Add a Circle -spoke Diagram to a ...
- Organizational Charts with ConceptDraw PRO | Organizational ...
- Flow Chart Template | Organization Chart Templates | Best ...
