HelpDesk
How to Design an Interface Mock-up of an Android Application
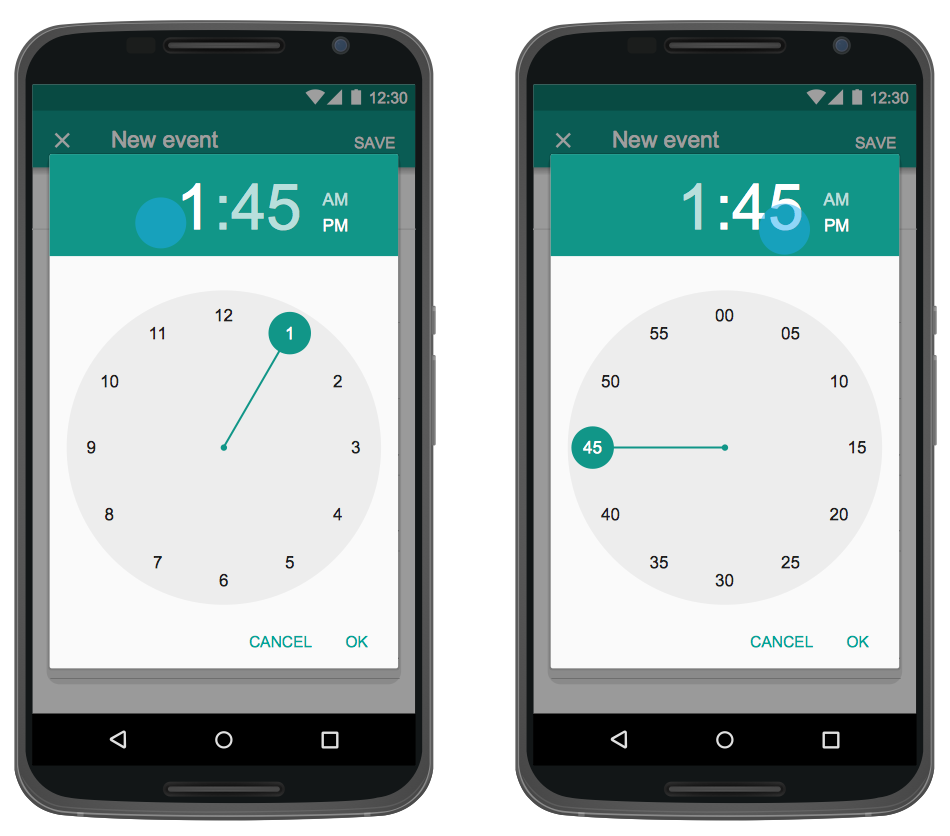
Uses Interface prototyping is much convenient when you can work through a diagram similar to the device design. ConceptDraw DIAGRAM allows you to develop Android User Interface (UI) prototypes using the special templates and vector libraries of the specific user interface elements. Using ConceptDraw DIAGRAM you can mock-up an Android UI system so that you can figure out how best to represent user interface (UI) elements for the development of a new mobile Apps.Android UI Design
The Android operating system is one of the most popular platforms today. It was developed and now used on smartphones, tablets, netbooks, smartbooks, and many other electronic devices, and combines the reliability, flexibility and ease of use. So, millions of people face daily with Android operating system on their devices, and thus one of important things for the developers of Android applications is developing of convenient and attractive Android UI design. ConceptDraw DIAGRAM diagramming and vector drawing software extended with Android User Interface Solution from the Software Development Area will help you in this.In searching of alternative to MS Visio for MAC and PC with ConceptDraw DIAGRAM
Undoubtedly MS Visio is a powerful and multifunctional tool, but however at times occur the instances, when it turns unable of meeting certain users' requirements. At this cases you may need to use an alternative program software, preferably it will be simple, convenient, and at the same time powerful and professional. In searching the alternative to MS Visio for MAC and PC we recommend you to pay attention for ConceptDraw DIAGRAM software, which was developed to satisfy all your drawing needs and requirements. It is a fully-functioned alternative product to MS Visio for both platforms. ConceptDraw DIAGRAM software has many advantages, the main among them are the cross-platform compatibility, a reasonable price, widespread ConceptDraw Solution Park with huge variety of different solutions that offer numerous libraries of specialized vector objects, useful examples, samples, and quick-start templates, extensive import / export capabilities, built-in script language, MS Visio support and certainly free technical support.Linux Audit Flowchart Example. Flowchart Examples
Create your own Linux audit flowcharts using the ConceptDraw DIAGRAM diagramming and vector drawing software extended with the Audit Flowcharts solution from the Finance and Accounting area of ConceptDraw Solution Park. This flowchart example describing auditd, the linux audit tool.
 Android User Interface
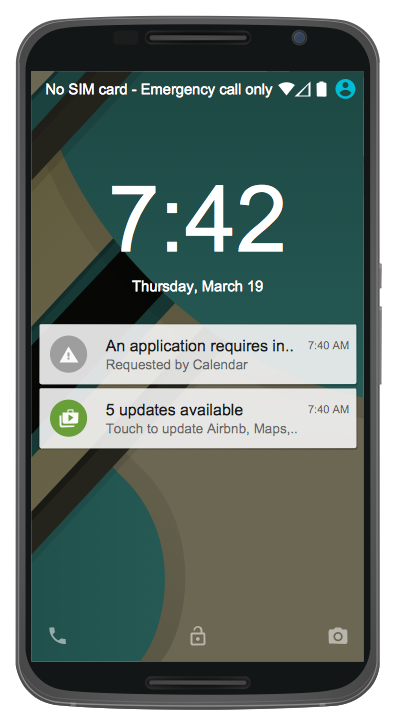
The Android User Interface solution allows ConceptDraw DIAGRAM act as an Android UI design tool. Libraries and templates contain a variety of Android GUI elements to help users create images based on Android UI design.
 ConceptDraw Solution Park
ConceptDraw Solution Park collects graphic extensions, examples and learning materials
Near field communication (NFC). Computer and Network Examples
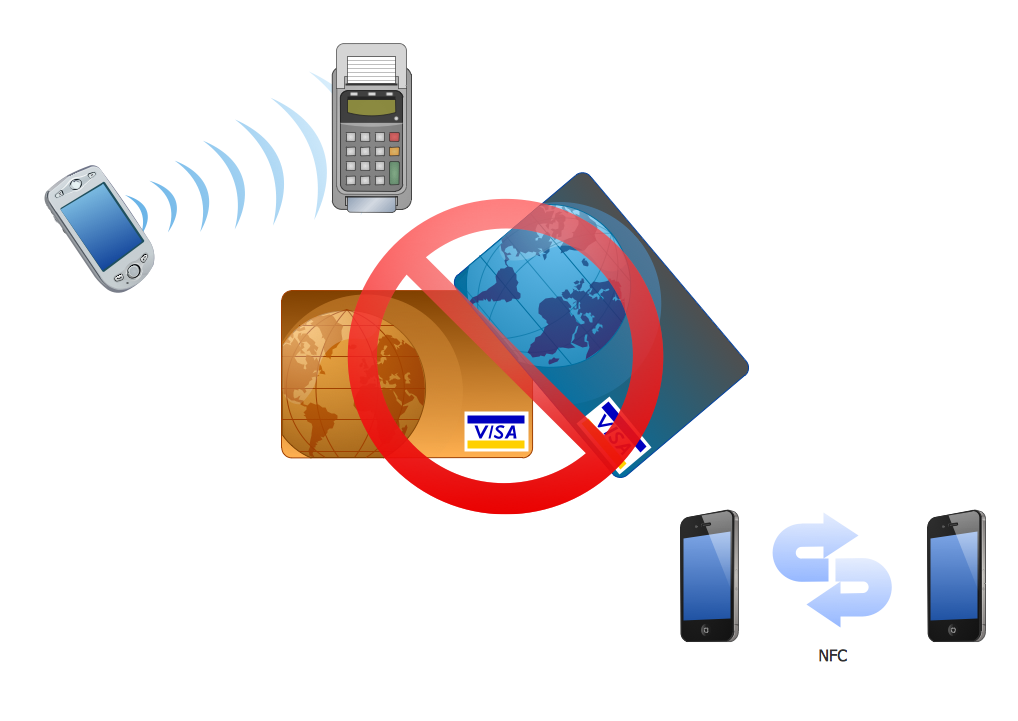
Near field communication (NFC) is a wireless communication technology that allows smartphones and other similar devices to establish the radio communication with each other on the short distance around 10 centimeters (4 inches). This example was created in ConceptDraw DIAGRAM using the Computer and Networks Area of ConceptDraw Solution Park and shows the Near field communication (NFC) network.
 Plant Layout Plans
Plant Layout Plans solution can be used for power plant design and plant layout design, for making the needed building plant plans and plant layouts looking professionally good. Having the newest plant layout software, the plant design solutions and in particular the ConceptDraw’s Plant Layout Plans solution, including the pre-made templates, examples of the plant layout plans, and the stencil libraries with the design elements, the architects, electricians, interior designers, builders, telecommunications managers, plant design engineers, and other technicians can use them to create the professionally looking drawings within only a few minutes.
- Drawing Flowchart In Android
- Top 5 Android Flow Chart Apps | Army Flow Charts | Flowchart ...
- Process Flowchart | Flowchart Software | Top 5 Android Flow Chart ...
- Software Of Flow Chart For Android
- Freeware Flowchart Software
- Flowchart Programming In Android
- Top 5 Android Flow Chart Apps | Flowchart Programming Project ...
- Flowchart Software | Top 5 Android Flow Chart Apps | Process Flow ...
- Building Drawing Software for Design Seating Plan | Top 5 Android ...
- Flowchart Software | Process Flow app for Mac | Top 5 Android Flow ...
- Top 5 Android Flow Chart Apps | Good Flow Chart app for Mac ...
- Flowchart Diagram Drawing Free App Android
- Process Flowchart | Flow Chart Online | Top 5 Android Flow Chart ...
- Android User Interface | How to Design an Interface Mock-up of an ...
- Top 5 Android Flow Chart Apps | Flowchart Software | Good Flow ...
- Flow Chart Online | Process Flowchart | Top 5 Android Flow Chart ...
- Top 5 Android Flow Chart Apps | Process Flowchart | Flowchart ...
- Top 5 Android Flow Chart Apps | How to Design an Interface Mock ...
- Easy Flowchart Program and Standard Flowchart Symbols ...


