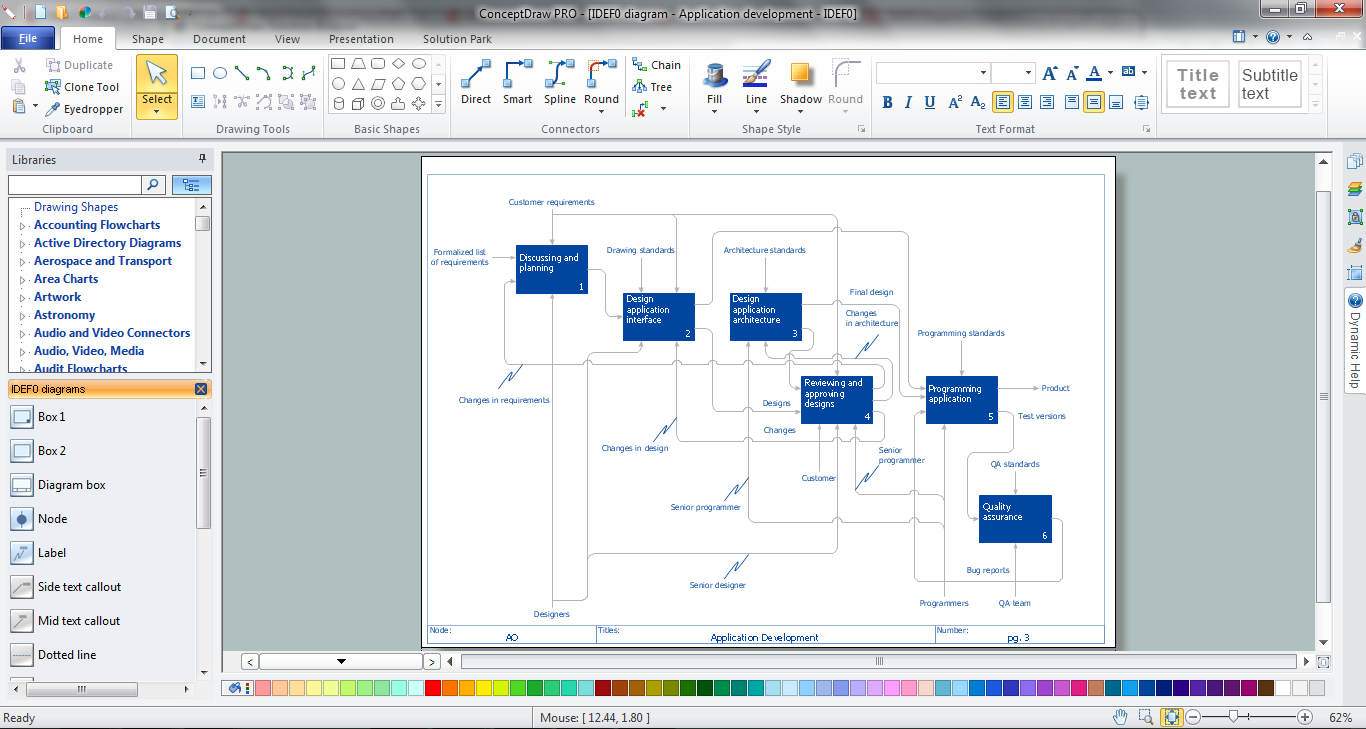
IDEF0 standard with ConceptDraw PRO
The activity of any organization is more or less branchy network of processes. The description of these processes is a hard technical task which requires definite methodology and standards. According to the IDEF0 standard any process can be described in the form of a block (Activity Box) which has inputs and outputs. The process consists in transformation of inputs into outputs under the influence of the management and in the presence of necessary resources. Outputs of the given process later on can be either inputs for the next process or resources, or management means.IDEF0 Visio
ConceptDraw PRO extended with IDEF0 Diagrams solution from the Software Development area of ConceptDraw Solution Park is a powerful diagramming and vector drawing IDEF0 software. All IDEF0 diagrams created in ConceptDraw PRO are vector graphic documents and can be reviewed, modified and converted to MS Visio XML format. To obtain the IDEF0 Visio documents from ConceptDraw PRO documents use the wide export possibilities of ConceptDraw PRO.IDEF0 Software
ConceptDraw PRO diagramming and vector drawing application is a powerful IDEF0 software thanks to the IDEF0 Diagrams solution from the Software Development area of ConceptDraw Solution Park.In searching of alternative to MS Visio for MAC and PC with ConceptDraw PRO
Undoubtedly MS Visio is a powerful and multifunctional tool, but however at times occur the instances, when it turns unable of meeting certain users' requirements. At this cases you may need to use an alternative program software, preferably it will be simple, convenient, and at the same time powerful and professional. In searching the alternative to MS Visio for MAC and PC we recommend you to pay attention for ConceptDraw PRO software, which was developed to satisfy all your drawing needs and requirements. It is a fully-functioned alternative product to MS Visio for both platforms. ConceptDraw PRO software has many advantages, the main among them are the cross-platform compatibility, a reasonable price, widespread ConceptDraw Solution Park with huge variety of different solutions that offer numerous libraries of specialized vector objects, useful examples, samples, and quick-start templates, extensive import / export capabilities, built-in script language, MS Visio support and certainly free technical support.
 IDEF0 Diagrams
IDEF0 Diagrams visualize system models using the Integration Definition for Function Modeling (IDEF) methodology. Use them for analysis, development and integration of information and software systems, and business process modelling.
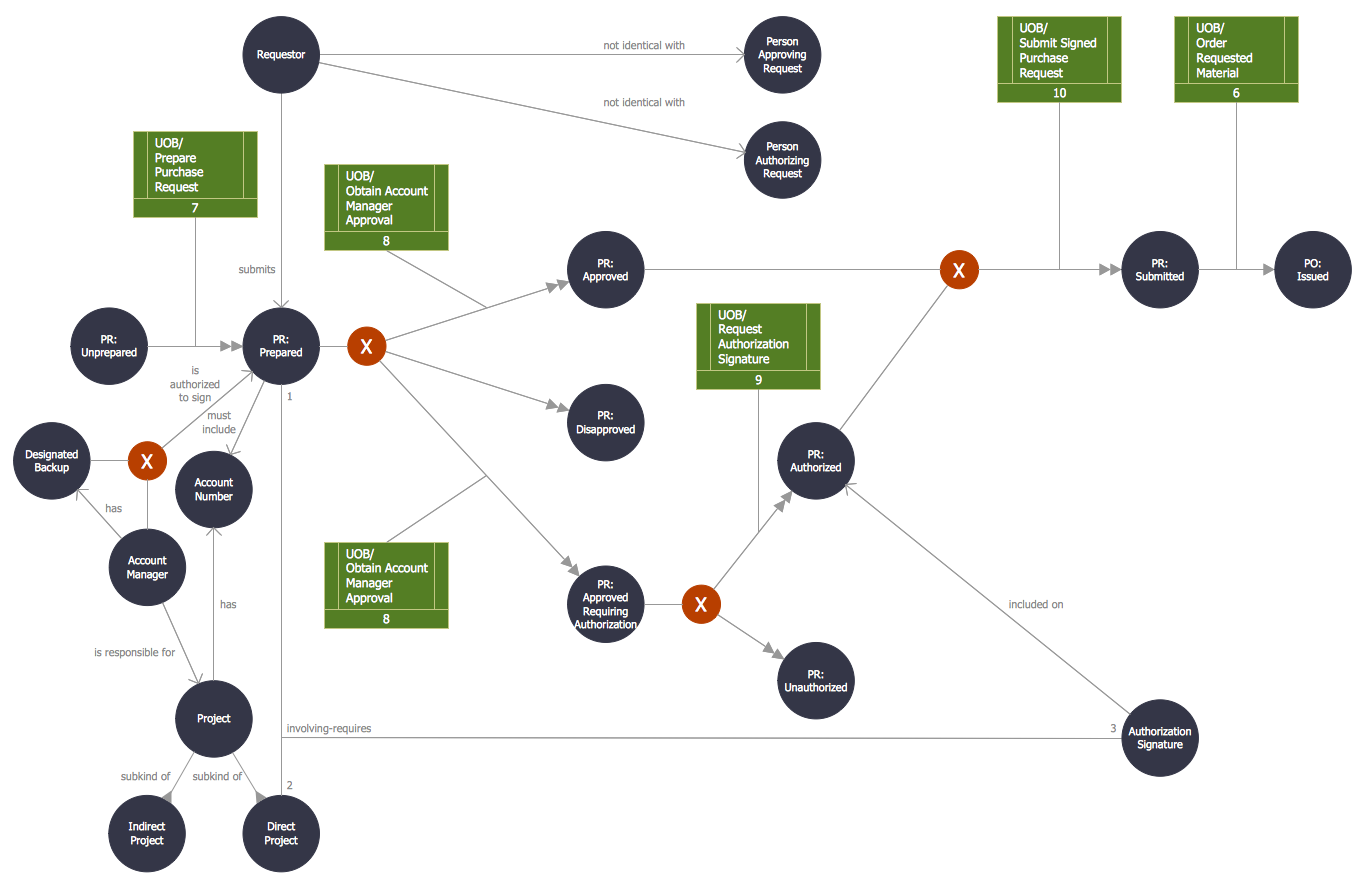
IDEF3 Standard
Use Case Diagrams technology. IDEF3 Standard is intended for description and further analysis of technological processes of an enterprise. Using IDEF3 standard it is possible to examine and model scenarios of technological processes.Swim Lane Diagrams
Swim Lane Diagrams are the kind of process flow diagrams and effective tool for documenting the business processes required for any business company for its productive work, for easy defining the weak points, reasons of defects, or delays during the process. Swim Lane Diagram is based on the IDEF3 standard and was developed primarily for using in projecting. Its name derives from the use of horizontal or vertical lanes. The blocks that denote the parts of the processes are arranged within definite lanes according to the belonging to responsible worker. So the process of any complexity is visually divided into the parts and represented with indication the responsibility for execution of each part. This significantly facilitates the comprehension of its work. Use the ConceptDraw PRO software and predesigned vector objects from the Swim Lanes library of Business Process Mapping Solution included to ConceptDraw Solution Park to easy develop Swim Lanes Flowcharts and Diagrams, for modeling and documenting the business processes in a simple and visual graphic form.IDEF0 Diagram
The vector stencils library IDEF0 Diagram from the solution IDEF0 Diagrams contains specific IDEF0 diagram symbols such as arrow symbols and entity symbols for ConceptDraw PRO diagramming and vector drawing software. The IDEF0 Diagram solution is contained in the Software Development area of ConceptDraw Solution Park.IDEF0 Flowchart Symbols
The modeling of business and business processes is not quite a simple process for both small-size businesses and large businesses. The IDEF0 method is one of the popular and easy methods of modeling the business as a complex system. It is based on the functional modeling language Structured Analysis and Design Technique (abbr. SADT) and is concentrated on the activity modeling. According to this method are constructed the IDEF0 Diagrams and IDEF0 Flowcharts, which are succesfully used not only for documenting the business, but also for analysis, development, integration of information and software systems, reengineering, etc. This method suggests the use of special IDEF0 Flowchart Symbols from the IDEF0 notation for construction the IDEF0 Flowcharts. ConceptDraw PRO diagramming and vector graphic software extended with IDEF0 Diagrams solution from the Software Development area of ConceptDraw Solution Park is rich for the powerful drawing tools, built-in templates and samples, and predesigned IDEF0 flowchart symbols.Process Flowchart
The main reason of using Process Flowchart or PFD is to show relations between major parts of the system. Process Flowcharts are used in process engineering and chemical industry where there is a requirement of depicting relationships between major components only and not include minor parts. Process Flowcharts for single unit or multiple units differ in their structure and implementation. ConceptDraw PRO is Professional business process mapping software for making Process flowcharts, Process flow diagram, Workflow diagram, flowcharts and technical illustrations for business documents and also comprehensive visio for mac application. Easier define and document basic work and data flows, financial, production and quality management processes to increase efficiency of your business with ConcepDraw PRO. Business process mapping software with Flowchart Maker ConceptDraw PRO includes extensive drawing tools, rich examples and templates, process flowchart symbols and shape libraries, smart connectors that allow you create the flowcharts of complex processes, process flow diagrams, procedures and information exchange. Process Flowchart Solution is project management workflow tools which is part ConceptDraw Project marketing project management software. Drawing charts, diagrams, and network layouts has long been the monopoly of Microsoft Visio, making Mac users to struggle when needing such visio alternative like visio for mac, it requires only to view features, make a minor edit to, or print a diagram or chart. Thankfully to MS Visio alternative like ConceptDraw PRO software, this is cross-platform charting and business process management tool, now visio alternative for making sort of visio diagram is not a problem anymore however many people still name it business process visio tools.
 ConceptDraw Solution Park
ConceptDraw Solution Park collects graphic extensions, examples and learning materials
ER Diagram Programs for Mac
ConceptDraw PRO compatible Mac OS X software extended with powerful Entity-Relationship Diagram (ERD) Solution from the Software Development Area for ConceptDraw Solution Park is one of the famous ER Diagram Programs for Mac. It gives the perfect ability to draw ER diagrams for visually describing databases with Chen's and Crow's Foot notation icons.IDEF
IDEF Business Process Diagrams solution from the Business Processes area of ConceptDraw Solution Park extends ConceptDraw PRO vector graphics and diagramming software with the ability of fast and easy drawing various types of IDEF diagrams.Object-Oriented Design
ConceptDraw PRO is a powerful diagramming and vector drawing software. Now, extended with IDEF Business Process Diagrams solution from the Business Processes area of ConceptDraw Solution Park it is incredibly helpful and convenient for object-oriented design.Human Resource Development
Human Resource Development (HRD) focuses on the help employees develop their personal and organizational skills, abilities, and knowledge, HRD also helps to adapt an organization to the changing of external environment. ConceptDraw PRO diagramming and vector drawing software supplied with HR Flowcharts Solution from the Management Area of ConceptDraw Solution Park can effectively help in labour-intensive process of human resource development.- Idef Software Free
- Idef0 Software Mac
- Idef0 Software Free
- IDEF0 Visio | In searching of alternative to MS Visio for MAC and PC ...
- Idef3 Free Software
- Idef0 Software
- Idef0 Mac
- Business Process Modeling Software for Mac | Process Flowchart ...
- IDEF0 standard with ConceptDraw PRO | IDEF0 Diagrams | How to ...
- ConceptDraw PRO Compatibility with MS Visio | Flowchart Software ...
- Flowchart Software | IDEF0 Visio | In searching of alternative to MS ...
- Flowchart Software | In searching of alternative to MS Visio for MAC ...
- Functional Modeling Of Software Process Using Idef0
- IDEF0 Visio | In searching of alternative to MS Visio for MAC and PC ...
- In searching of alternative to MS Visio for MAC and PC with ...
- Flowchart Software | In searching of alternative to MS Visio for MAC ...
- Flowchart Software | IDEF0 Visio | Seating Chart Template Free ...
- Flowchart Software | IDEF0 Visio | In searching of alternative to MS ...
- Flowchart Software | Process Flowchart | IDEF0 Visio | Visio ...
- Idef Software


