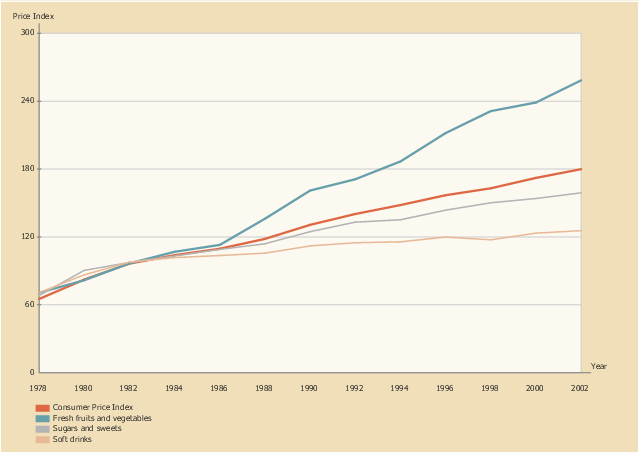
This line graph sample shows the relative price changes for fresh fruits and vegetables, sugars and sweets, and soft drinks, using the period 1982–84 as the baseline (index = 100), 1978–2002. It was designed on the base of line chart from the website of the U.S. National Center for Chronic Disease Prevention and Health Promotion.
"The number of overweight and obese youth has increased in recent decades, yet few data assess how the lives of children have changed during the “obesity epidemic.” ...
Eating as a primary activity declined, suggesting a shift toward snacking or eating as a secondary activity. Statistically significant trends exist for carbohydrate intake, especially for chips/ crackers/ popcorn/ pretzels (intake tripled from the mid-1970s to the mid-1990s) and soft drinks (intake doubled during the same period). Price and income data suggest possible economic reasons for these changes. The percentage of disposable income spent on food has declined continuously, and almost all of the decline has been represented by food consumed at home, yet today’s disposable income buys more calories than it has in the past. Relative prices have encouraged shifts across food types. From a baseline of 100 during 1982–84, the price index for fresh fruit and vegetables increased to 258 by 2002 (far exceeding general inflation), whereas the price index for soft drinks increased only to 126 by 2002 (below general inflation)." [cdc.gov/ pcd/ issues/ 2005/ apr/ 04_ 0039.htm]
The line chart example "Relative price changes for fresh fruits and vegetables, sugars, sweets, soft drinks" was created using the ConceptDraw PRO diagramming and vector drawing software extended with the Line Graphs solution from the Graphs and Charts area of ConceptDraw Solution Park.
The vector stencils library "Picture Graphs" contains 35 templates of picture bar graphs for visual data comparison and time series.
Drag a template from the library to your document, set bars number, type category labels, select bars and enter your data.
Use these shapes to draw your pictorial bar charts in the ConceptDraw PRO diagramming and vector drawing software.
The vector stencils library "Picture Graphs" is included in the Picture Graphs solution from the Graphs and Charts area of ConceptDraw Solution Park.
Bar Chart Template for Word
All these bar chart templates are included in the Bar Graphs solution. You can quickly rework these bar graph templates into your own charts by simply changing displayed data, title and legend texts.Fruit Art
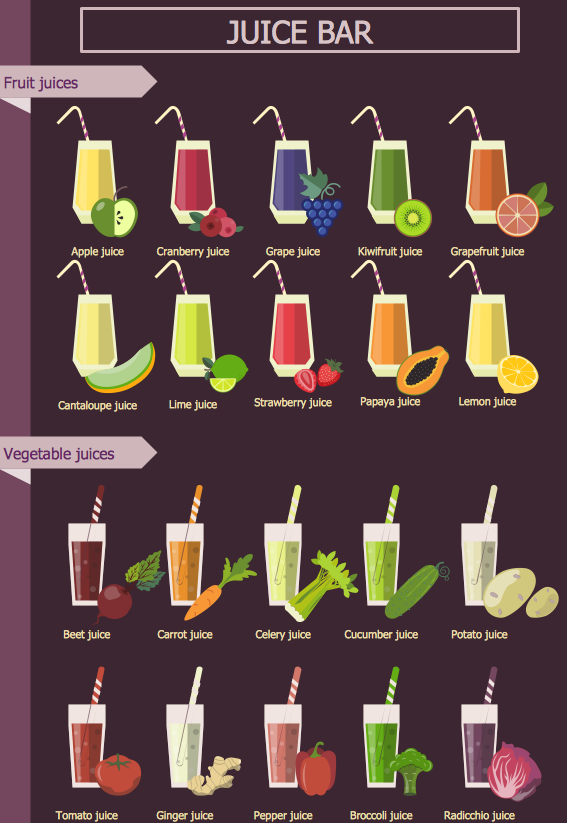
Fruits are unique products, they are beautiful and delicious, and look amazing in the compositions. Fruits are perfect for decorating various dishes, desserts and beverage. Each composition of fruits is a real fruit art! ConceptDraw DIAGRAM diagramming and vector drawing software extended with Food Court solution from the Food and Beverage area of ConceptDraw Solution Park perfectly suits for fruit art design and easy drawing attractive food and beverage illustrations.Pictures of Vegetables
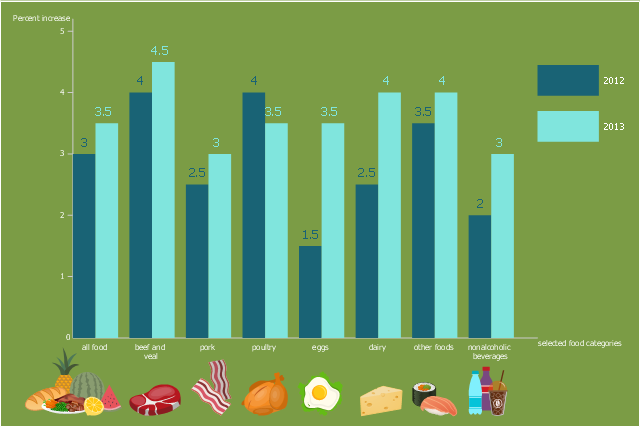
Designing of food images, fruit art illustrations, pictures of vegetables, and many other food and cafe related images and infographics has never been easier than it is now with ConceptDraw DIAGRAM software. ConceptDraw DIAGRAM diagramming and vector drawing software extended with Food Court solution from the Food and Beverage area of ConceptDraw Solution Park is perfect food pictures design software.This double bar chart sample shows the forecasted impacts of 2012 drought expected to be larger in 2013 for most foods. It was designed in the base of the graph from the webpage "Price impacts of 2012 drought expected to be larger in 2013 for most foods" on the website of the United States Department of Agriculture Economic Research Service. [ers.usda.gov/ data-products/ chart-gallery/ detail.aspx?chartId=29456&ref=collection#.Ue5MMaxad5I]
"A price index (plural: “price indices” or “price indexes”) is a normalized average (typically a weighted average) of price relatives for a given class of goods or services in a given region, during a given interval of time. It is a statistic designed to help to compare how these price relatives, taken as a whole, differ between time periods or geographical locations.
Price indexes have several potential uses. For particularly broad indices, the index can be said to measure the economy's general price level or a cost of living. More narrow price indices can help producers with business plans and pricing. Sometimes, they can be useful in helping to guide investment." [Price index. Wikipedia]
The column chart example "Changes in price indices" was created using the ConceptDraw PRO diagramming and vector drawing software extended with the Bar Graphs solution from the Graphs and Charts area of ConceptDraw Solution Park.
 Pie Charts
Pie Charts are extensively used in statistics and business for explaining data and work results, in mass media for comparison (i.e. to visualize the percentage for the parts of one total), and in many other fields. The Pie Charts solution for ConceptDraw DIAGRAM offers powerful drawing tools, varied templates, samples, and a library of vector stencils for simple construction and design of Pie Charts, Donut Chart, and Pie Graph Worksheets.
 Food Court
Use the Food Court solution to create food art. Pictures of food can be designed using libraries of food images, fruit art and pictures of vegetables.
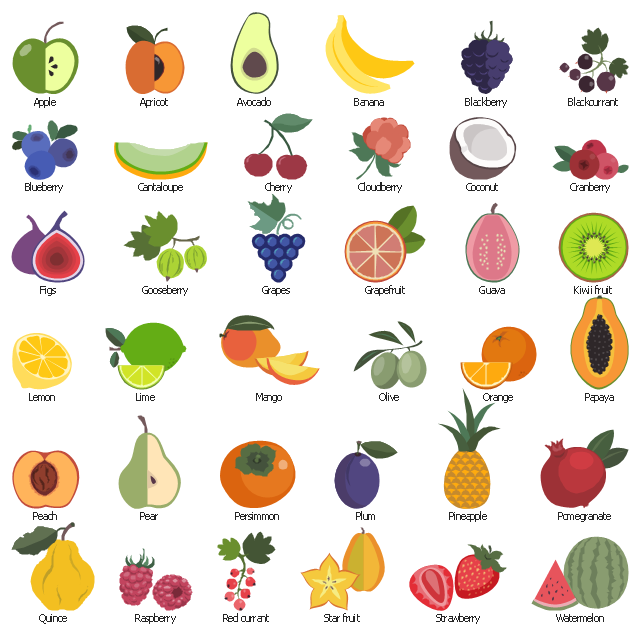
The vector stencils library "Fruits" contains 36 fruit icons: pome fruits, berries, citrus fruits, apricots, tropical fruits, melons, grapes, etc.
Use fruits clipart to design your food, culinary, cuisine and nutrition illustrations, infographics and presentations.
Fruits icon set also useful for drawing fresh juices, desserts, salads and vegetarian dishes.
"In common language usage, "fruit" normally means the fleshy seed-associated structures of a plant that are sweet or sour and edible in the raw state, such as apples, oranges, grapes, strawberries, bananas, and lemons." [en.wikipedia.org/ wiki/ Fruit]
The clip art example "Design elements - Fruits" was created using the ConceptDraw PRO diagramming and vector drawing software extended with the Food Court solution from the Food and Beverages area of ConceptDraw Solution Park.
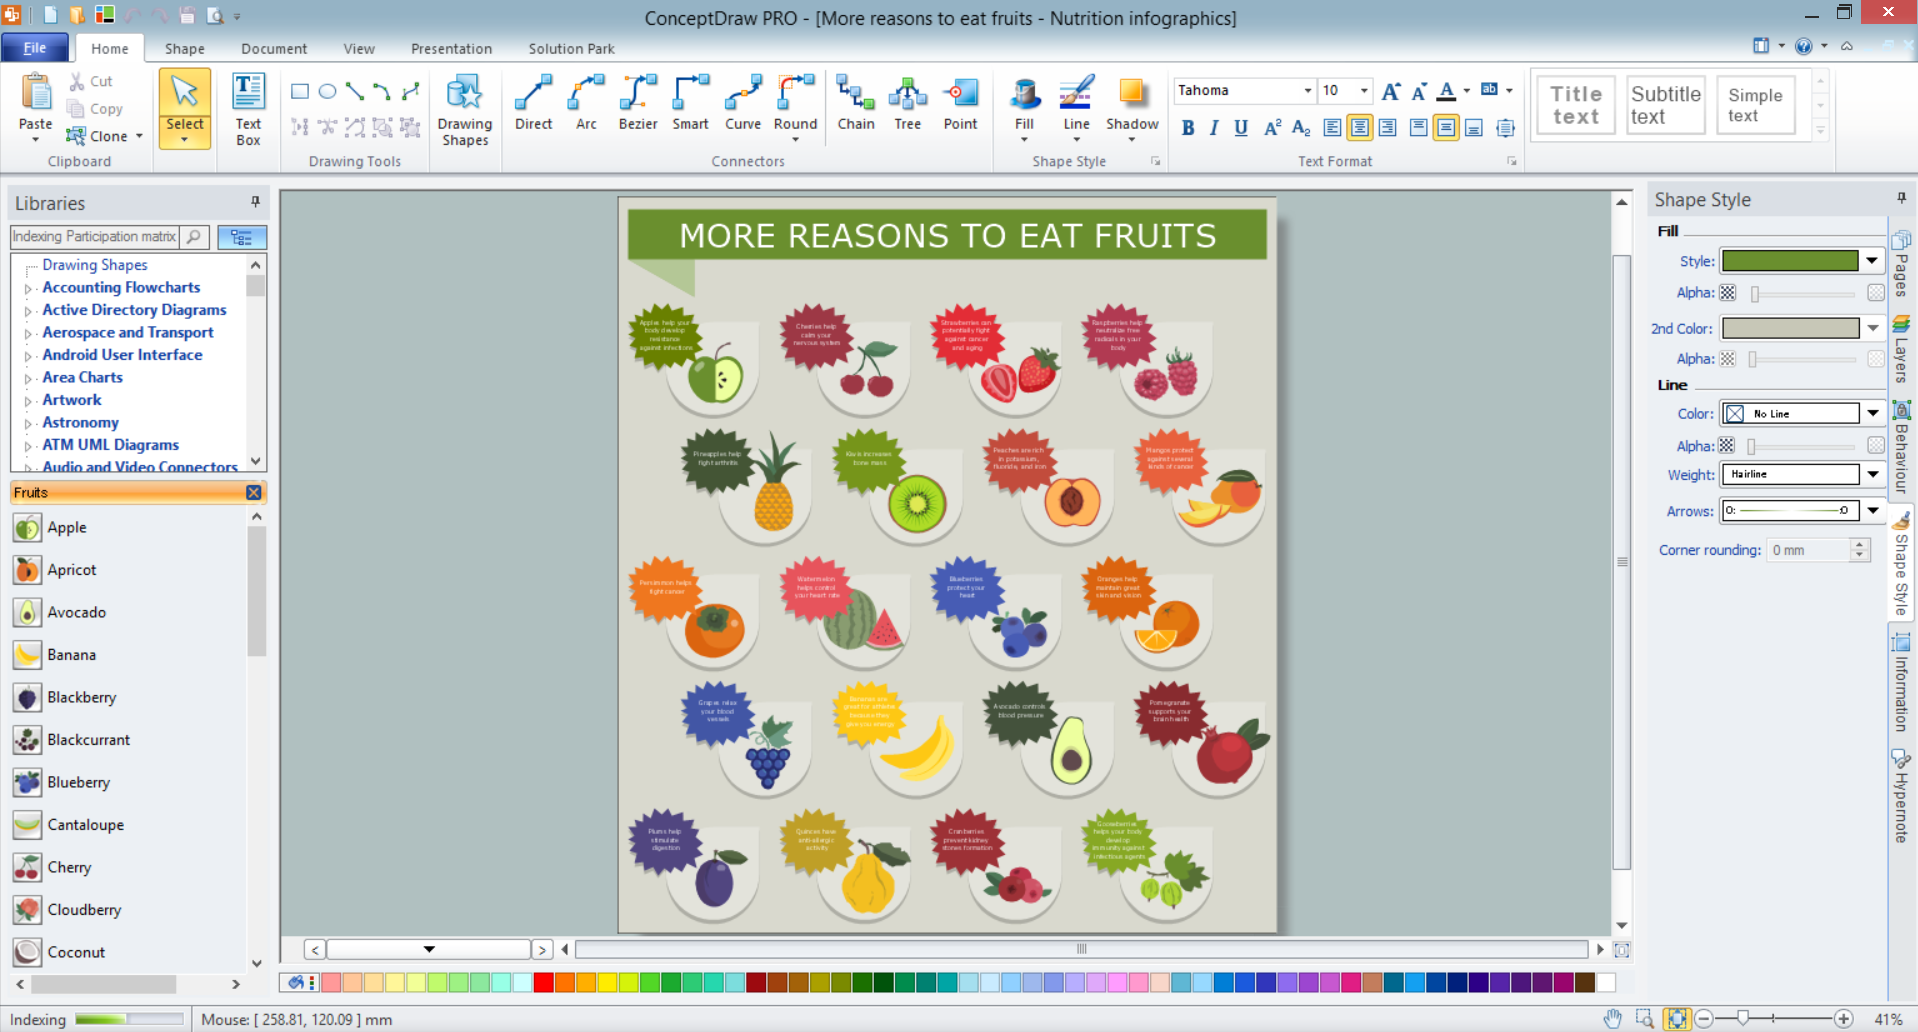
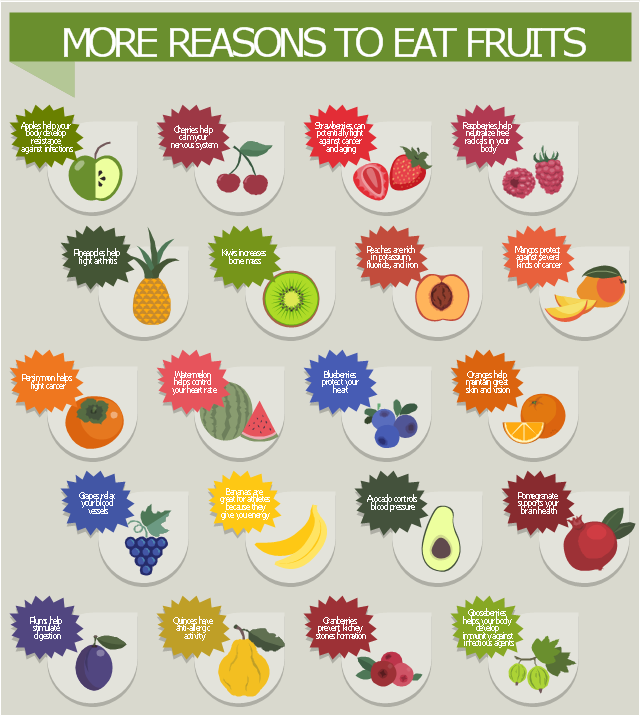
This infographics visualizes what health benefits are provided by eating fruits.
"Fruits are generally high in fiber, water, vitamin C and sugars. ... Fruits also contain various phytochemicals that do not yet have an RDA/ RDI listing under most nutritional factsheets, and which research indicates are required for proper long-term cellular health and disease prevention. Regular consumption of fruit is associated with reduced risks of cancer, cardiovascular disease (especially coronary heart disease), stroke, Alzheimer disease, cataracts, and some of the functional declines associated with aging.
Diets that include a sufficient amount of potassium from fruits and vegetables also help reduce the chance of developing kidney stones and may help reduce the effects of bone-loss. Fruits are also low in calories which would help lower one's calorie intake as part of a weight-loss diet." [en.wikipedia.org/ wiki/ Fruit]
The nutrition infographic example "More reasons to eat fruits" was designed using the ConceptDraw PRO diagramming and vector drawing software extended with the Food Court solution from the Food and Beverages area of ConceptDraw Solution Park.
- Fruit Art | Food Images | Bar Chart Template for Word | Drawing ...
- Food Images | Food Court | Fruit Chart Competition Example
- Fruit And Vegetable Clipart Chart
- Fruit Art | Drawing Illustration | Drawing a Nature Scene | Flow ...
- Flow Chart For Fruits Shop Management System
- Health Food | Food Court | Drawing Illustration | Flowchart Of Fruits ...
- Relative price changes for fresh fruits and vegetables, sugars ...
- Healthy Diet | Fruit Art | Food Images | Perfect Dait Chart Hd Pic
- Fruit Art | Types of Flowchart - Overview | Chore charts with ...
- Fruit Art | Pictures of Vegetables | Healthy Foods | Fruits Clipart
