Process Flowchart


Types of Flowchart - Overview


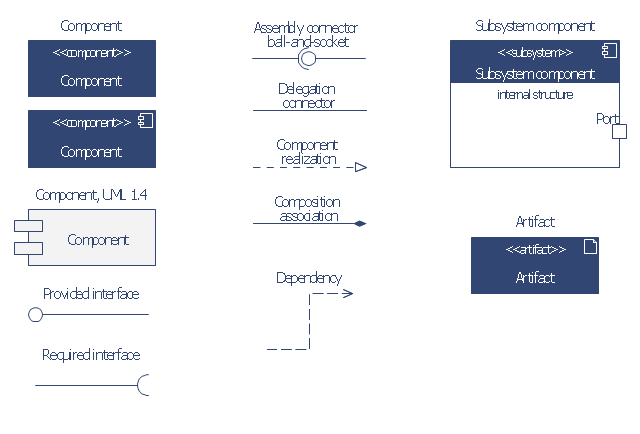
The vector stencils library "Bank UML component diagram" contains 13 shapes for drawing UML component diagrams.
Use it for object-oriented modeling of your bank information system.
"A component is something required to execute a stereotype function. Examples of stereotypes in components include executables, documents, database tables, files, and library files.
Components are wired together by using an assembly connector to connect the required interface of one component with the provided interface of another component. This illustrates the service consumer - service provider relationship between the two components. ...
When using a component diagram to show the internal structure of a component, the provided and required interfaces of the encompassing component can delegate to the corresponding interfaces of the contained components. ...
Symbols.
This may have a visual stereotype in the top right of the rectangle of a small rectangle with two even smaller rectangles jutting out on the left.
The lollipop, a small circle on a stick represents an implemented or provided interface. The socket symbol is a semicircle on a stick that can fit around the lollipop. This socket is a dependency or needed interface." [Component diagram. Wikipedia]
This example of UML component diagram symbols for the ConceptDraw PRO diagramming and vector drawing software is included in the ATM UML Diagrams solution from the Software Development area of ConceptDraw Solution Park.
UML component diagram symbols
Example of DFD for Online Store (Data Flow Diagram) DFD Example


Material Requisition Flowchart. Flowchart Examples

 Audio and Video Connectors
The Audio and Video Connectors solution contains a set of video connectors, audio connectors and s video connection; you will also find pre-designed objects, libraries, templates, and samples, allowing quick and easy diagramming of various configurations
 Business Processes Area
Solutions of Business Processes area extend ConceptDraw PRO software with samples, templates and vector stencils libraries for drawing business process diagrams and flowcharts for business process management.
 Network Security Diagrams
The Network Security Diagrams solution presents a large collection of predesigned cybersecurity vector stencils, cliparts, shapes, icons and connectors to help you succeed in designing professional and accurate Network Security Diagrams, Network Security Infographics to share knowledge about effective ways of networks protection with help of software and network security devices of different cyber security degrees, Network Plans for secure wireless network, Computer Security Diagrams to visually tell about amazing possibilities of IT security solutions. The samples and examples reflect the power of ConceptDraw PRO software in drawing Network Security Diagrams, give the representation about variety of existing types of attacks and threats, help to realize their seriousness and the methods to deal with them.
 Business and Finance
Use Business and Finance solution to make professional-looking documents, presentations and websites, business, finance, advertising, and project management illustrations, or any designs that requires clipart of currency, office, business, advertising, management, marketing, people, time, post, contacts, collaboration, etc.
- Function Of Information System With Diagram
- 4 Level pyramid model diagram - Information systems types | 5 Level ...
- Chart Of Management Information System With Diagram
- Cross Functional Information Systems Diagram
- Management Information System With Example In Flow Chart
- Management Information System Block Diagram
- Role Of Information System With Diagram
- Explain Haierarchy Inforatin System With Diagram
- How to Create an Event-driven Process Chain Diagram (EPC) in ...
- Pyramid Diagrams | Development Of Information System Hierachy
- Function Of Infotrmation System With Suitable Diagram
- Function Model Diagram Template
- A Diagram The Role Of Information System In A Business
- Types of Flowcharts | Data Flow Diagrams | IDEF9 Standard ...
- Management Information Systems Business Process Flowchart
- Explain Hierarchy Information System With Diagram
- DFD Library System | Data Flow Diagram Symbols. DFD Library ...
- Quality Control Chart Software — ISO Flowcharting | Design ...
- Example For Management Information System With Diagram